Lightweight Linux Server Monitoring Checklist for Small Teams
Jul 20, 2026
Mariusz Antonik
Automation
6 min read
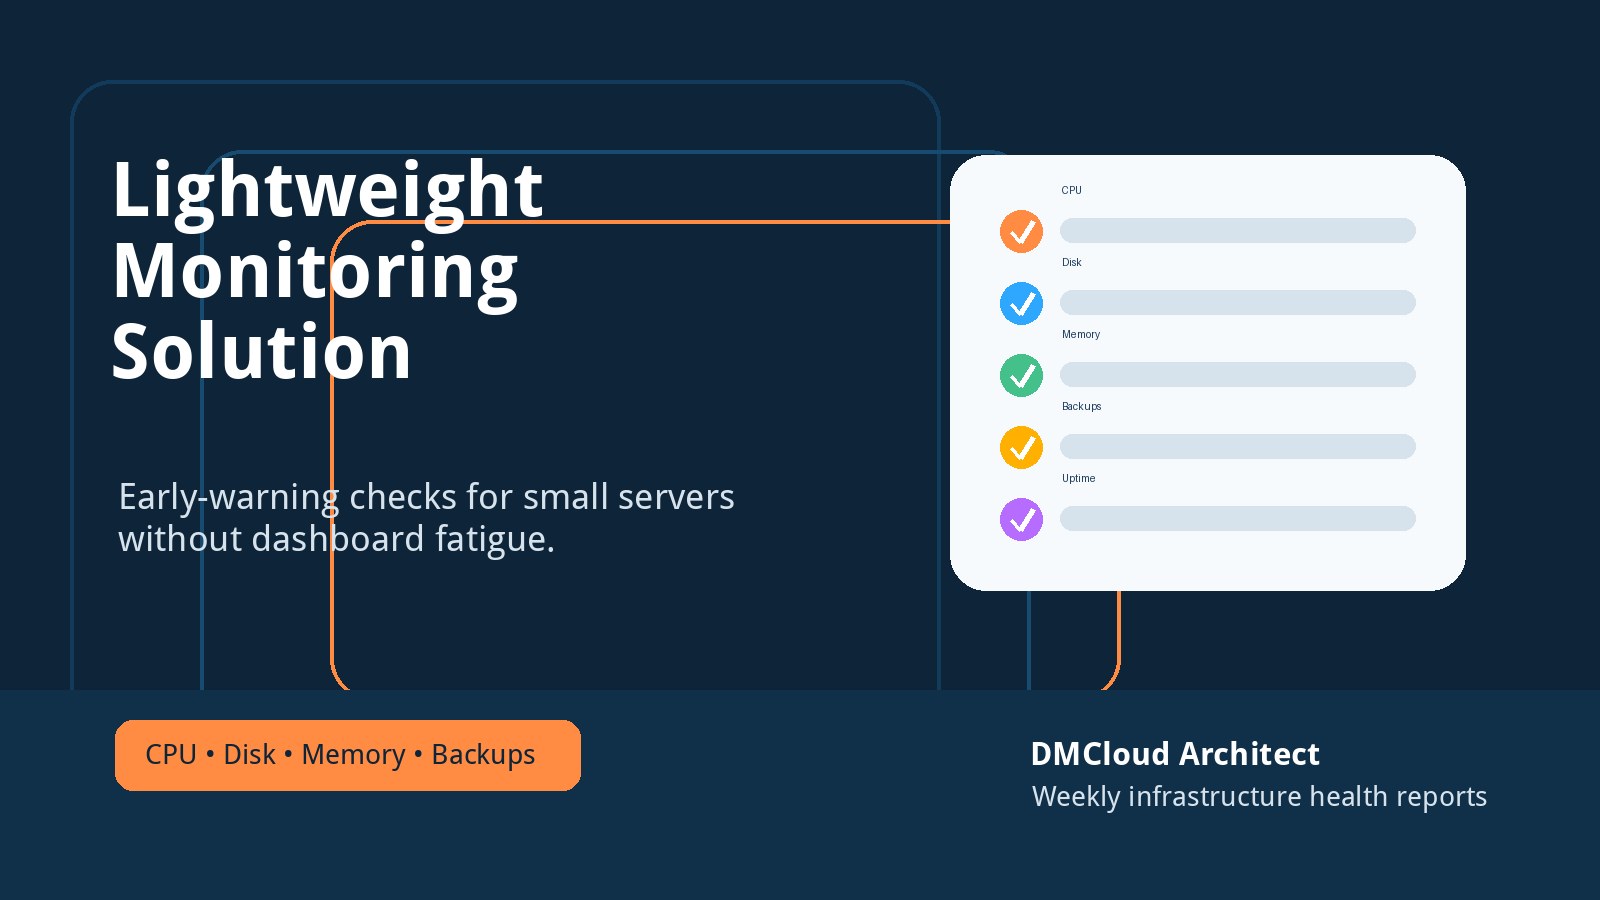
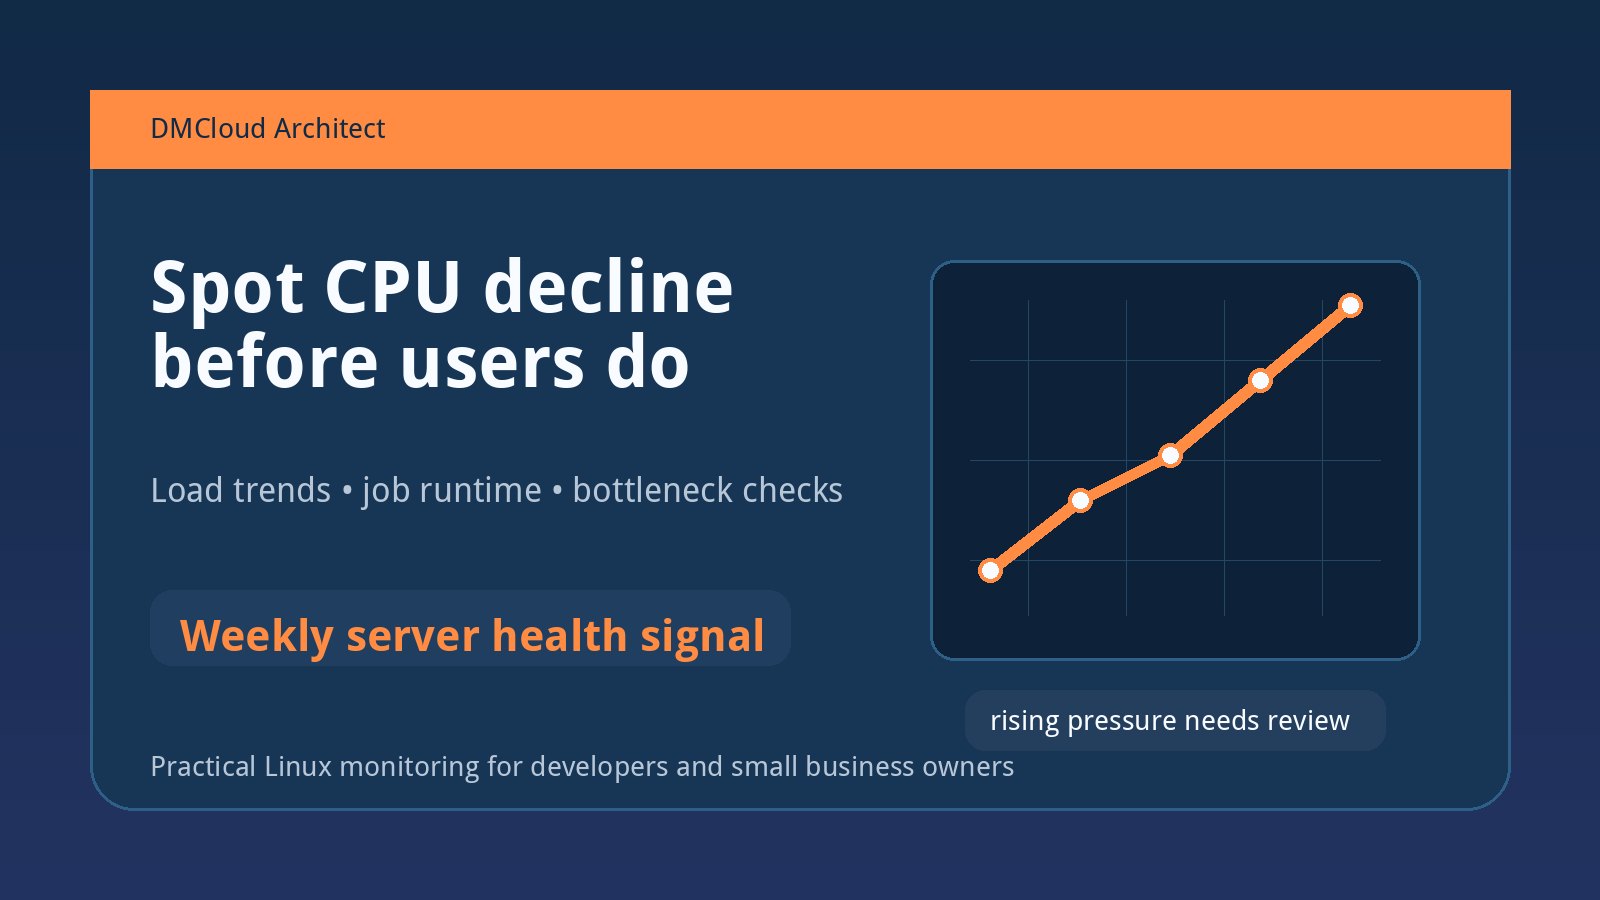
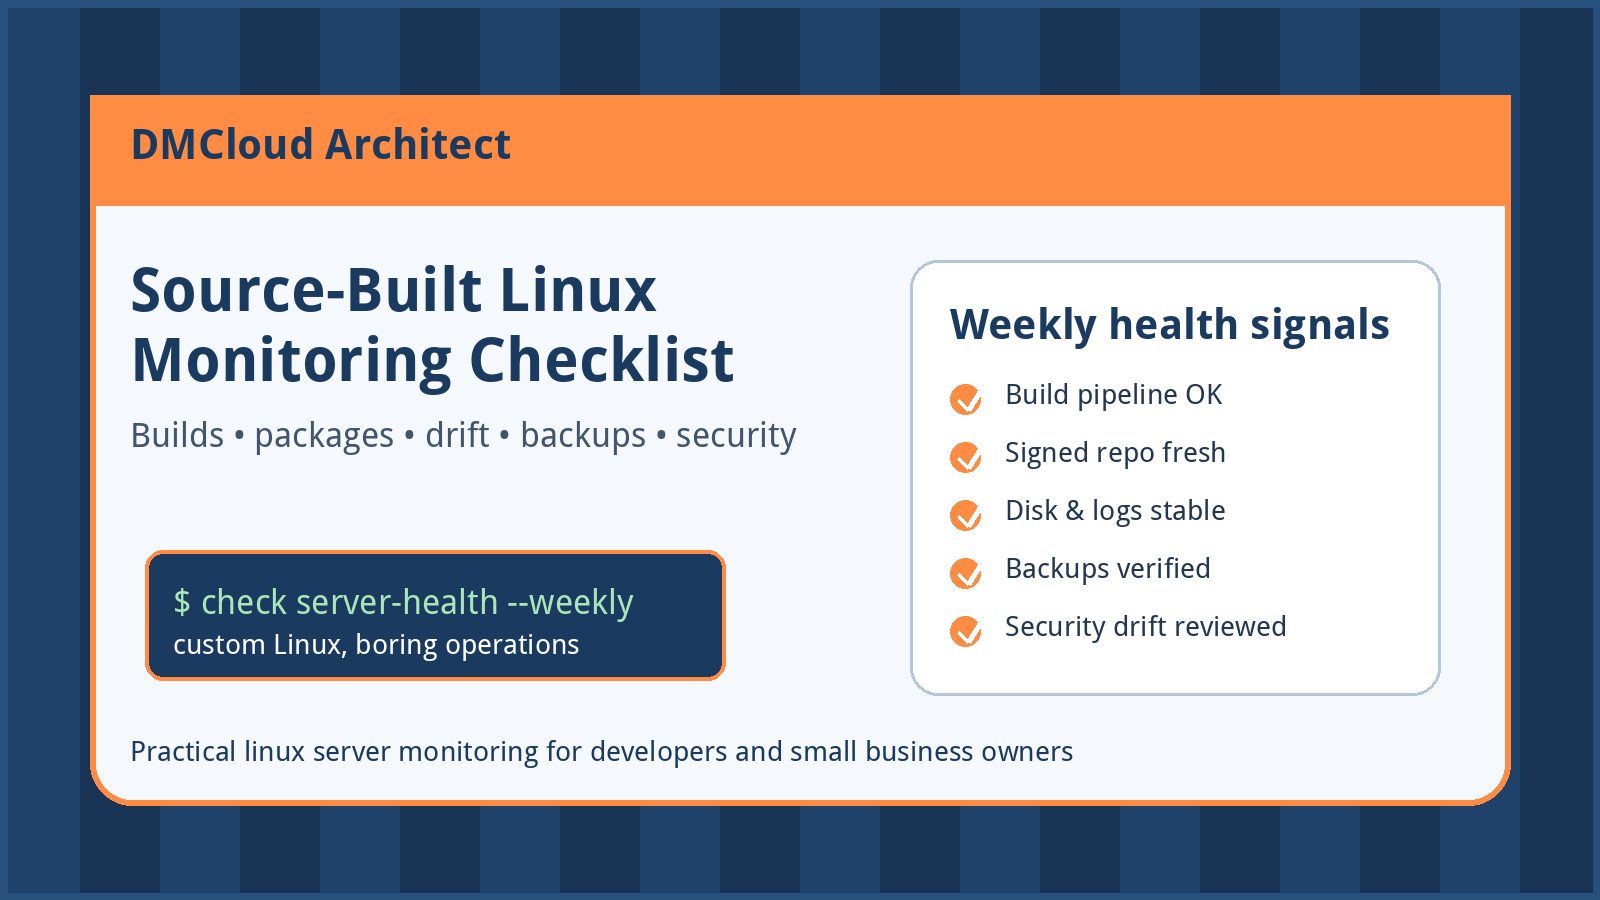
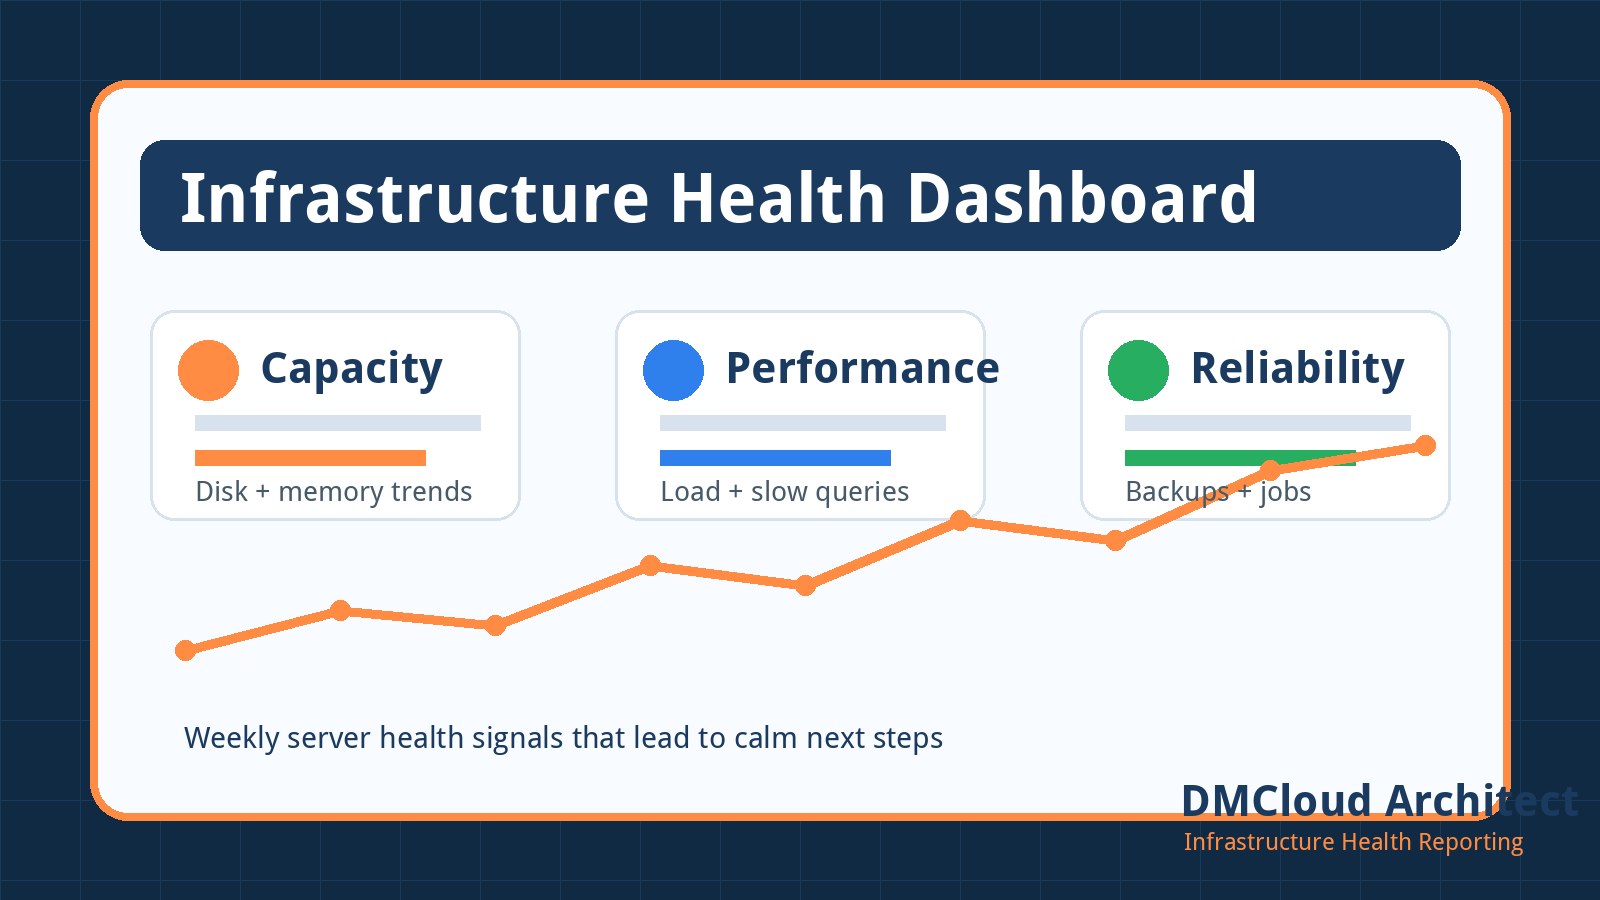
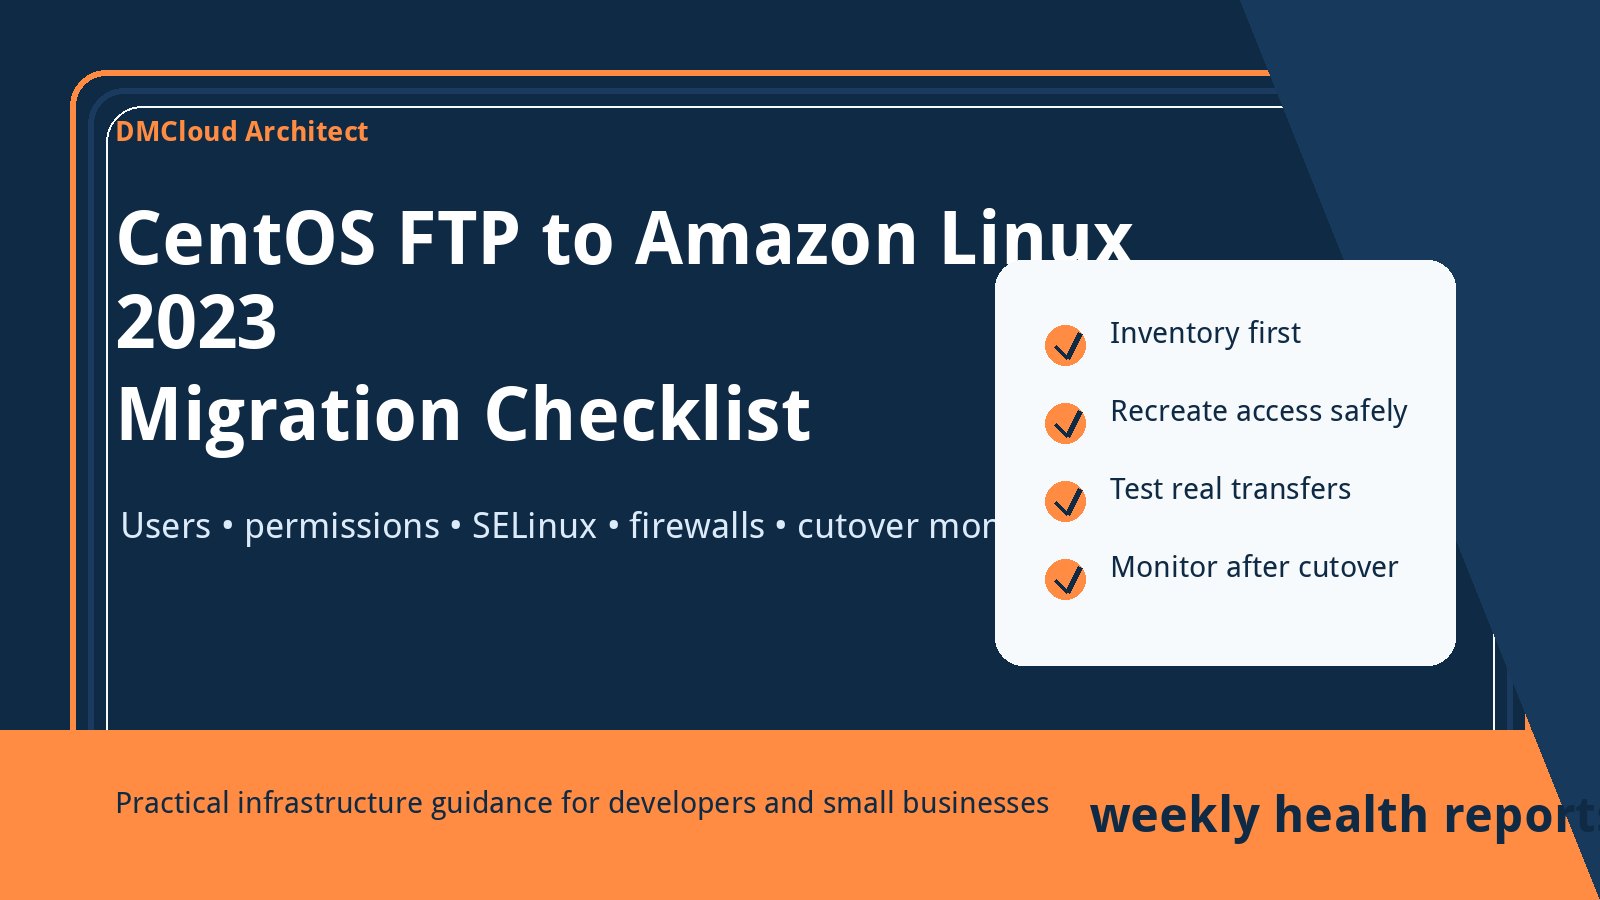
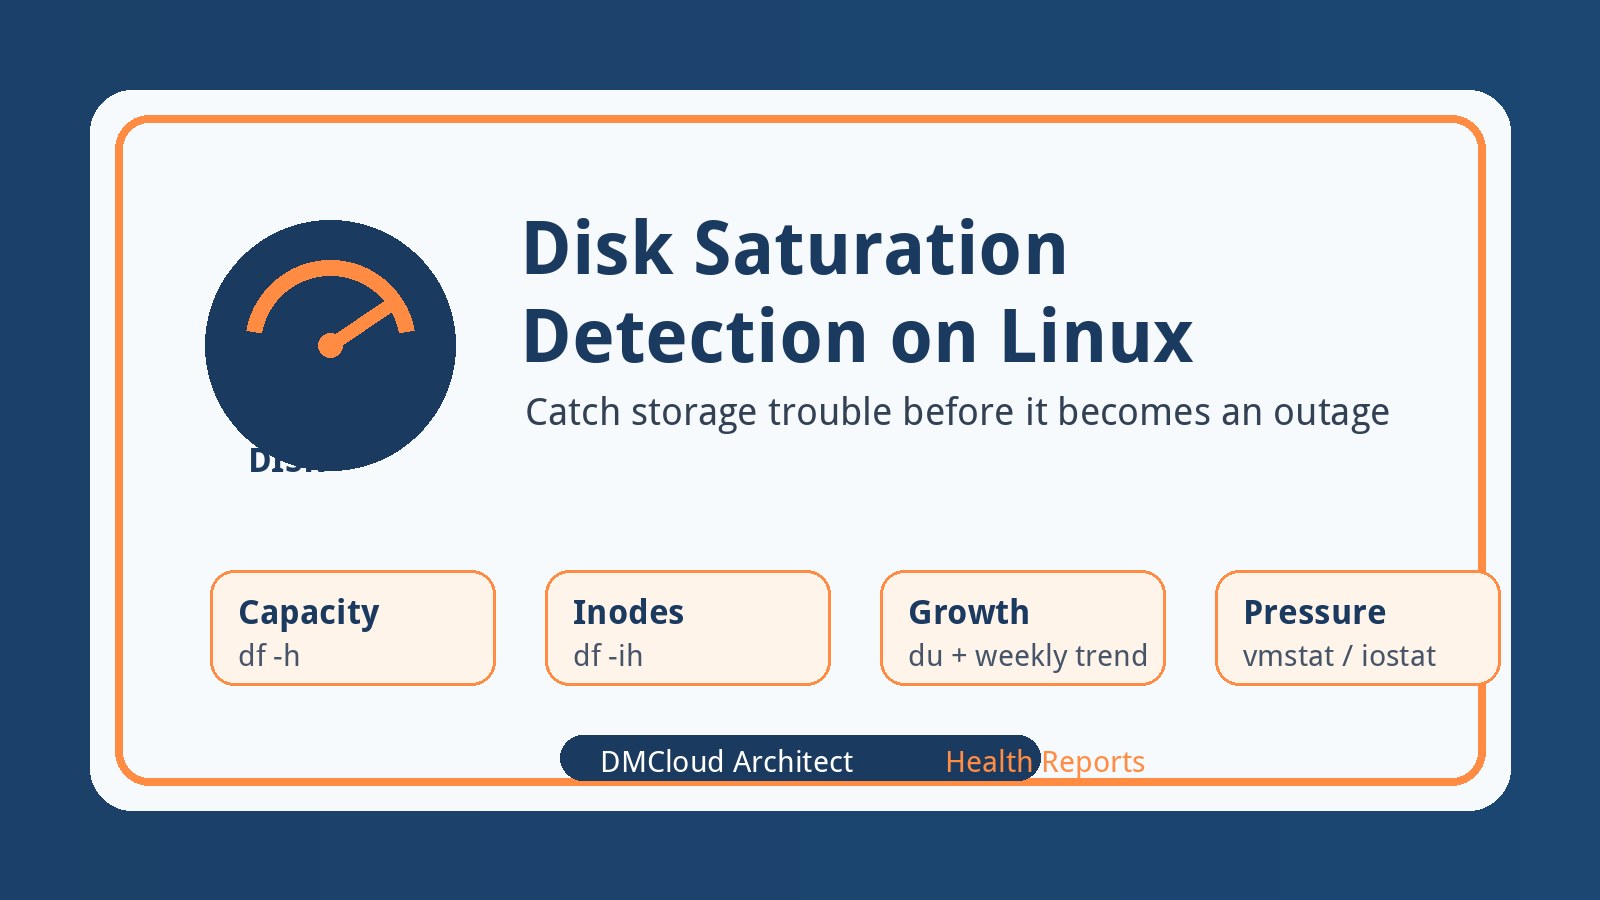
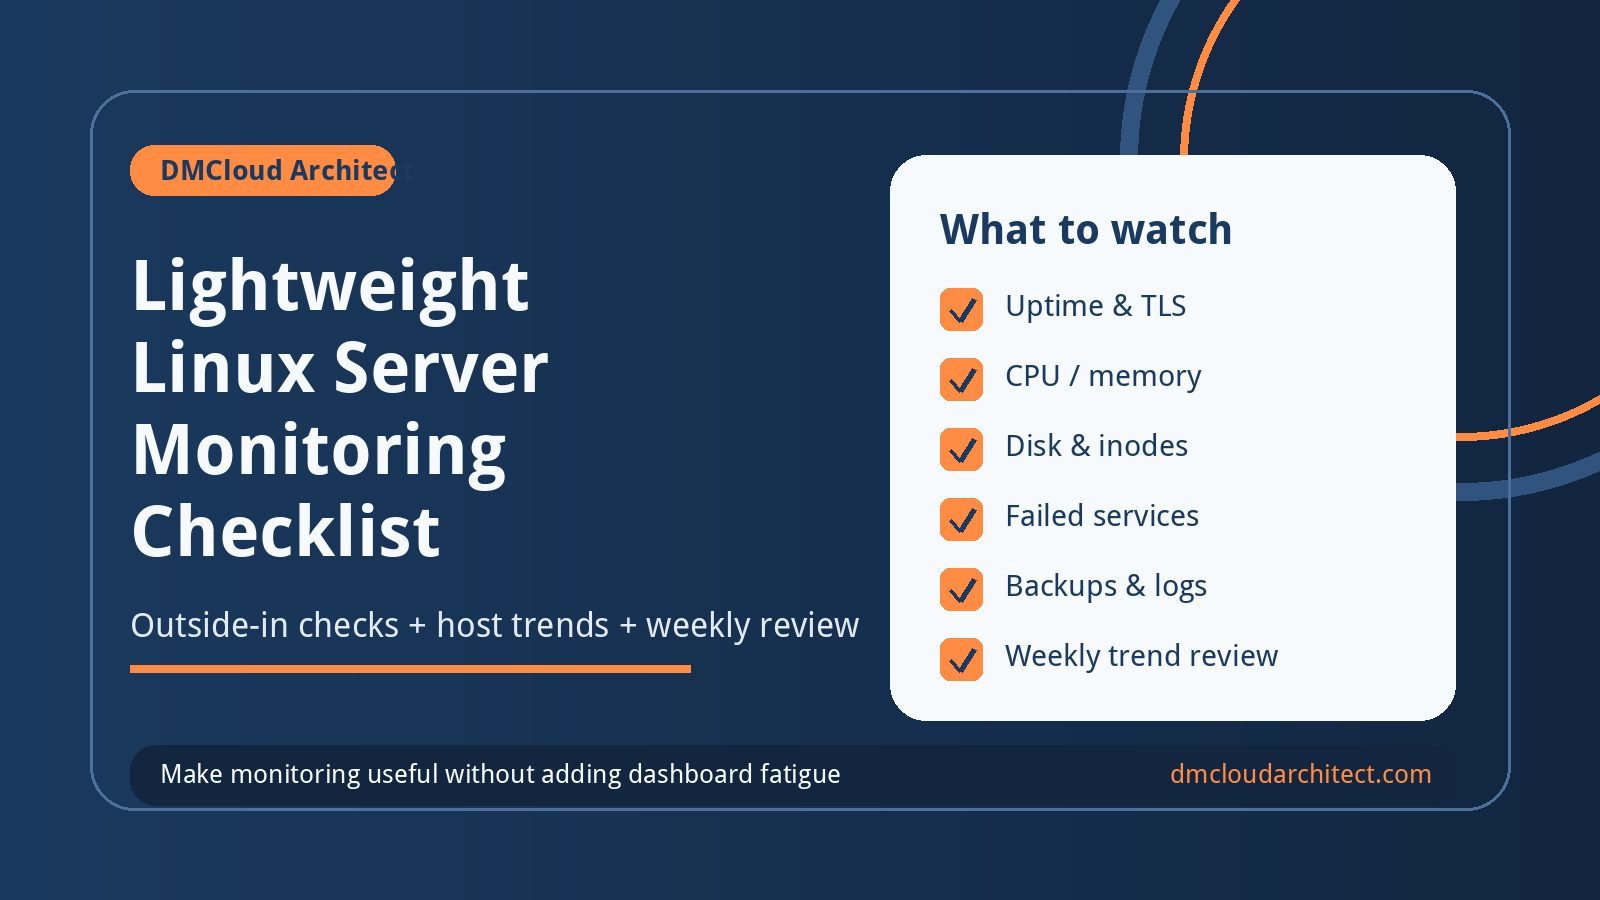
Lightweight linux server monitoring should tell you whether a small production server is healthy without forcing your team to live inside another dashboard. The best setup starts with a short checklist of signals, ownership, alert rules, and weekly review habits before you choose a tool. Use this guide to decide what to monitor, what to ignore, and how to make external checks useful for real business continuity.
#cloudflare-workers
#lightweight monitoring
#linux server monitoring
#server health
#small business IT
#sysadmin-checklist
#uptime-checks
Read More