Linux Monitoring Tools: Practical Guide for Small Teams
Most Linux environments don’t fail suddenly. They degrade over time—CPU slowly climbs, disk usage creeps up, memory pressure increases, and MySQL queries take longer. The problem is that many teams only notice these issues when something breaks.
This is where the right approach to linux monitoring tools becomes critical. Not just tools that alert you after a problem happens, but tools that help you understand how your systems behave over time.
Why Linux Monitoring Matters
Linux servers often run critical workloads—web apps, databases, APIs, and background jobs. Without visibility, small inefficiencies turn into outages.
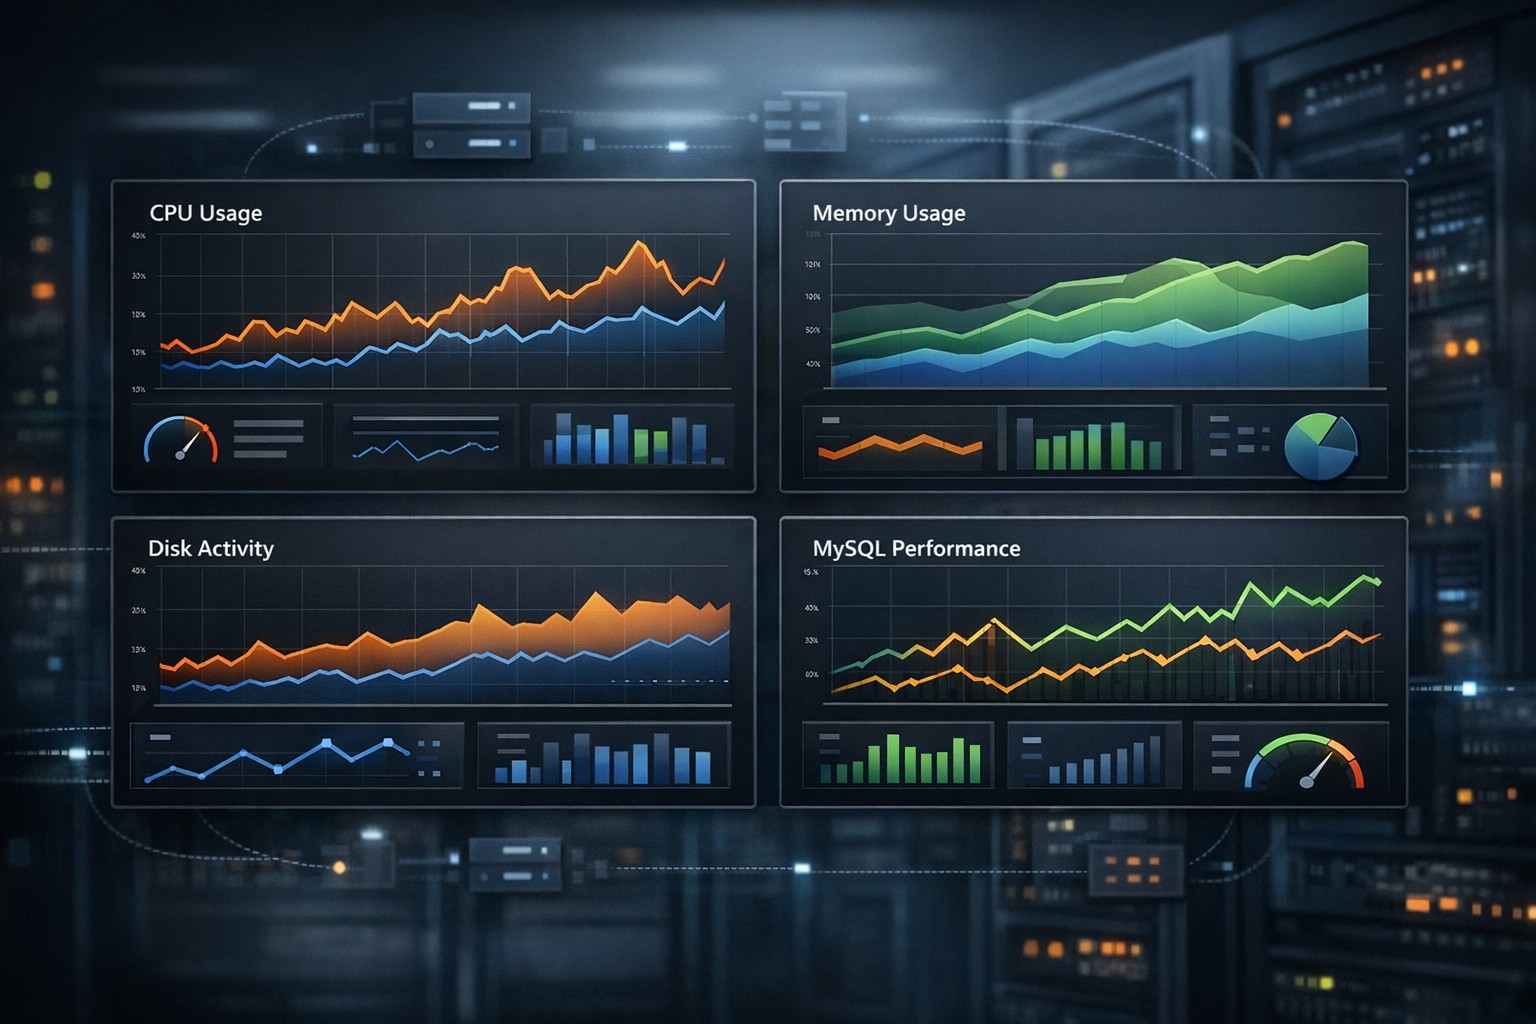
Traditional monitoring often focuses on real-time alerts. While useful, it creates noise. What many teams actually need is a clear view of trends:
- Is CPU usage increasing week over week?
- Is disk I/O getting slower?
- Are MySQL queries gradually degrading?
Answering these questions is the foundation of effective linux server monitoring.
Types of Linux Monitoring Tools
Not all tools serve the same purpose. Understanding the categories helps you choose the right setup.
1. Real-Time Monitoring Tools
Tools like top, htop, and iotop show what’s happening right now. They’re useful for debugging live issues but don’t provide historical insight.
2. Metrics Collection Tools
These tools collect system metrics such as CPU, memory, disk, and network usage over time. Examples include Prometheus and collectd. They are powerful but often require significant setup.
3. Full Observability Stacks
Platforms like Grafana, ELK, or Datadog provide dashboards and alerting. However, they can be complex and heavy for small teams.
4. Lightweight Monitoring and Reporting
This is where many teams find the best balance. Lightweight linux monitoring tools focus on simplicity and trend visibility instead of overwhelming dashboards.
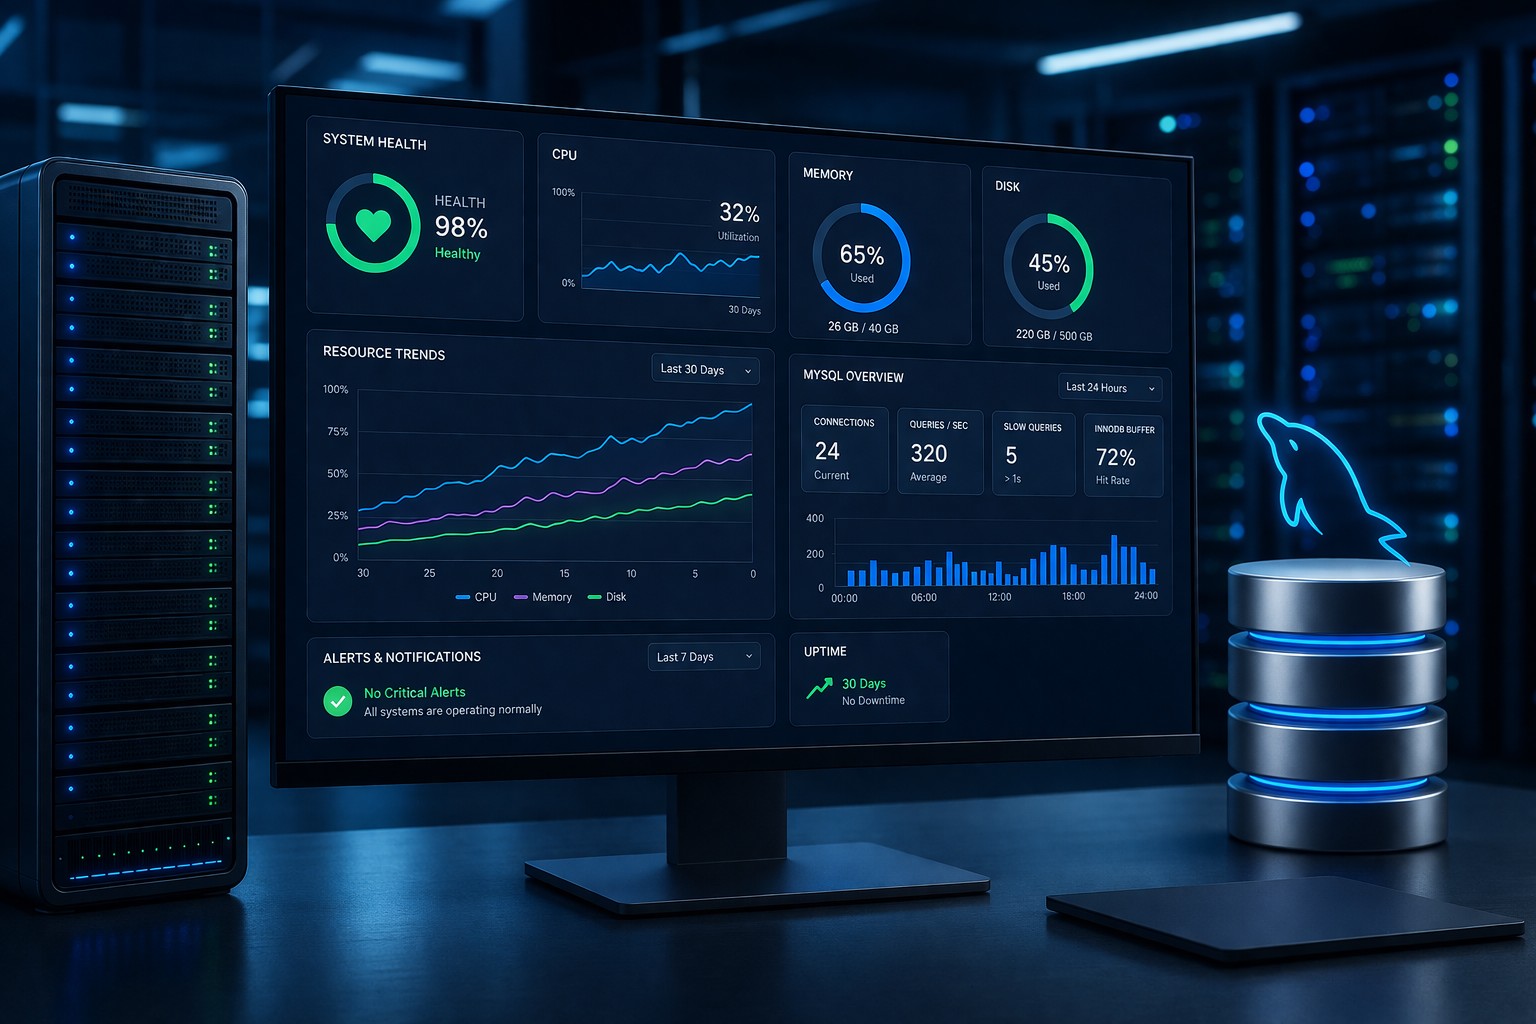
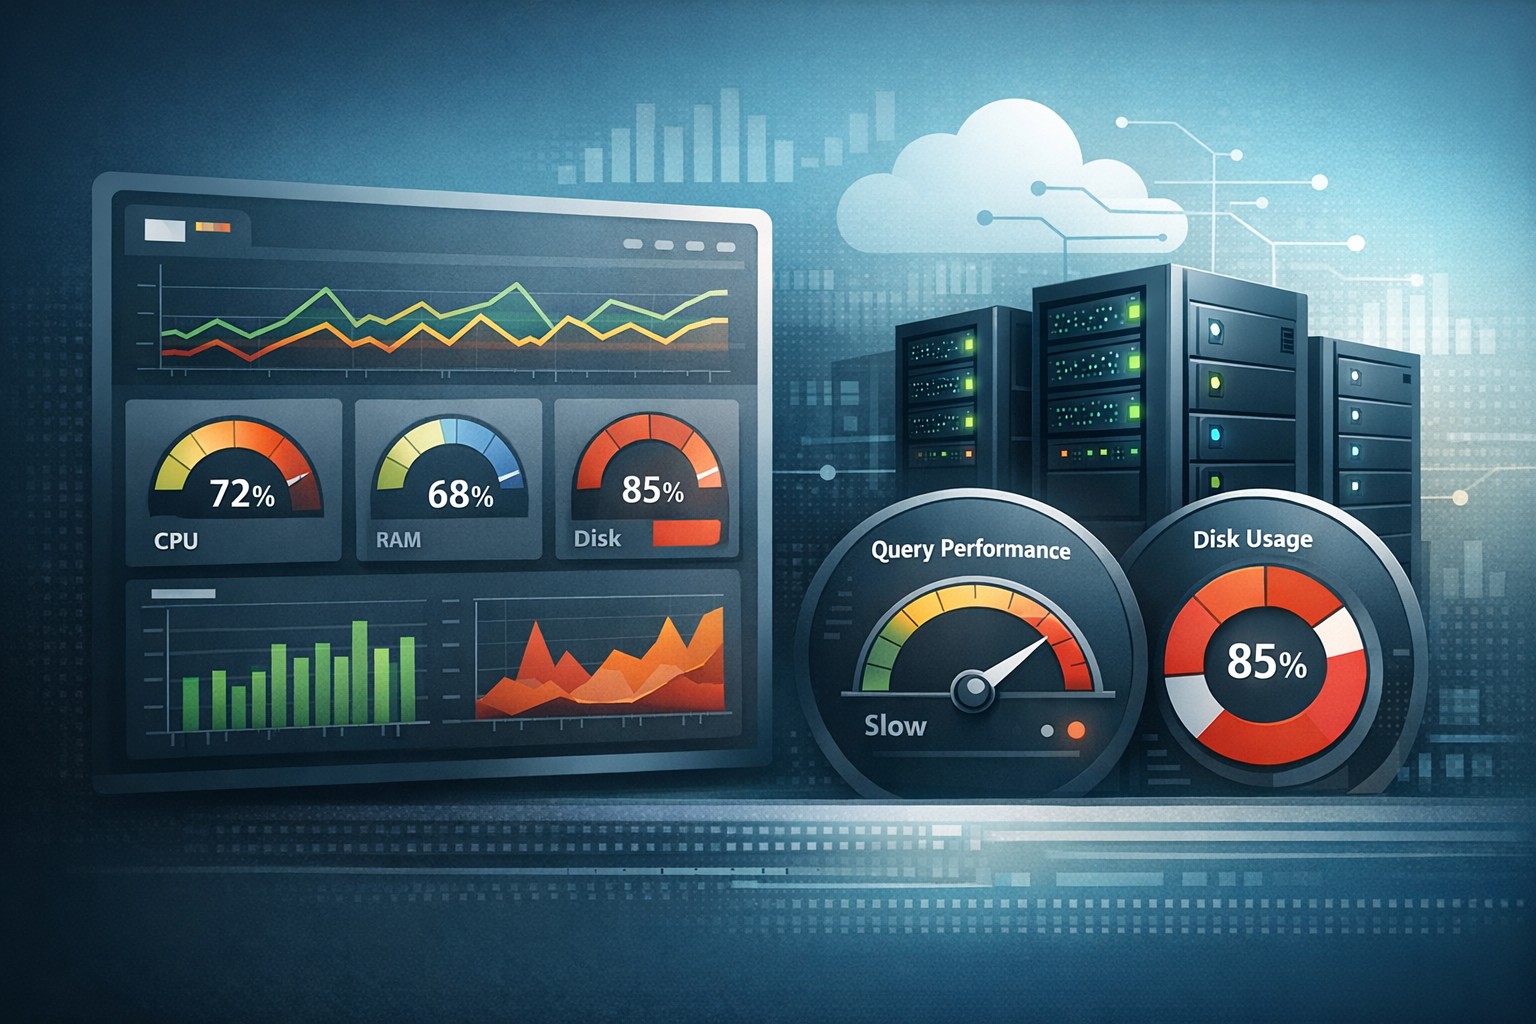
What to Monitor on a Linux Server
A practical linux monitoring setup should focus on key system health indicators:
- CPU usage: sustained high usage often signals inefficient processes
- Memory usage: swapping and memory pressure can degrade performance
- Disk usage: full disks cause application failures
- Disk I/O: slow storage impacts everything
- Load average: shows system stress over time
- MySQL performance: slow queries and connection growth
The goal isn’t to track everything—it’s to monitor what actually impacts performance and stability.
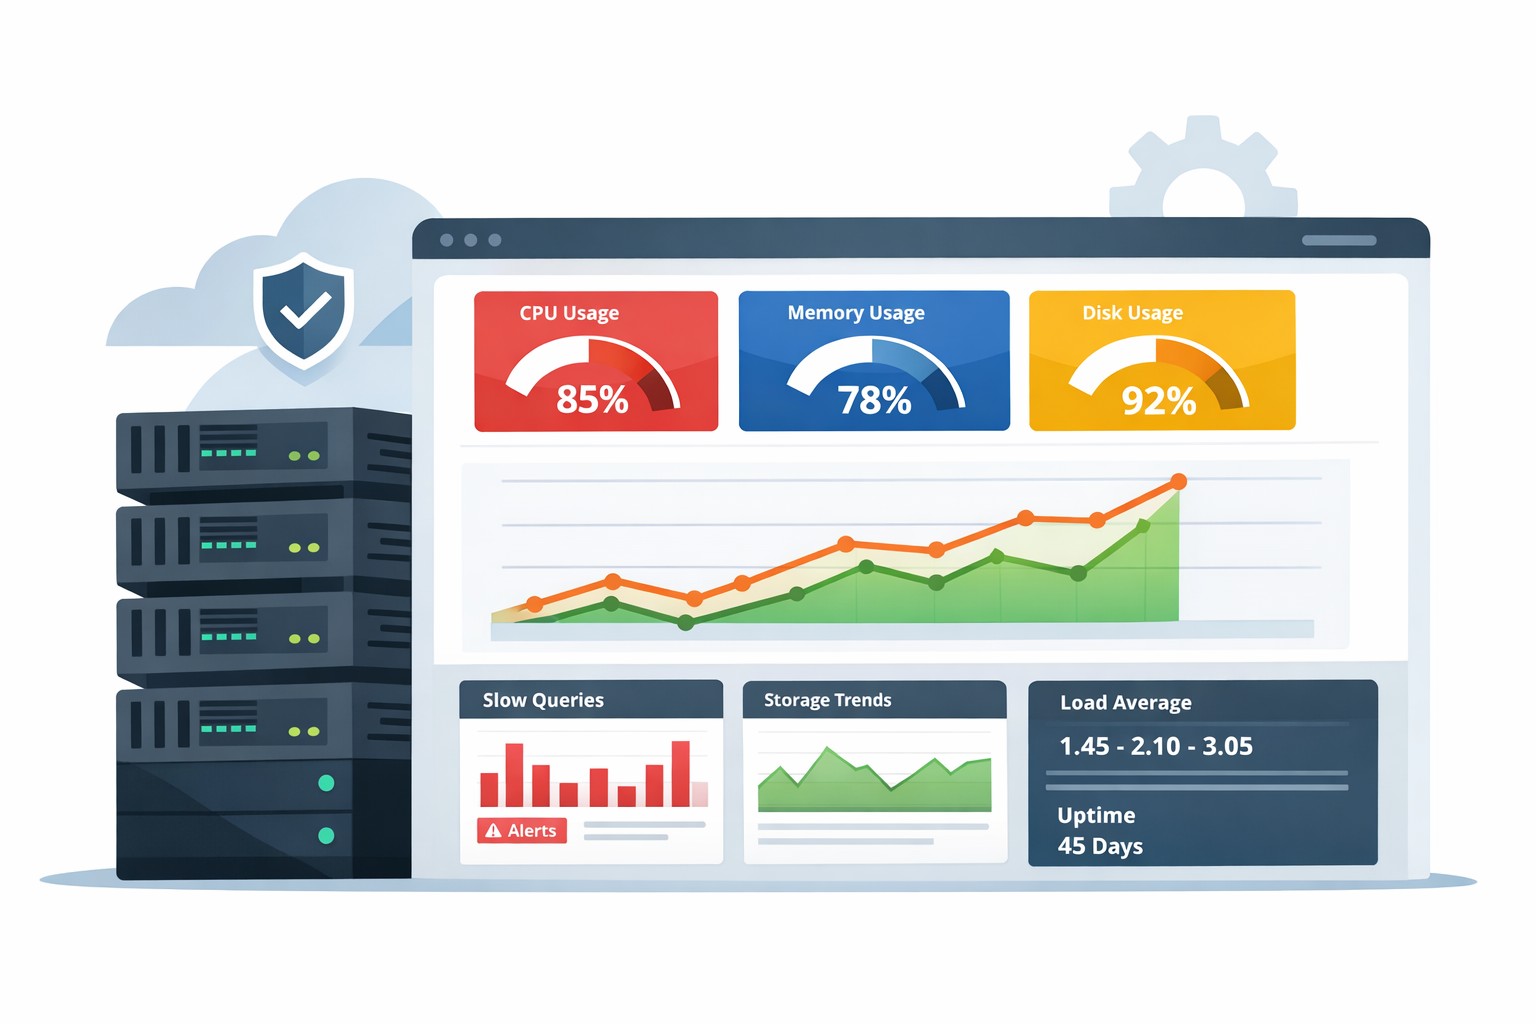
Real-World Example
Consider a small SaaS team running a Linux server with MySQL. Everything appears fine day-to-day, but over several weeks:
- Disk usage grows from 60% to 85%
- Average query time increases by 20%
- CPU spikes become more frequent
No alerts are triggered because thresholds aren’t crossed. But performance is clearly degrading.
With proper trend-based monitoring, this pattern becomes obvious early. The team can clean up disk space, optimize queries, and avoid a production incident.
Choosing Simple Linux Monitoring Tools
For many teams, the best approach is not adding more complexity but simplifying visibility.
Look for tools that provide:
- Historical trends instead of just real-time metrics
- Weekly or daily reports
- Clear summaries instead of noisy dashboards
- Easy setup without heavy infrastructure
This aligns with a lightweight linux monitoring strategy that focuses on understanding system behavior over time.
Common Mistakes to Avoid
- Over-monitoring: collecting too many metrics without actionable insight
- Alert fatigue: too many alerts reduce signal quality
- No historical context: missing long-term trends
- Complex tooling: systems that require constant maintenance
Summary
Linux monitoring tools are not just about detecting failures—they’re about understanding how your systems evolve. The most effective setups focus on trends, simplicity, and actionable insights rather than overwhelming dashboards.
If you want a clearer view of how your infrastructure behaves over time, explore Infrastructure Health Reporting. It’s designed to give small teams practical visibility into Linux and MySQL performance without the complexity of traditional monitoring stacks.