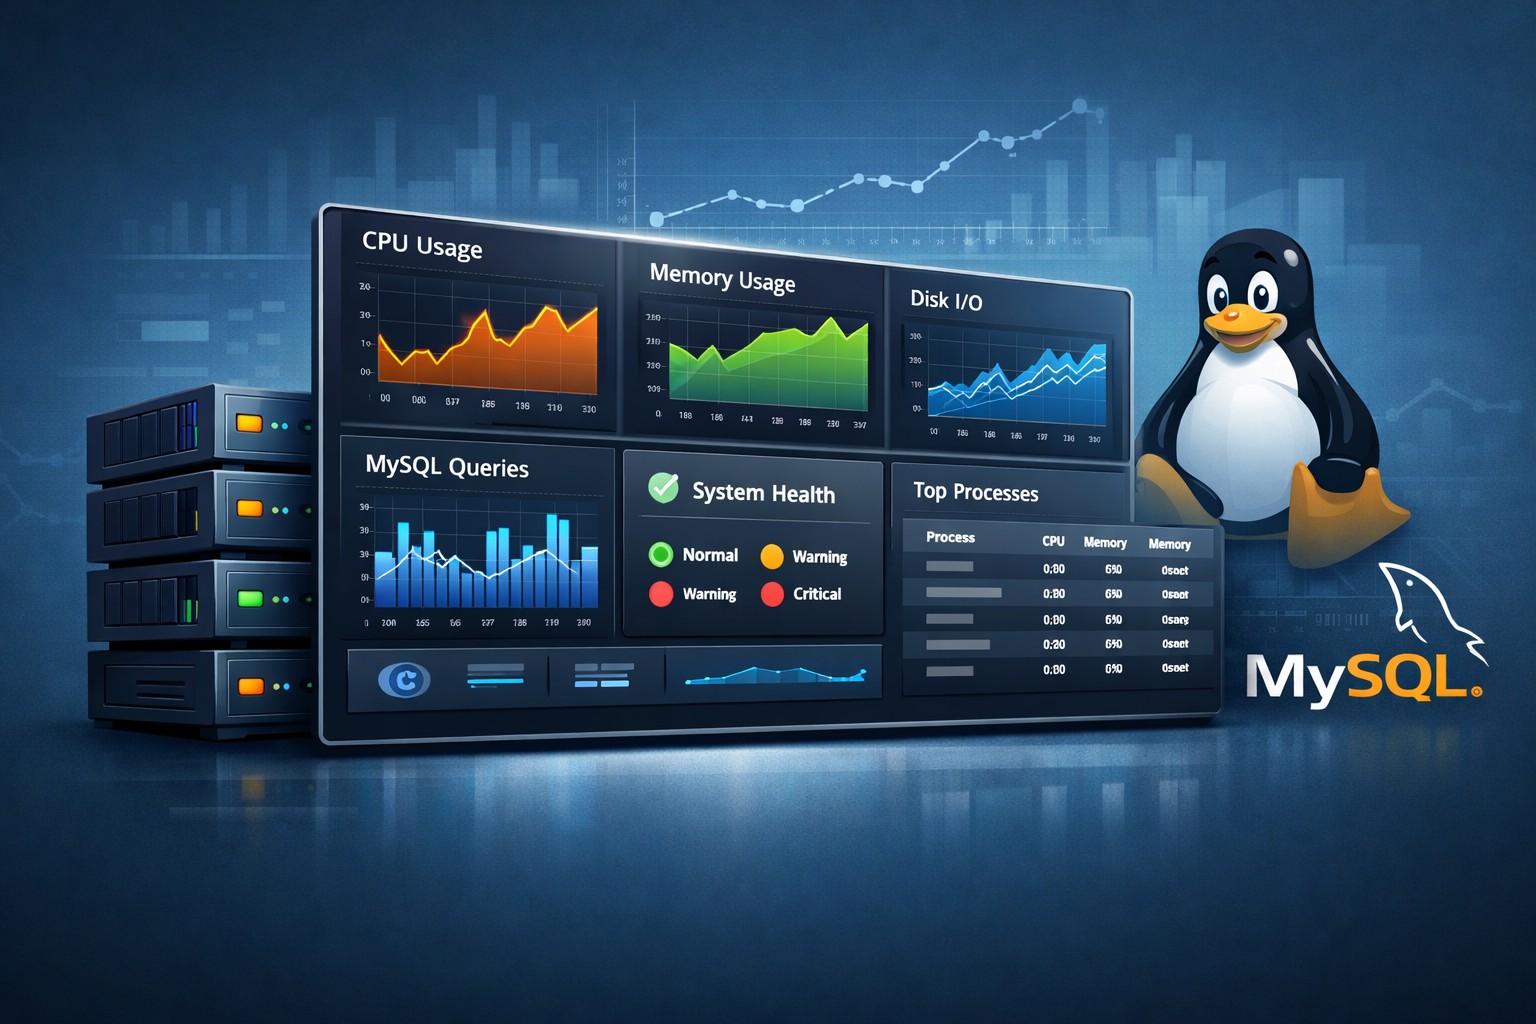
Server Trend Analysis: How to Monitor Performance Over Time
Most infrastructure issues don’t appear suddenly—they build up over time. CPU usage slowly creeps higher, disk space steadily fills, and database queries gradually become slower. By the time alerts trigger, the problem is already affecting users.
This is where server trend analysis becomes essential. Instead of reacting to isolated spikes, teams can understand how systems behave over days, weeks, and months, making it easier to prevent outages before they happen.
Why Server Trend Analysis Matters
Traditional monitoring focuses on real-time alerts. While useful, it often misses the bigger picture. Trend-based monitoring looks at historical server behavior and highlights patterns that would otherwise go unnoticed.
For example:
- Gradual memory consumption increases due to a slow leak
- Weekly spikes in CPU tied to batch jobs
- Disk growth trends that predict capacity exhaustion
- MySQL query performance degrading over time
Without historical context, these patterns look like isolated incidents. With trend analysis, they become predictable and manageable.
What to Track for Effective Trend Monitoring
To get real value from infrastructure trends monitoring, focus on a few critical metrics:
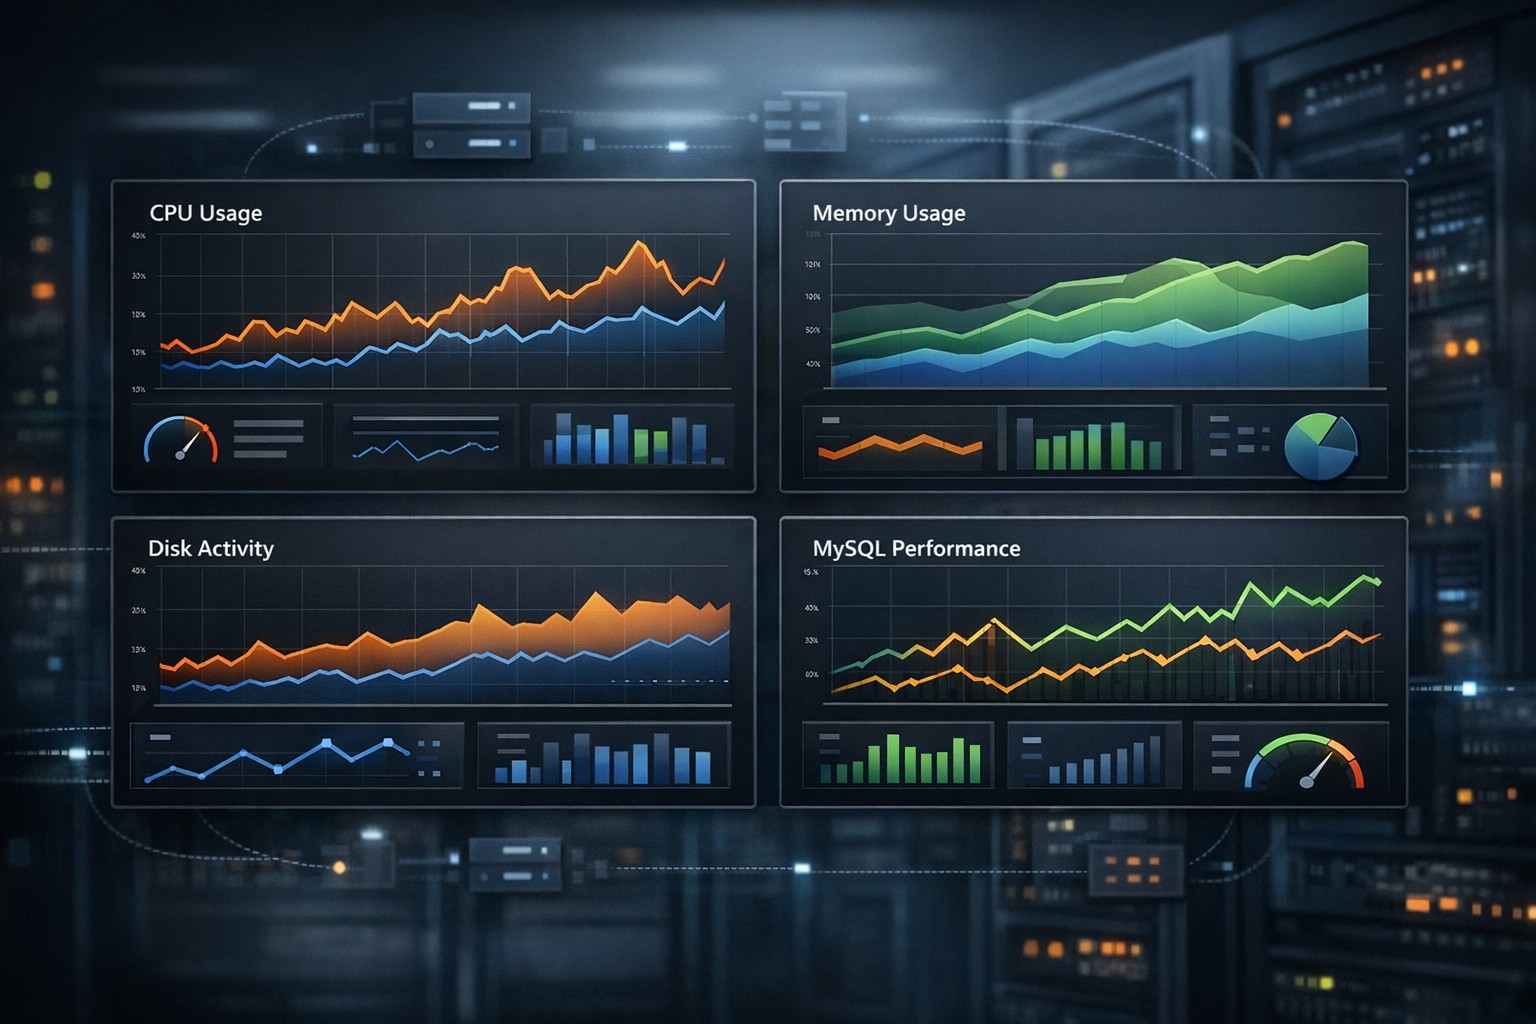
1. CPU Utilization
Track average and peak CPU usage over time. Look for gradual increases or recurring patterns tied to workload changes.
2. Memory Usage
Memory trends can reveal leaks or inefficient applications. A steady upward trend without resets is often a warning sign.
3. Disk Usage
Disk capacity should always be monitored over time. Trend lines help predict when storage will run out, allowing proactive expansion.
4. Load Average
Tracking load over time helps identify sustained pressure on servers, not just temporary spikes.
5. Database Performance
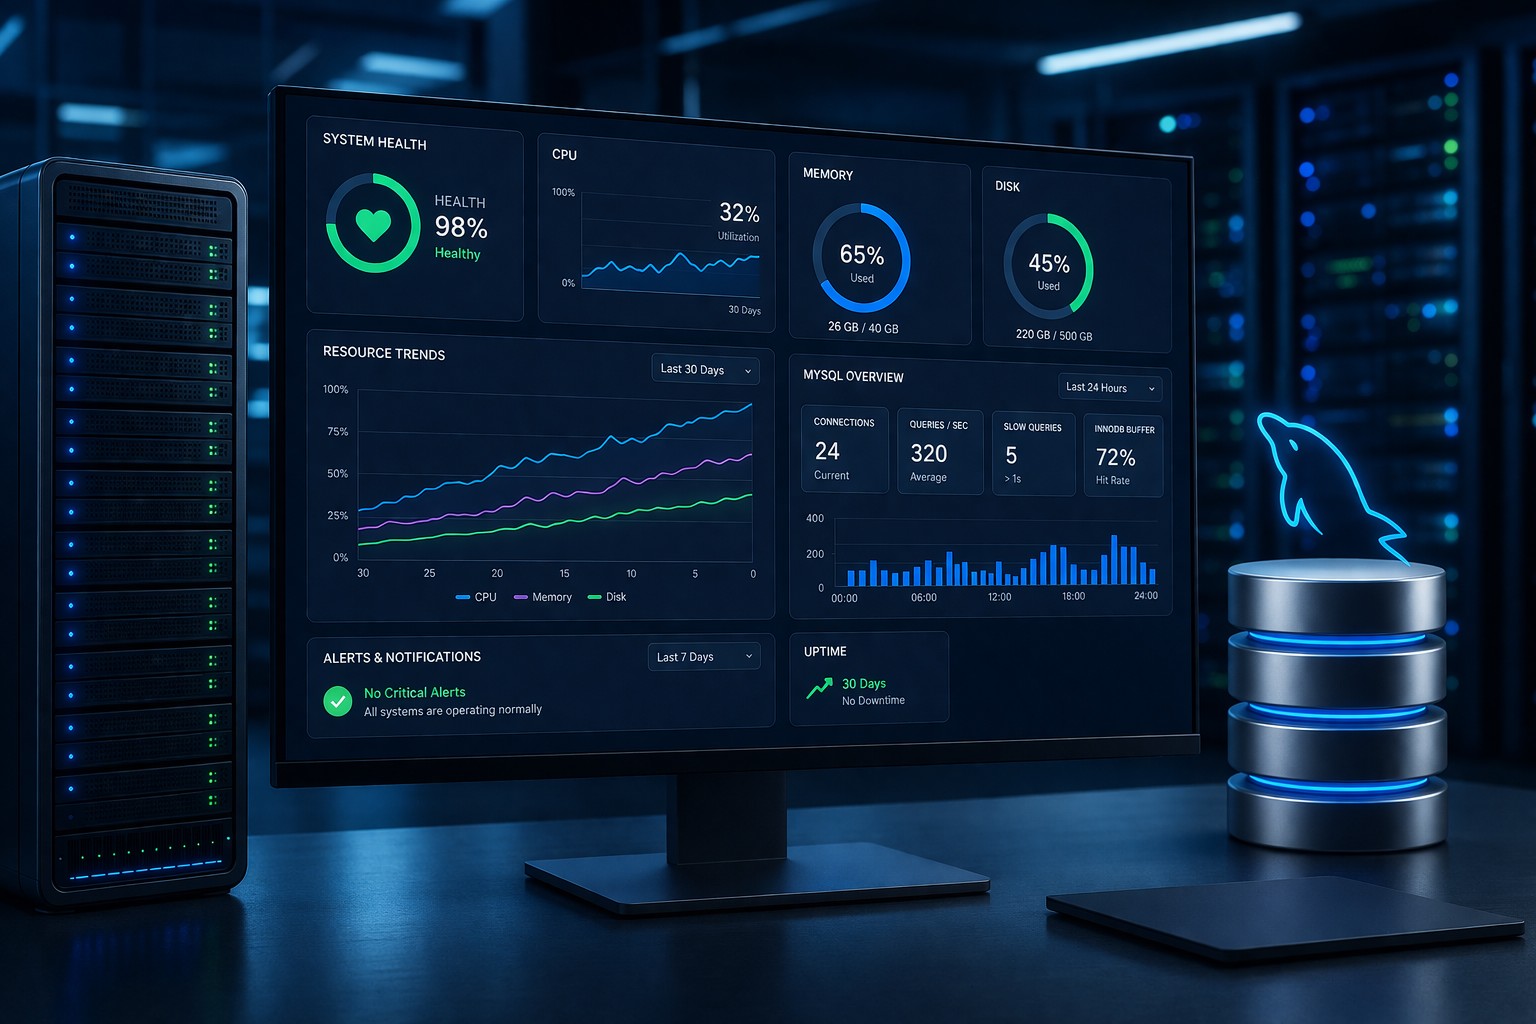
For MySQL environments, monitor slow queries, connection counts, and query execution times. Historical server monitoring helps identify gradual degradation.
How Trend-Based Monitoring Works in Practice
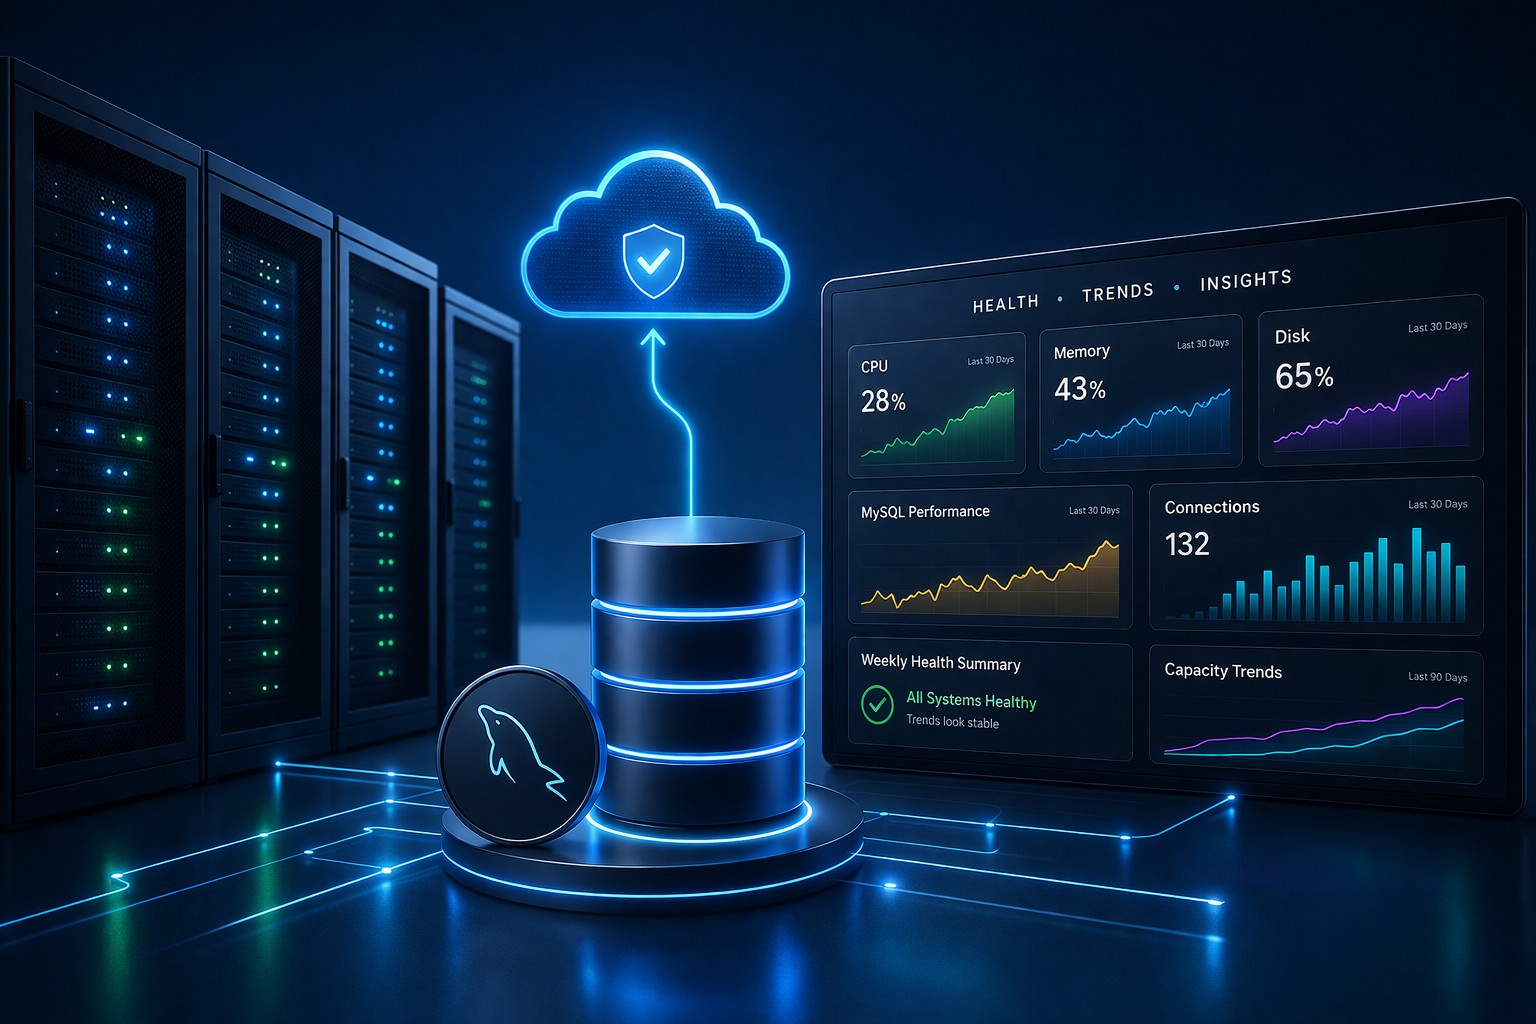
Instead of collecting raw metrics only for alerts, performance trend monitoring aggregates data into meaningful time-based views:
- Daily averages to smooth out noise
- Weekly comparisons to detect growth patterns
- Monthly summaries for capacity planning
This approach shifts monitoring from reactive to predictive. Teams can monitor server trends over time and answer questions like:
- Is CPU usage growing week over week?
- How fast is disk space being consumed?
- Are database queries getting slower gradually?
Real-World Example: Preventing a Disk Outage
Consider a Linux server running a MySQL database for a small application. Disk usage increases by just 1–2% per day due to logs and data growth. No alert is triggered because thresholds are not yet crossed.
Without trend analysis, the team only reacts when disk usage hits 90%—often too late.
With server trend analysis:
- Daily growth is visible in reports
- Weekly trend lines show consistent increase
- Projected capacity exhaustion can be estimated in advance
This allows the team to clean up logs, archive data, or expand storage before the issue becomes critical.
Benefits for Small Infrastructure Teams
For smaller teams, complex observability platforms can be overwhelming. Trend based monitoring server approaches provide a simpler, more practical alternative.
Key benefits include:
- Clear visibility without noise
- Reduced alert fatigue
- Better capacity planning
- Early detection of performance degradation
- More informed operational decisions
Instead of chasing alerts, teams can focus on understanding how systems evolve over time.
Building a Practical Trend Monitoring Approach
You don’t need a heavy observability stack to get started. A lightweight approach can deliver significant value:
- Collect key system metrics daily
- Store historical data for comparison
- Generate simple visual reports
- Review trends weekly instead of constantly watching dashboards
This aligns well with environments where stability and clarity matter more than real-time noise.
Conclusion
Server trend analysis helps teams move beyond reactive monitoring and toward proactive infrastructure management. By focusing on how systems change over time, you can identify risks early, plan capacity effectively, and avoid unnecessary downtime.
If you’re looking for a practical way to monitor server trends over time without adding complexity, explore Infrastructure Health Reporting. It provides clear, trend-focused visibility into your Linux and MySQL environments so you can catch issues before they escalate.