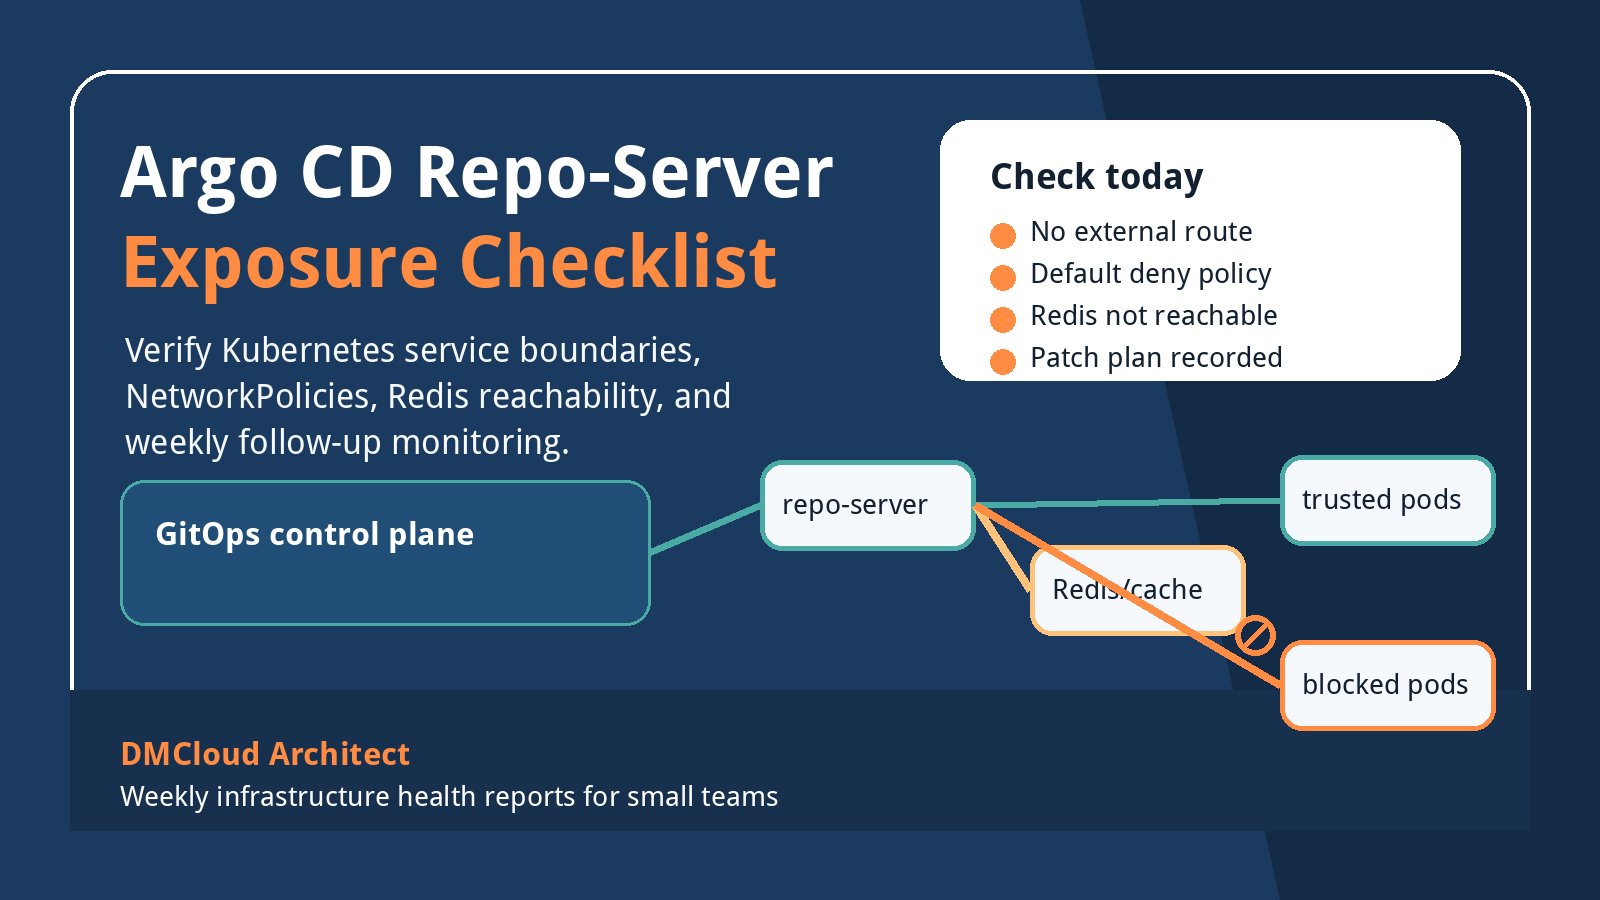
A GitOps control plane can feel safely internal until one service boundary is looser than expected. When a repo-server, cache, or controller endpoint becomes reachable from the wrong network path, a vulnerability can move from “important advisory” to “cluster-wide incident” quickly. Small teams do not need panic; they need a focused way to verify exposure, reduce blast radius, and keep the follow-up visible.
This checklist is written for developers, consultants, and small business owners who run Kubernetes or OpenShift but do not have a full-time security operations team. It uses the same practical mindset as linux server monitoring: check the surfaces that change risk, document exceptions, and turn urgent advisories into repeatable operational habits.
First, confirm what is actually exposed
Start with reachability, not assumptions. A service named “internal” may still be reachable from untrusted pods, peered networks, VPNs, build runners, or shared administrative hosts. The first question is simple: who can connect to the repo-server and its backing cache?
- List the Kubernetes Services, Routes, Ingresses, LoadBalancers, and NodePorts associated with GitOps components.
- Confirm that repo-server endpoints are not exposed outside trusted control-plane components.
- Check whether Redis or any GitOps cache service is reachable from ordinary application namespaces.
- Review cloud firewall, security group, and network ACL rules for the worker nodes hosting these pods.
- Test access from an untrusted namespace rather than only reading manifests.
If an untrusted workload can reach both the repo-server path and the cache path, treat the environment as higher risk until segmentation is corrected.
Map the trust boundary around GitOps components
GitOps tools are powerful because they reconcile desired state into real infrastructure. That same power means their internal service graph deserves a clear trust boundary. Do not monitor the repo-server as an isolated pod; monitor the whole path from source repositories to generated manifests to cluster apply permissions.
- Identify the namespace where GitOps components run and who can deploy into it.
- Review service accounts, RBAC roles, cluster roles, and token mounts used by controllers.
- Check which components can read credentials, repository secrets, signing keys, and deployment manifests.
- Document which namespaces are allowed to talk to repo-server, Redis, API-server-facing controllers, and web UI components.
- Remove broad “allow all from namespace” rules unless they are truly required.
A concise trust map helps the team see whether a single compromised workload could become a deployment pipeline compromise.
Verify NetworkPolicies are present and enforced
NetworkPolicy objects only help when the cluster network plugin enforces them and the rules match the intended traffic. Many teams have policy YAML in Git but no reliable validation that the policy blocks the attack path they care about.
- Confirm the CNI plugin supports and enforces ingress and egress NetworkPolicies.
- Set a default deny policy for the GitOps namespace before allowing specific component-to-component traffic.
- Allow repo-server traffic only from the controller, API server sidecars, or documented trusted components.
- Allow Redis/cache traffic only from the components that require it.
- Run a temporary test pod in an unrelated namespace and verify that connections fail.
- Keep policy validation in the same change process as GitOps upgrades.
The goal is not to create a complicated mesh of rules. The goal is to prevent unrelated workloads from reaching high-impact internal services.
Check patch status without relying on version labels alone
When an advisory mentions affected packages, operators often check a version string and move on. That is a start, but it is not enough for small teams that may run vendor images, downstream bundles, pinned Helm charts, or older OpenShift GitOps operators.
- Record the installed GitOps operator, application controller, repo-server, Redis, and image updater versions.
- Compare running image digests against the vendor advisory and release notes.
- Check whether your vendor says the installed minor version is affected or protected by default policy.
- Review pending operator upgrades and blocked cluster upgrades.
- If a fixed build is not available yet, document the compensating controls and owner.
Version checks should end with an action: upgrade, confirm not affected, or keep a dated exception with specific mitigation.
Reduce blast radius if a component is reached
Segmentation lowers the chance of exploitation. Least privilege lowers the damage if something is still reached. For GitOps systems, that means reviewing which projects, clusters, namespaces, and resource kinds the tool can modify.
- Separate production and non-production GitOps projects where possible.
- Avoid cluster-admin permissions for application-level deployers.
- Limit destination namespaces and clusters for each project.
- Restrict high-risk resource kinds that ordinary application repos should not create.
- Require review for changes to GitOps project configuration, repository credentials, and sync policies.
- Watch for new privileged workloads, hostPath mounts, cluster roles, and admission webhook changes.
A repo-server issue becomes much less frightening when the deployment identity cannot rewrite the entire cluster.
Look for signs of suspicious deployment activity
After the immediate exposure check, review recent activity. You are looking for unexpected syncs, modified desired state, new resources with elevated permissions, and changes that do not match normal deployment patterns.
- Review GitOps sync history for unusual timing, failed syncs, or manual overrides.
- Compare recently applied Kubernetes resources with recent repository commits.
- Check Kubernetes audit logs for service account activity outside the normal pattern.
- Inspect new ClusterRoleBindings, Secrets, webhook configurations, privileged pods, and CronJobs.
- Review repo-server, controller, and Redis logs for errors, unexpected clients, or connection spikes.
If logs are short-lived, capture what you can before restarting pods or rotating components. Evidence disappears quickly in small clusters with default retention.
Turn the advisory into an ongoing monitoring item
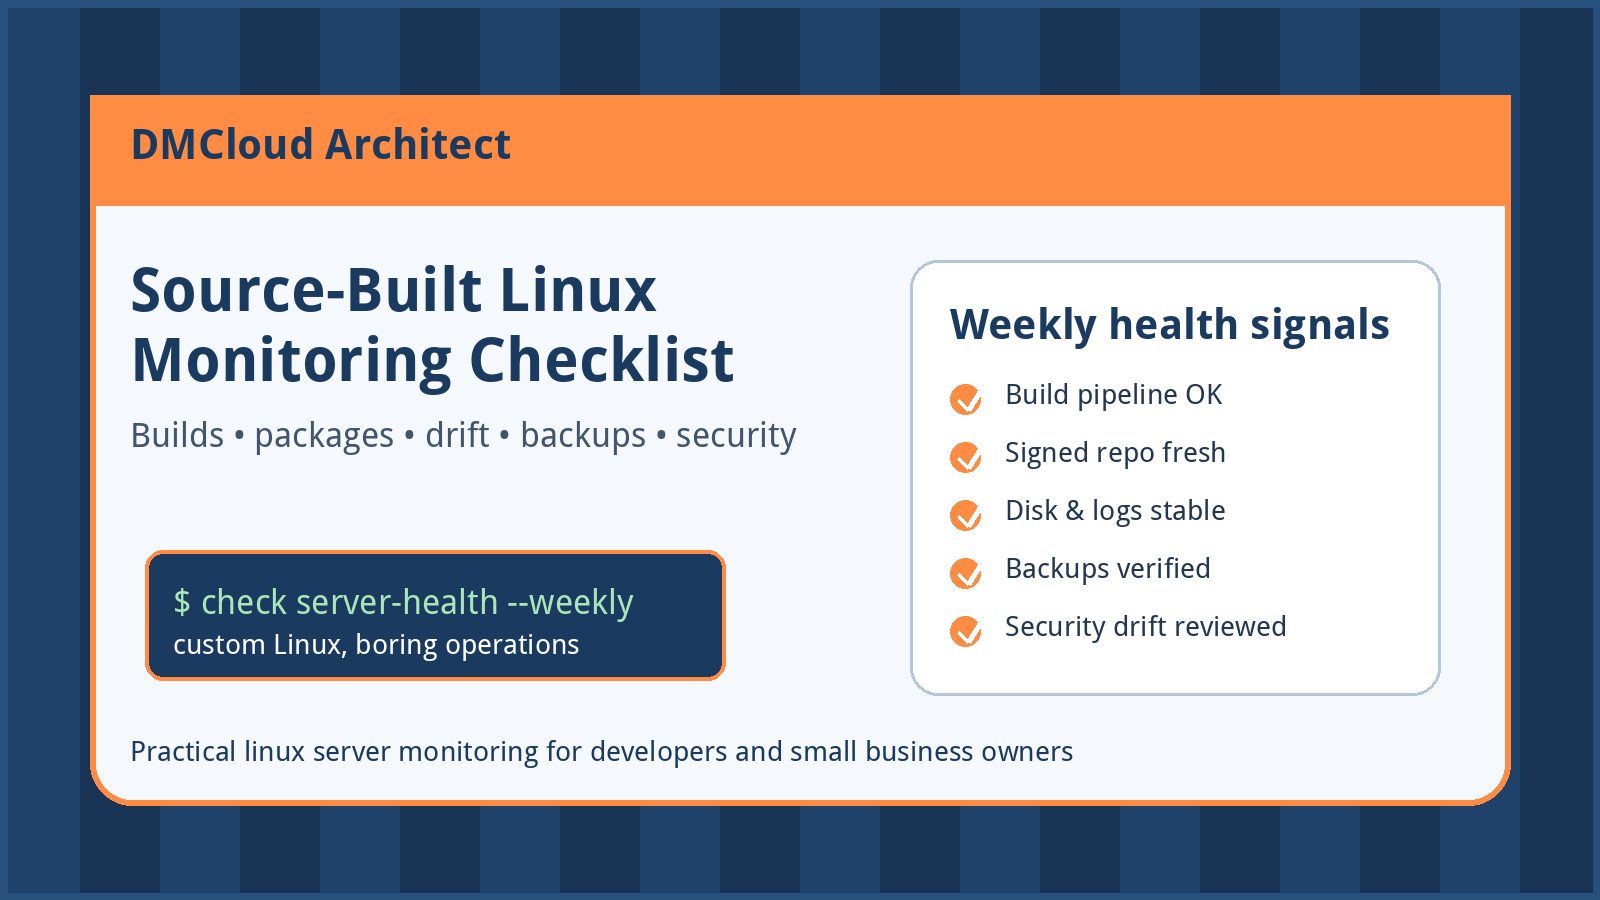
Emergency checks are useful, but they fade after the advisory leaves the feed. This is where a lightweight weekly report can work better than another dashboard. The report should highlight the few control-plane signals that matter to the business.
- GitOps component versions and whether upgrades are pending.
- NetworkPolicy enforcement status and any failed reachability tests.
- Unexpected open services, routes, NodePorts, or cloud firewall changes.
- New high-privilege Kubernetes resources created during the week.
- Control-plane pod restarts, sync failures, and unusual log spikes.
- Owner, due date, and status for each unresolved security exception.
This kind of linux server monitoring is less about collecting everything and more about making sure important changes do not get buried in chat, tickets, or release noise.
Small-team response checklist
- Confirm the GitOps repo-server is not exposed through Ingress, Route, LoadBalancer, NodePort, VPN, or broad internal network access.
- Confirm Redis/cache endpoints are reachable only from required GitOps components.
- Validate NetworkPolicies with a real test pod from an untrusted namespace.
- Check installed versions and image digests against vendor guidance.
- Apply fixed packages or upgrades when available.
- Document compensating controls if a fix is delayed.
- Review RBAC, project destinations, privileged resource permissions, and repository credentials.
- Inspect recent sync history, audit logs, and newly created high-risk resources.
- Add the exposure check to your weekly infrastructure health review.
Bottom line
A serious repo-server advisory is a good reason to tighten Kubernetes service boundaries, but it should not become a one-time scramble. The durable fix is a pattern: verify internal exposure, enforce NetworkPolicies, keep GitOps components patched, limit deployment privileges, and review the same signals every week. That rhythm gives small teams a practical way to spot control-plane risk before it turns into a business outage.
Want weekly infrastructure health checks without dashboard fatigue?
DMCloud Architect sends Linux and MySQL infrastructure health reports directly to your inbox, so you can spot risks early without adding another monitoring dashboard to watch.
Get the free starter plan for weekly infrastructure health reports.