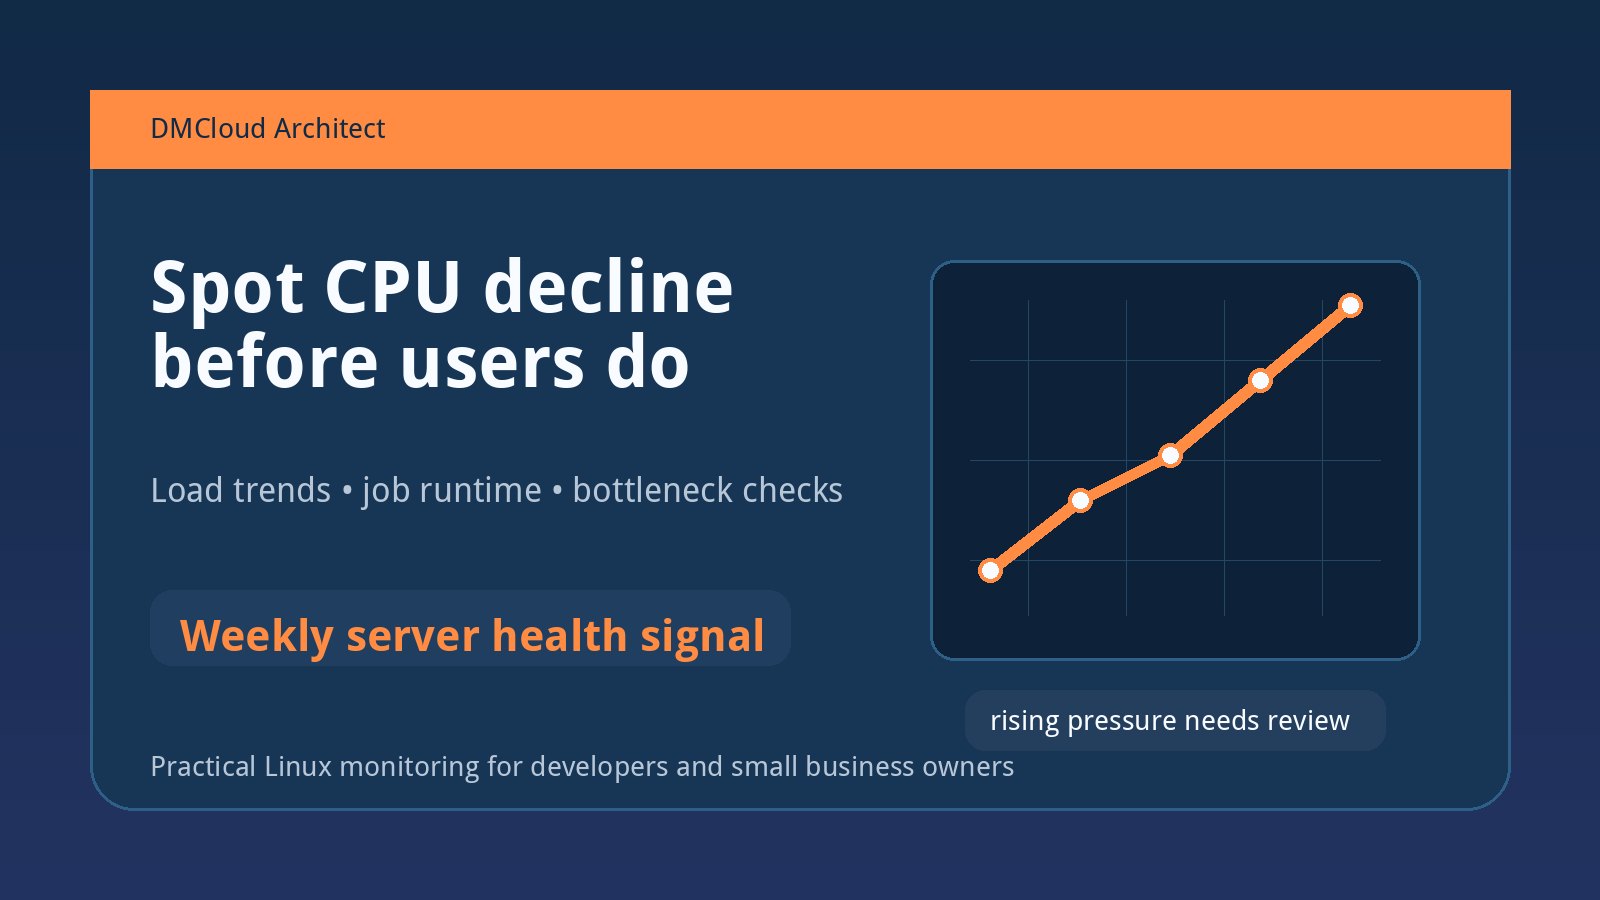
A CPU performance decline server problem usually does not begin with a dramatic crash. More often, the server still answers requests, but everything feels a little heavier. Pages render slowly, deployments take longer, scheduled jobs overlap, and the team starts treating “it was just busy” as a normal explanation.
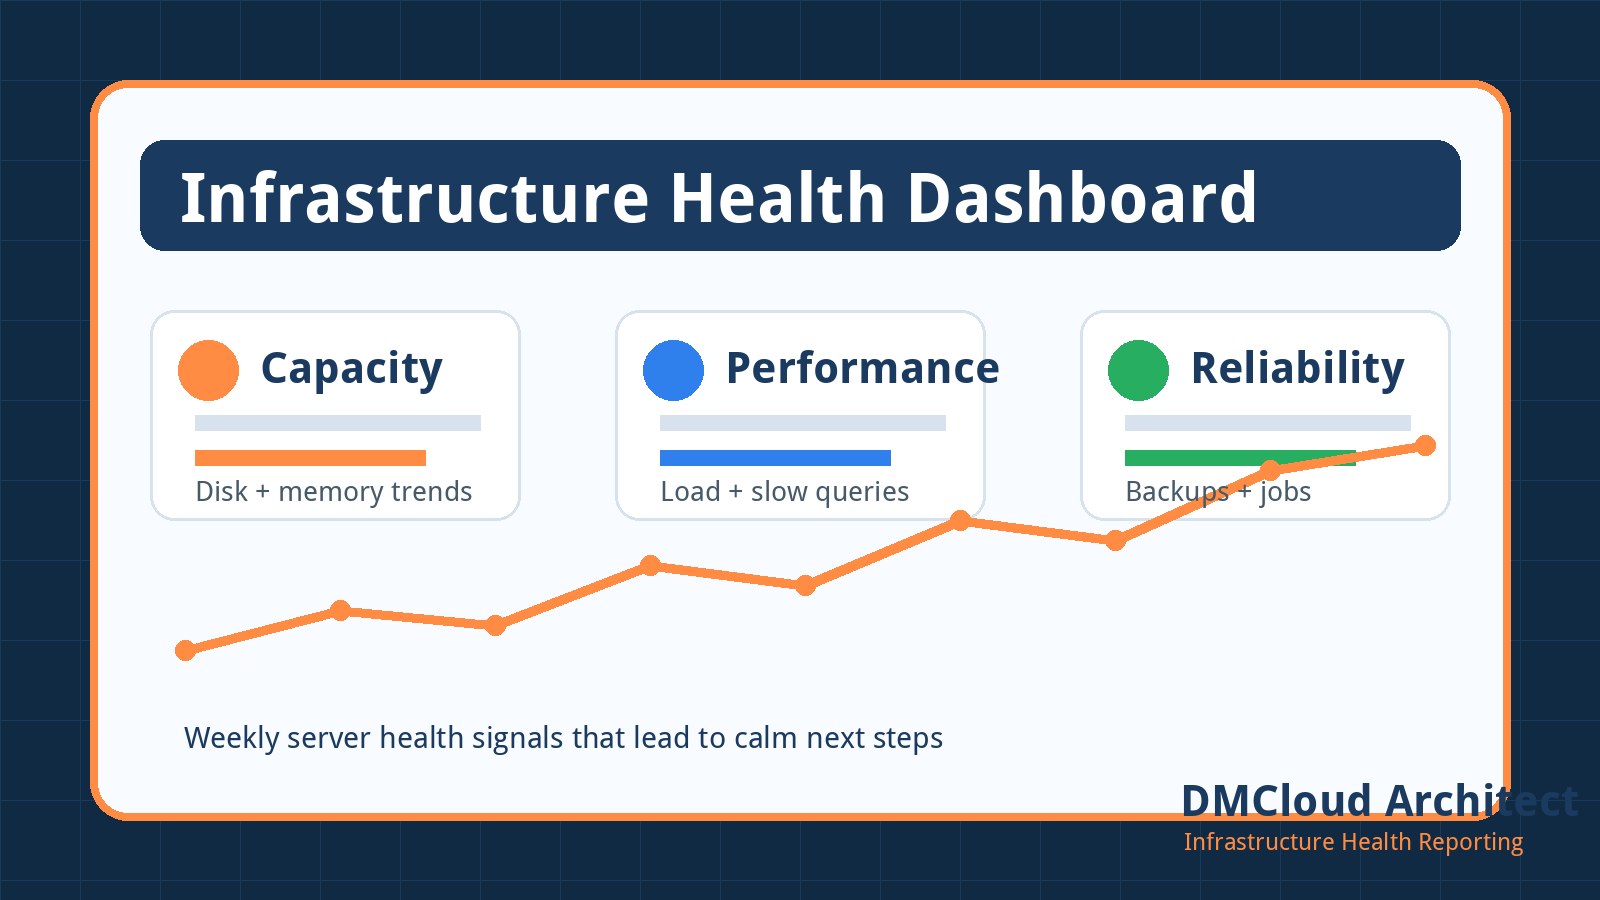
That quiet phase is where small teams can prevent the most pain. If you only react when CPU is pinned at 100%, you may miss days or weeks of warning signs. A practical weekly health review can show whether CPU demand is drifting upward, whether normal jobs are taking longer, and whether the server is moving toward saturation before customers notice a serious slowdown.
Why CPU decline is harder to spot than CPU failure
A failed server is obvious. A declining server is subtle. It may pass simple uptime checks, keep SSH available, and still process traffic while giving users a slower experience. Developers often see the symptoms indirectly: a queue that drains later than usual, a database query that is not technically broken but now takes twice as long, or a background worker that runs into business hours.
That is why CPU performance degradation on Linux should be tracked as a trend rather than a single number. CPU usage at 75% may be fine during a known batch job. CPU usage at 45% can still be a warning if load average, run queue pressure, I/O wait, and application latency are all increasing together. The goal is not to panic over every spike. The goal is to notice when the server’s baseline is changing.
Start with load average, but do not stop there
Load average is a useful first signal because it shows how much work is waiting or running over time. On Linux, the one-, five-, and fifteen-minute load averages help you see whether pressure is brief or sustained. A short jump during a deployment may be normal. A fifteen-minute load average that keeps rising week over week deserves review.
Compare load average with CPU core count. A load of 4 on a four-core server can mean the machine is busy but still roughly matched to capacity. A load of 8 on the same server suggests work is queuing. But load average can include tasks waiting on disk, network, or other resources, so it should be paired with additional signals before you call it a CPU bottleneck.
Separate CPU saturation from other bottlenecks
One common mistake is blaming the CPU any time the server feels slow. A Linux host can show high load because processes are waiting for disk, backups are competing with the database, or logging is blocked on storage. If you only look at CPU percentage, you may upgrade the wrong part of the system.
To identify a CPU bottleneck on Linux, review a small group of signals together:
- User and system CPU: shows whether application work or kernel activity is consuming processor time.
- I/O wait: helps reveal when disk or storage latency is making processes wait.
- Run queue length: indicates whether runnable processes are waiting for CPU time.
- Steal time: matters on virtual machines because the hypervisor may be taking CPU capacity away.
- Application latency: confirms whether infrastructure pressure is affecting user-facing behavior.
If user CPU and run queue pressure rise together while I/O wait stays low, CPU saturation is more likely. If I/O wait rises with load average, the CPU may simply be waiting on storage. If steal time appears on a cloud VM, the issue may be noisy neighbors, an undersized shape, or host-level contention.
Watch for week-over-week baseline changes
Small teams rarely need a giant wallboard to detect CPU issues early. A weekly trend report is often enough. The most useful question is simple: what changed compared with last week? If the same workload now requires more CPU, takes longer to complete, or produces more queue backlog, something deserves attention.
Useful weekly CPU trend checks include:
- Average and peak load during normal business hours.
- Highest fifteen-minute load average for the week.
- CPU usage during backups, imports, billing runs, or scheduled reports.
- Top processes by cumulative CPU time.
- Slowest endpoints, workers, or database jobs during high-load periods.
This style is especially helpful when growth is gradual. A server may not cross a traditional alert threshold, but a steady rise from “calm” to “usually busy” can still predict trouble. Trend-based reporting gives you time to tune code, resize the instance, move a job, or improve caching before the server becomes a daily interruption.
Look for scheduled jobs that now overlap
One of the clearest signs of CPU performance decline is a scheduled job that used to finish cleanly but now runs into the next job window. Backups, imports, image processing, report generation, and nightly cleanup tasks are common examples. The job may not fail, but it stretches long enough to compete with production traffic.
When this happens, check both runtime and timing. Did the data set grow? Did a query plan change? Did a new feature add more work to the same cron window? Did the server shape or cloud environment change? CPU saturation warning signs often appear first in these background tasks because they have predictable schedules and repeatable work.
Connect CPU trends to releases and traffic
A CPU graph becomes much more useful when it is tied to context. If CPU increased after a new feature release, the first investigation may be code paths, queries, or caching. If CPU rose during a marketing campaign, the server may simply need more capacity or a better traffic plan. If CPU changed with no obvious traffic increase, look for background jobs, runaway processes, bot traffic, or environment changes.
For developers, a lightweight release note in the weekly infrastructure report can make root cause analysis much faster. You do not need a complex incident platform. Even a short note such as “new reporting export deployed Tuesday” can explain why CPU and database load changed later in the week.
Use simple command-line checks during investigation
When a report shows possible CPU performance degradation, start with practical commands. Tools such as uptime, top, htop, mpstat, pidstat, and vmstat can quickly show whether the host is CPU-bound, waiting on I/O, or affected by a specific process. The exact toolkit matters less than using the same checks consistently.
During a live slowdown, capture the current picture before restarting services. Which processes are using CPU? Is load rising or falling? Is swap active? Is I/O wait high? Are web workers, database processes, or background jobs competing? These details help avoid the common cycle of rebooting, losing evidence, and seeing the same slowdown return a few days later.
Turn warning signs into a review checklist
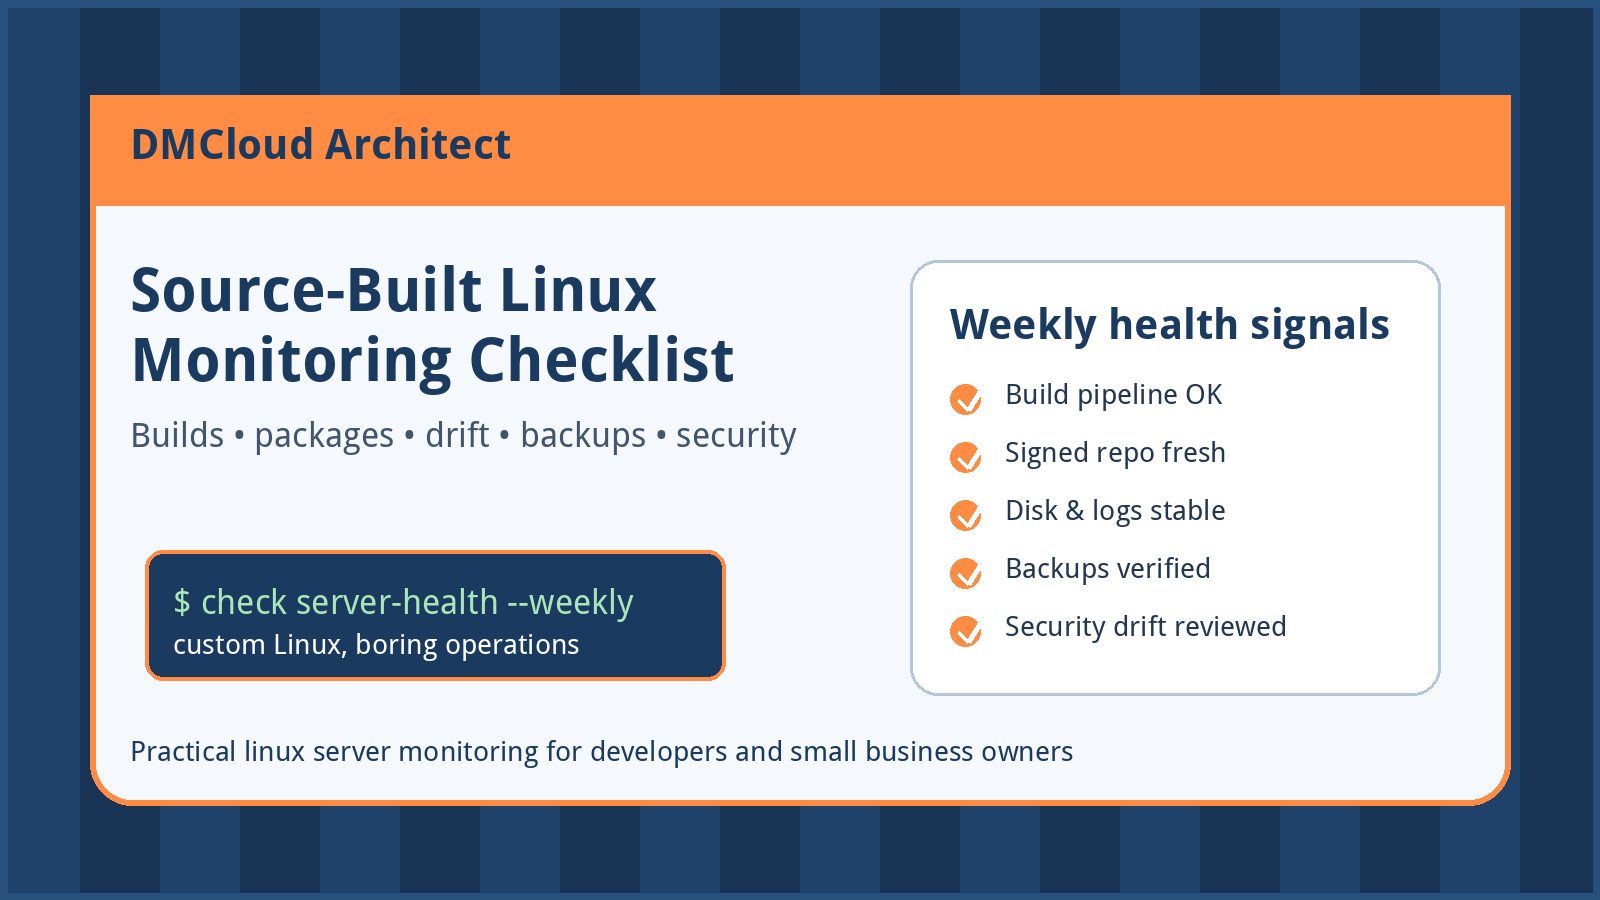
A good CPU review does not need to be complicated. For a small production server, start with a weekly checklist that asks:
- Did average or peak load increase meaningfully this week?
- Did any recurring job take longer than normal?
- Did user-facing response times increase during high CPU periods?
- Are top CPU processes expected, or is one process unusually dominant?
- Is the pressure actually CPU, or are disk, memory, network, or VM steal time involved?
- Is the next action code tuning, job scheduling, capacity planning, or deeper investigation?
This checklist turns monitoring into action. Instead of collecting metrics for their own sake, the team gets a short list of decisions. That is the difference between a noisy dashboard and useful infrastructure health reporting.
When to act on CPU performance decline
Not every warning sign requires an emergency. Act quickly when CPU pressure is sustained, user-facing latency is rising, scheduled jobs are overlapping, or the server has little headroom before an expected traffic increase. Plan a calmer improvement when the trend is gradual but consistent.
The best response may be code optimization, query tuning, cache improvements, moving heavy jobs away from peak hours, adding workers, resizing the server, or splitting services. The important part is to decide based on evidence. CPU performance decline is easiest to fix when you catch it early and still have options.
Final takeaway
A CPU performance decline on a server is a warning pattern, not just a percentage on a graph. Watch load average, run queue pressure, I/O wait, steal time, job duration, and application latency together. Then compare those signals week over week so you can tell the difference between a normal busy moment and real CPU performance degradation.
Want weekly infrastructure health checks without dashboard fatigue?
DMCloud Architect sends Linux and MySQL infrastructure health reports directly to your inbox, so you can spot risks early without adding another monitoring dashboard to watch.
Get the free starter plan for weekly infrastructure health reports.