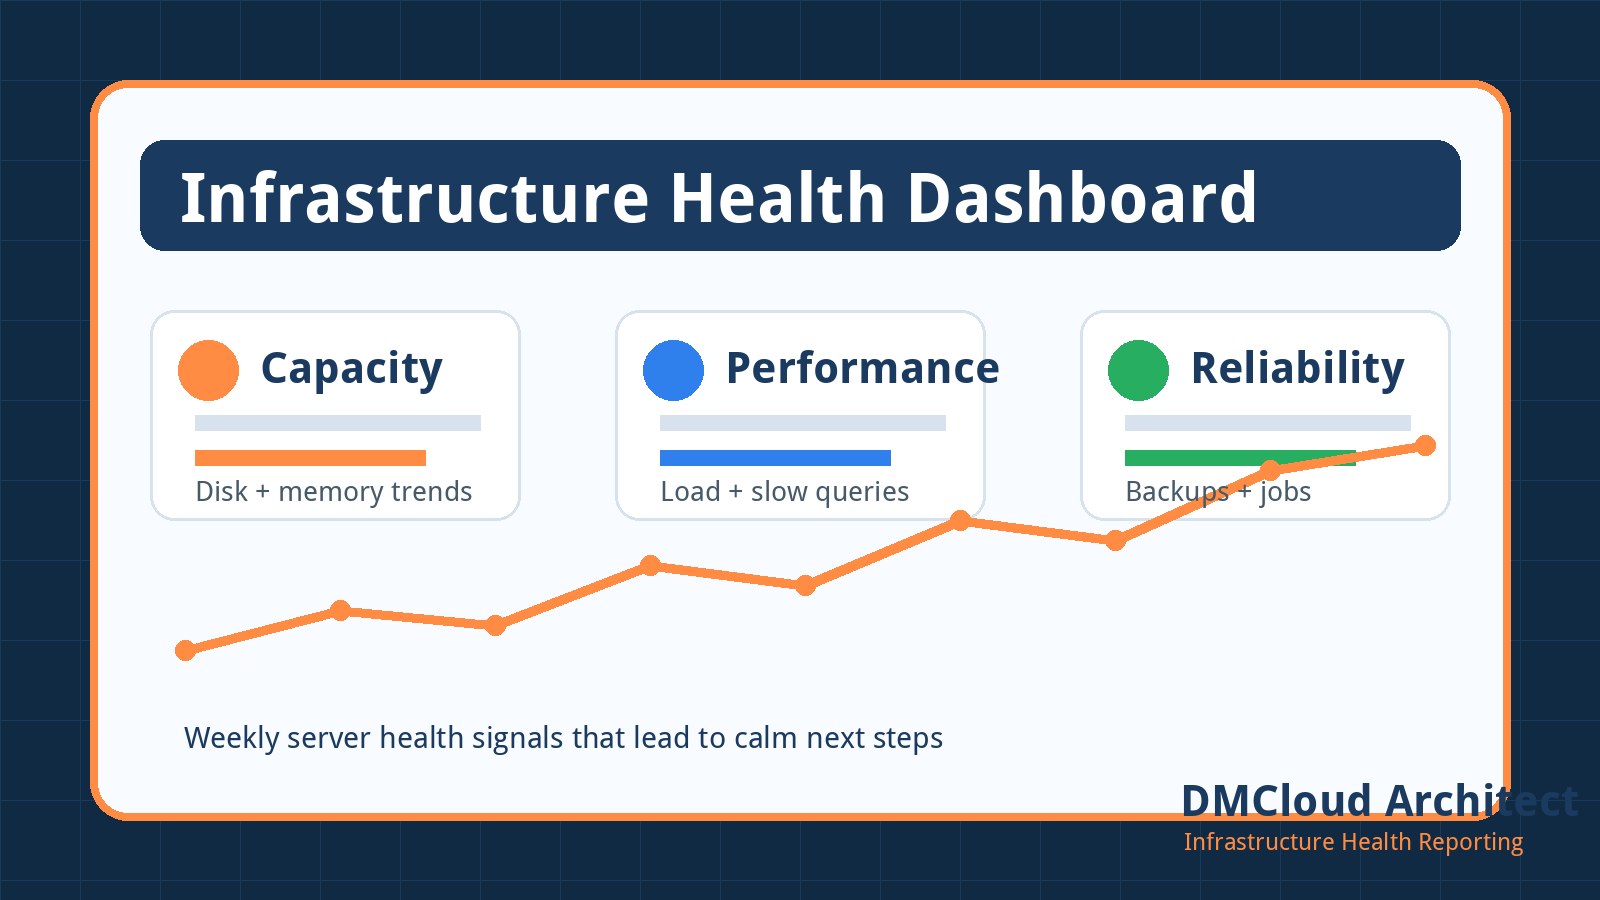
An infrastructure health dashboard should make server risk easier to understand, not create another screen that someone has to stare at all day. For small teams, developers, and business owners, the best dashboard is often a short weekly view that shows what changed, what is getting worse, and what needs attention before it turns into downtime.
The key is to focus on signals that explain operational health in plain language. CPU, disk, memory, backups, database growth, and error trends all matter, but they only become useful when they are connected to decisions. A practical infrastructure health dashboard should answer three questions: are we stable right now, are we trending toward a problem, and what should we check next?
Start with the decisions your dashboard should support
Before choosing charts, define the decisions you want the dashboard or report to help with. A developer maintaining a small production app may need to know whether a server can survive the next traffic spike. A business owner may need to know whether the site is healthy enough for a campaign launch. A consultant may need a simple way to show clients that routine maintenance is happening.
Those decisions lead to a cleaner dashboard. Instead of collecting every possible metric, group the view around practical outcomes: capacity risk, performance risk, reliability risk, security hygiene, and backup confidence. This keeps the dashboard readable and reduces the chance that important warnings get buried under decorative charts.
Track capacity before it becomes an emergency
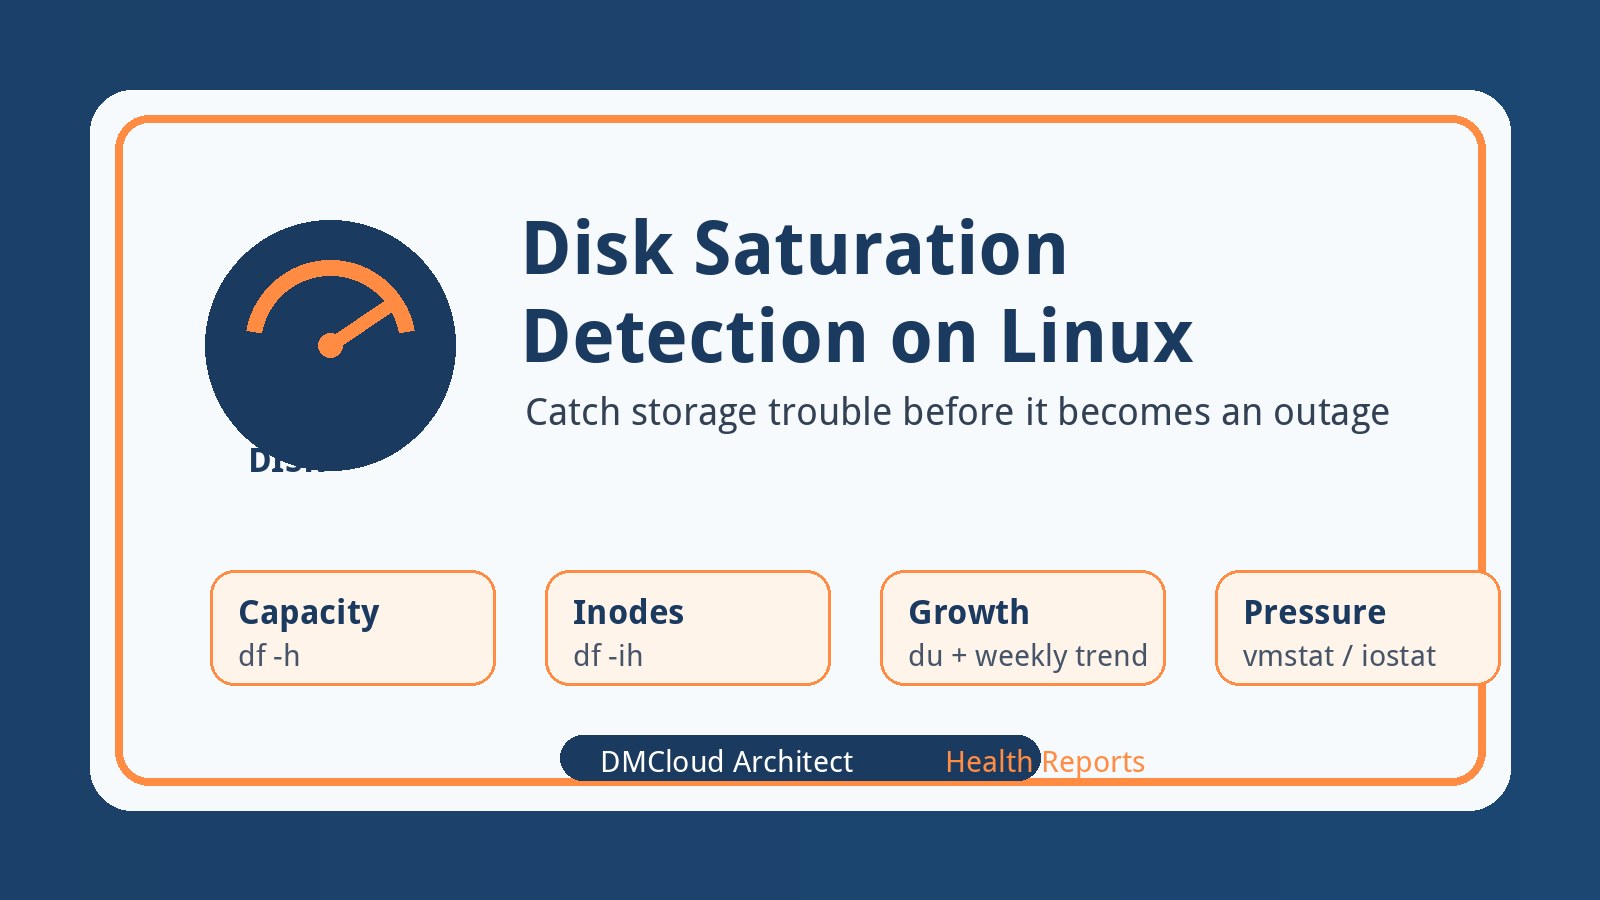
Capacity is the first layer of server health reporting because it catches some of the most common preventable outages. A useful infrastructure health dashboard should include disk usage, inode usage, memory pressure, swap activity, database storage growth, and basic CPU load trends.
Disk usage is especially important because storage problems can break logging, uploads, database writes, deployments, and scheduled jobs. Do not only show today’s percent used. Show the direction. A filesystem that moved from 52% to 78% in one week deserves attention even if it has not crossed a traditional critical threshold yet.
For Linux servers, weekly capacity checks can include:
- Filesystem usage: current percent used and week-over-week change for important mounts.
- Inode usage: a separate check for small-file exhaustion.
- Memory and swap: whether the server is frequently paging under normal load.
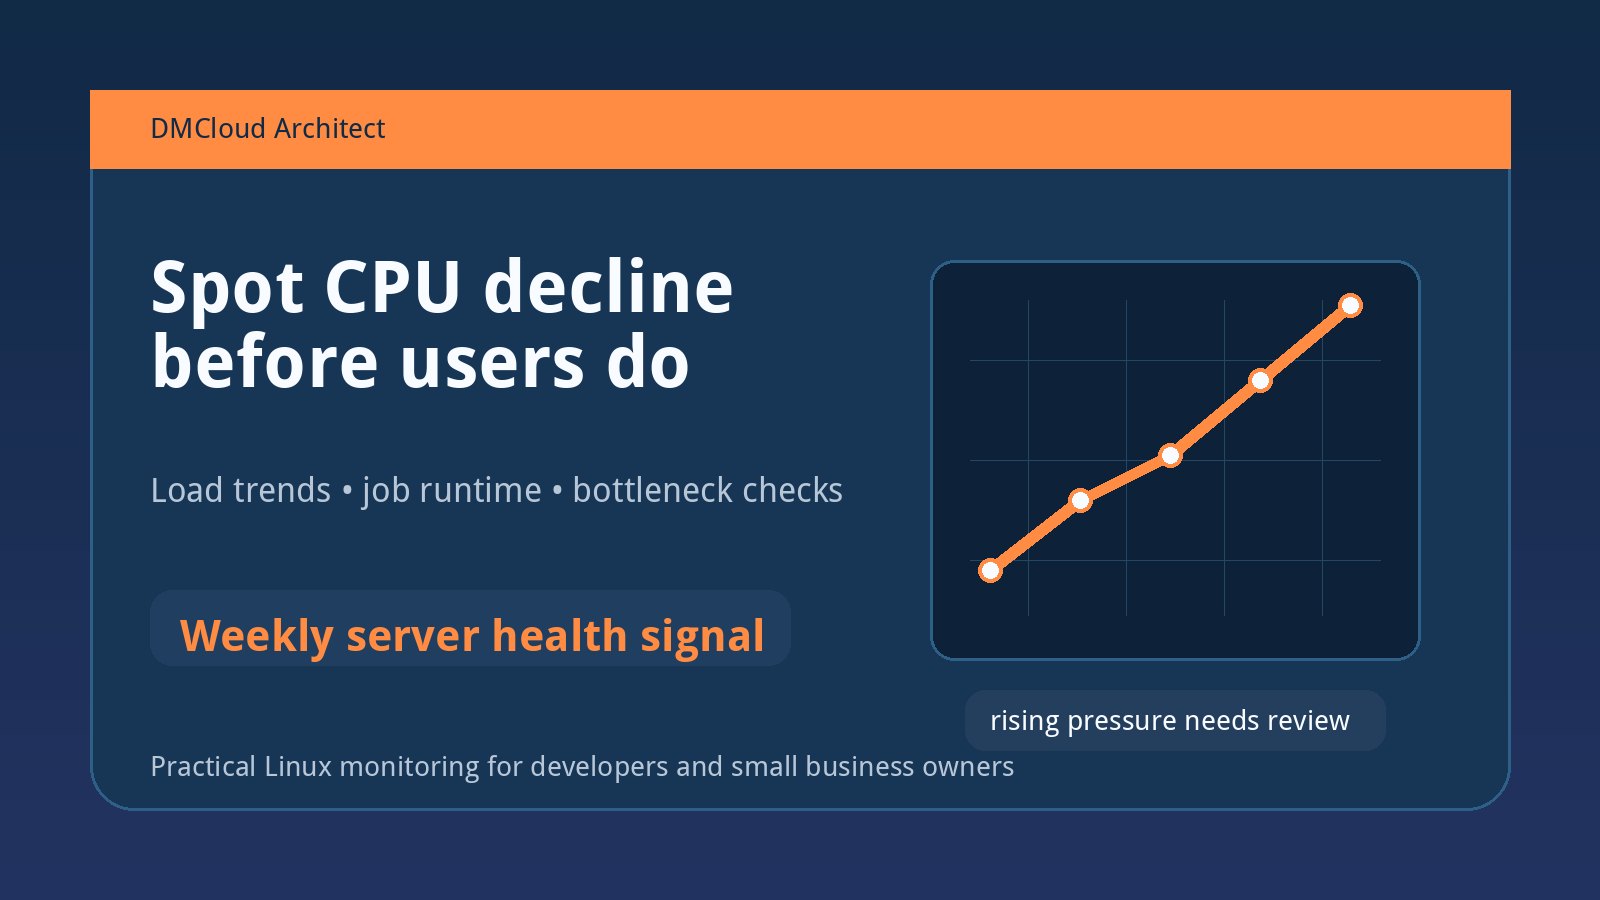
- CPU load: whether sustained load is climbing compared with recent weeks.
- Database size: table, index, and binary log growth for MySQL or similar systems.
The dashboard should highlight trend changes, not just red-line values. Small teams rarely have time to tune thresholds every week, but they can act on a clear “this server is filling faster than usual” warning.
Include performance signals that users can feel
Performance metrics are useful when they connect to user experience. CPU percentage alone may not tell the full story. A server can show moderate CPU while users feel slowness because storage is waiting, database queries are backing up, or a background job is competing for resources.
A practical infrastructure monitoring report should include a short performance section with signals such as load average, I/O wait, database slow query count, web response trends, and queue backlog where relevant. The goal is not to recreate an enterprise observability suite. The goal is to spot whether normal operations are becoming heavier over time.
For example, if load average and slow query counts are both rising week over week, the next action may be to review database indexes or recent feature changes. If CPU is calm but I/O wait is elevated, the next action may be to inspect backups, disk throughput limits, or database write volume. A good dashboard does not just say “high”; it points toward the first reasonable investigation.
Make reliability visible with backups and scheduled jobs
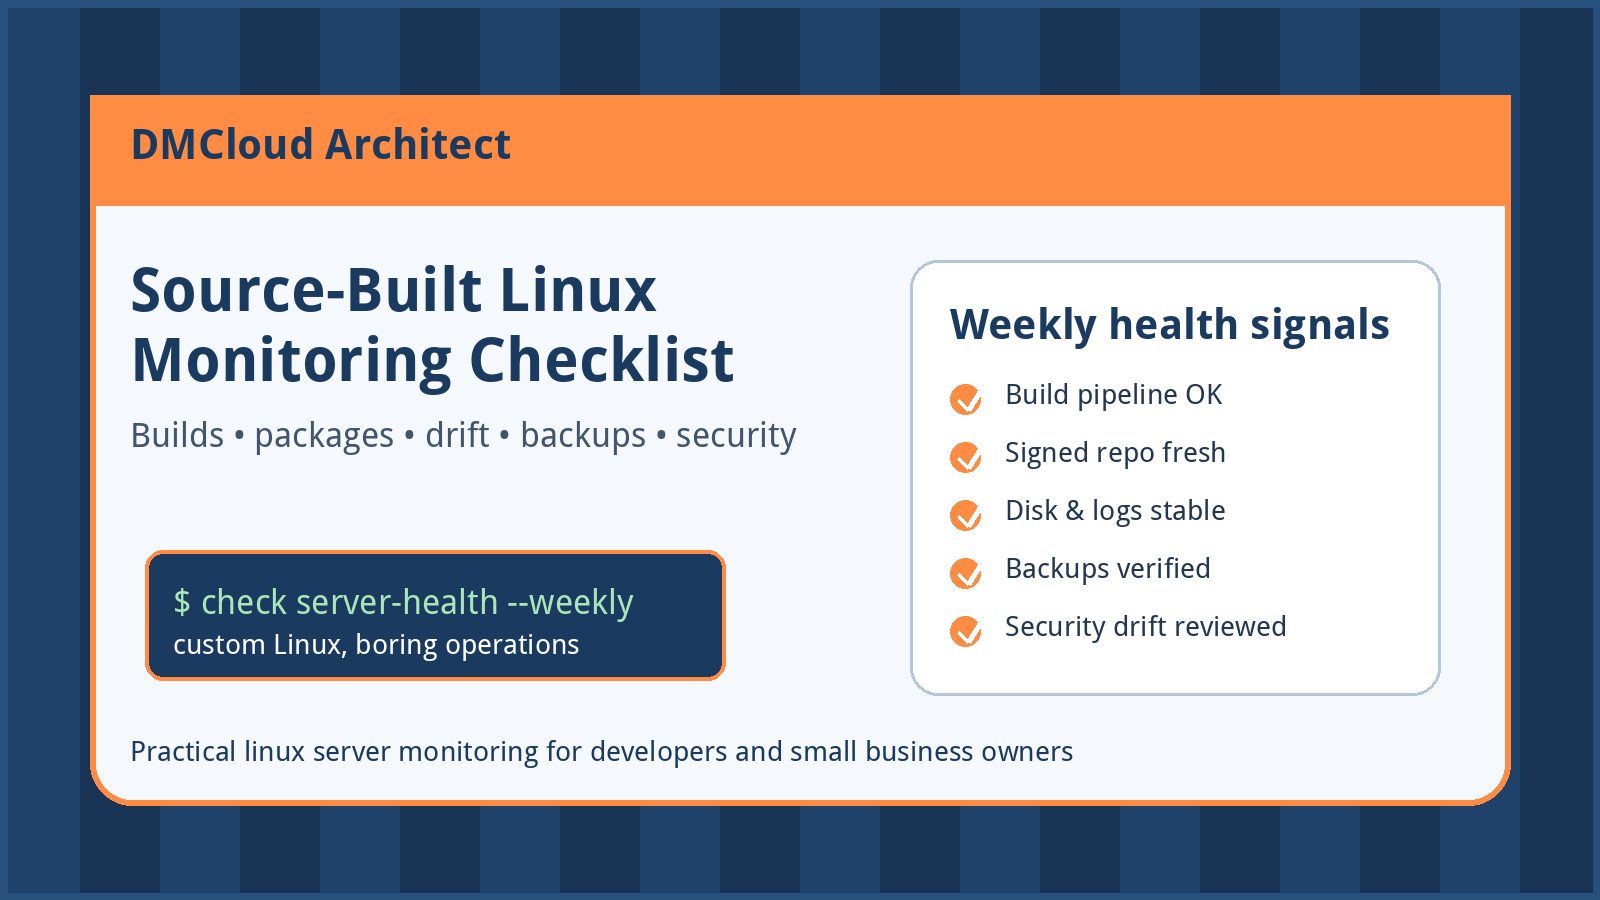
Many infrastructure dashboards over-focus on live resource metrics and under-focus on the boring checks that decide whether recovery will work. Backups, cron jobs, certificate renewals, and log rotation are not glamorous, but they are part of system health.
Your dashboard or weekly report should answer these reliability questions:
- Did the latest backup complete successfully?
- Has a restore test been performed recently enough to trust the backup?
- Are scheduled jobs completing, or are they silently failing?
- Are TLS certificates, domains, and critical credentials approaching expiration?
- Are log files rotating, or are they growing without bounds?
For small business infrastructure, a missed backup or failed scheduled job can be more damaging than a brief CPU spike. That is why infrastructure health reporting should include operational checks alongside metrics.
Use trend summaries instead of noisy wallboards
A dashboard becomes hard to use when every metric wants attention at the same priority. Weekly server health reporting works better when it summarizes changes. A simple “what changed since last week” section can be more actionable than a dozen live graphs.
Useful trend summaries include:
- Top three resources with the largest increase in usage.
- Any server crossing a warning threshold for the first time.
- Recurring errors that increased compared with the previous period.
- Slow queries or endpoints that appear repeatedly.
- Backups, jobs, or health checks that failed since the last report.
This style is especially helpful for teams that do not have a dedicated operations person. Instead of expecting someone to inspect dashboards daily, the report creates a routine review moment. That habit is often what prevents small issues from becoming expensive incidents.
Keep the dashboard friendly for non-specialists
Infrastructure health is not only for sysadmins. A small company owner may not care about every Linux metric, but they do care whether the website is stable, whether customer data is protected, and whether an upcoming promotion could overload the current setup.
Use plain labels where possible. “Disk usage up 18% this week” is easier to act on than a raw filesystem table. “Backup failed twice” is clearer than a buried exit code. “Database slow queries increased” is more useful than a graph with no explanation. Technical detail should still be available, but the first layer should communicate business impact and next steps.
Choose thresholds that encourage calm action
Thresholds should create useful attention, not constant noise. A common pattern is to use warning levels for review and critical levels for urgent action. For example, disk usage above 80% may be a weekly review item, while usage above 90% or fast growth over a short period may need immediate work.
The right thresholds depend on the workload. A log-heavy server, a database host, and a static website do not grow the same way. That is why trend-based health reporting is so valuable. It lets you adjust based on real behavior instead of guessing once and forgetting the settings.
A simple weekly infrastructure health dashboard layout
If you are building your first infrastructure health dashboard, start with five sections:
- Executive summary: green/yellow/red status, key risks, and recommended next actions.
- Capacity: disk, memory, CPU load, database growth, and inode usage trends.
- Performance: response time, slow queries, I/O wait, and queue or job backlog.
- Reliability: backups, scheduled jobs, certificates, service uptime, and log rotation.
- Security hygiene: pending updates, exposed services, failed login spikes, and unusual access patterns.
This structure keeps the view balanced. It avoids the common mistake of treating infrastructure health as only CPU and RAM while ignoring the operational checks that actually reduce risk.
Turn dashboard review into a repeatable habit
The best dashboard is the one your team actually uses. Pick a weekly review time, keep the report short, and assign ownership for follow-up actions. If a trend needs investigation, create a ticket or maintenance task immediately. If a warning is expected, document why so it does not create confusion next week.
Over time, this habit creates a useful operational history. You can see when server load changed after a release, when disk growth accelerated after a new feature, or when database size started increasing faster than revenue. That context helps you plan upgrades and maintenance before pressure turns into panic.
Final takeaway
An infrastructure health dashboard does not need to be complicated to be valuable. For small teams, the winning approach is a focused weekly view that combines capacity, performance, reliability, and trend summaries with clear next steps. That turns server monitoring from a noisy chore into a practical business safeguard.
Want weekly infrastructure health checks without dashboard fatigue?
DMCloud Architect sends Linux and MySQL infrastructure health reports directly to your inbox, so you can spot risks early without adding another monitoring dashboard to watch.
Get the free starter plan for weekly infrastructure health reports.