Hiring backend, DevOps, or AI infrastructure help can be a smart move, especially when production systems are growing faster than the team supporting them. But before you commit budget to a monthly engagement, a one-time hardening project, or a custom dashboard build, it helps to know whether the real problem is missing engineering capacity or missing operational visibility.
A practical linux server monitoring checklist gives you that baseline. It turns vague concerns like “the app feels slow” or “we should probably harden this box” into evidence: trends, thresholds, ownership, and next actions. That makes conversations with consultants, contractors, and internal engineers much clearer.
1. Start with the outcome you need
Small teams often ask for “DevOps help” when they are actually dealing with one of three very different needs:
- Reliability visibility: you need to know whether servers are healthy before customers notice a problem.
- Implementation capacity: you need someone to build APIs, automation, deployment pipelines, or infrastructure changes.
- Security and maintenance discipline: you need patching, TLS review, access cleanup, backups, and documented recovery steps.
Those needs overlap, but they should not be priced or managed the same way. Monitoring and weekly health reports are usually the lowest-friction starting point because they show where hands-on engineering work will create the most value.
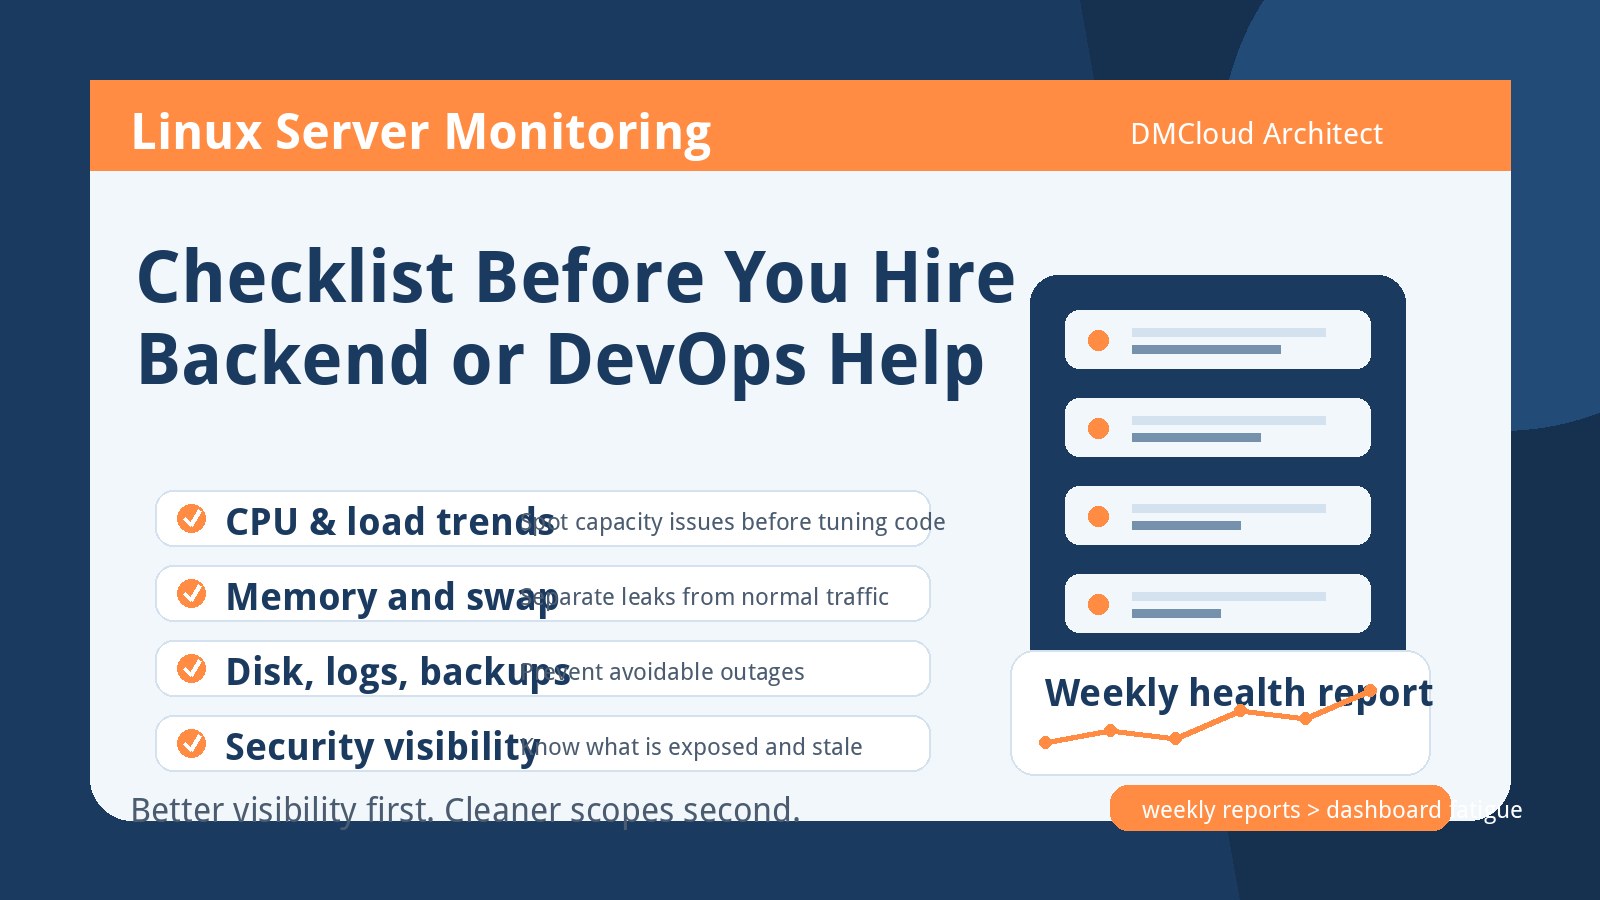
2. Check CPU and load trends before assuming the app is slow
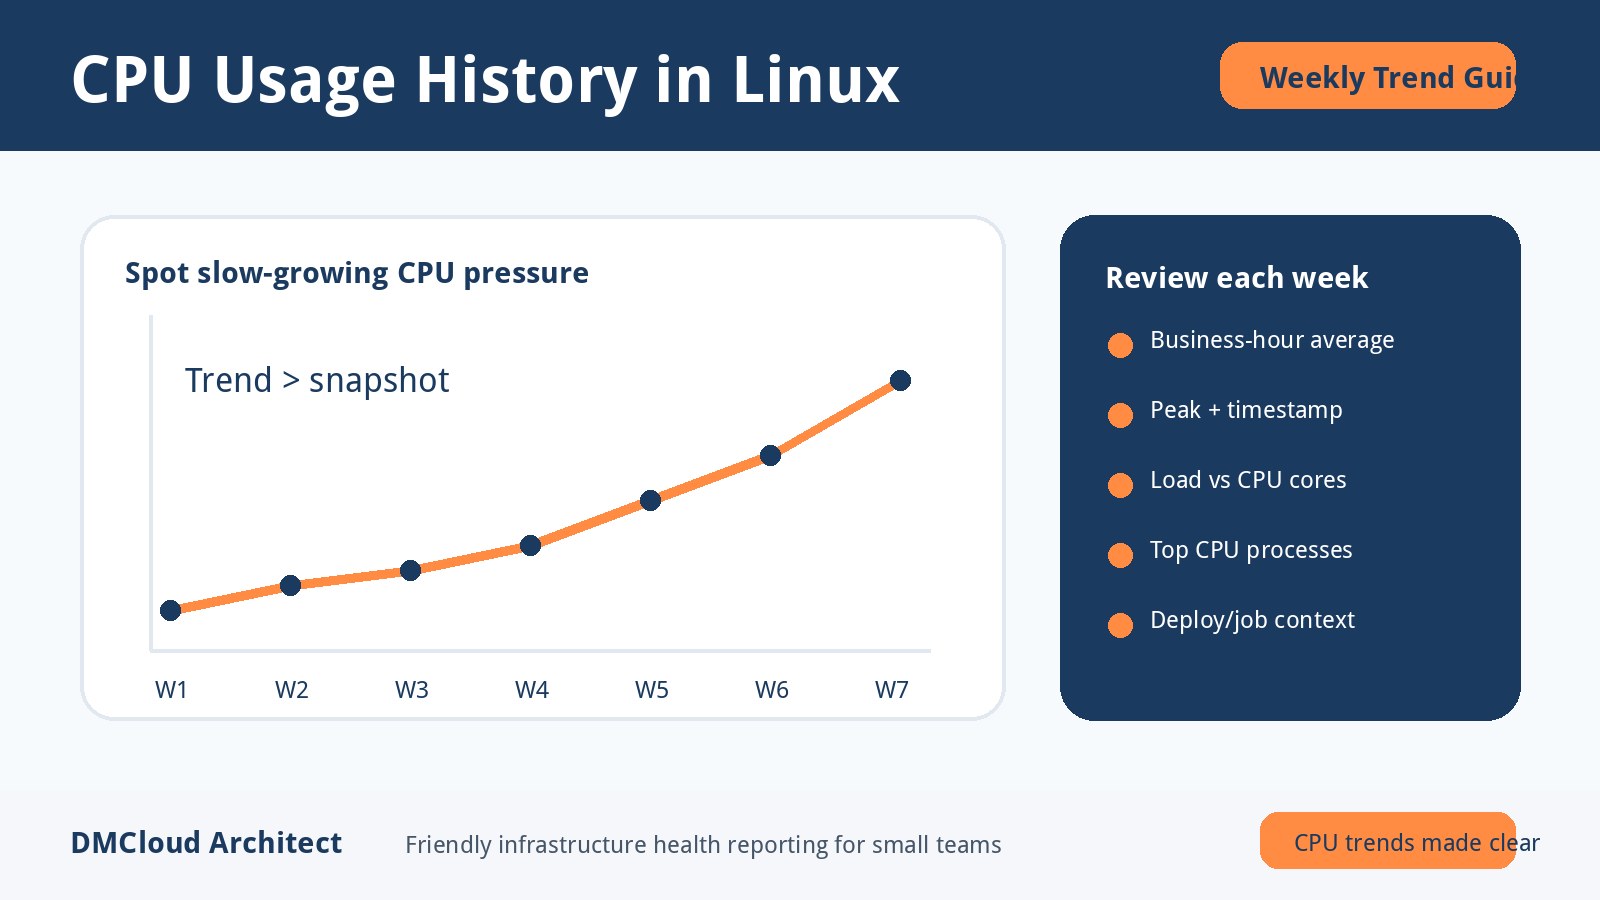
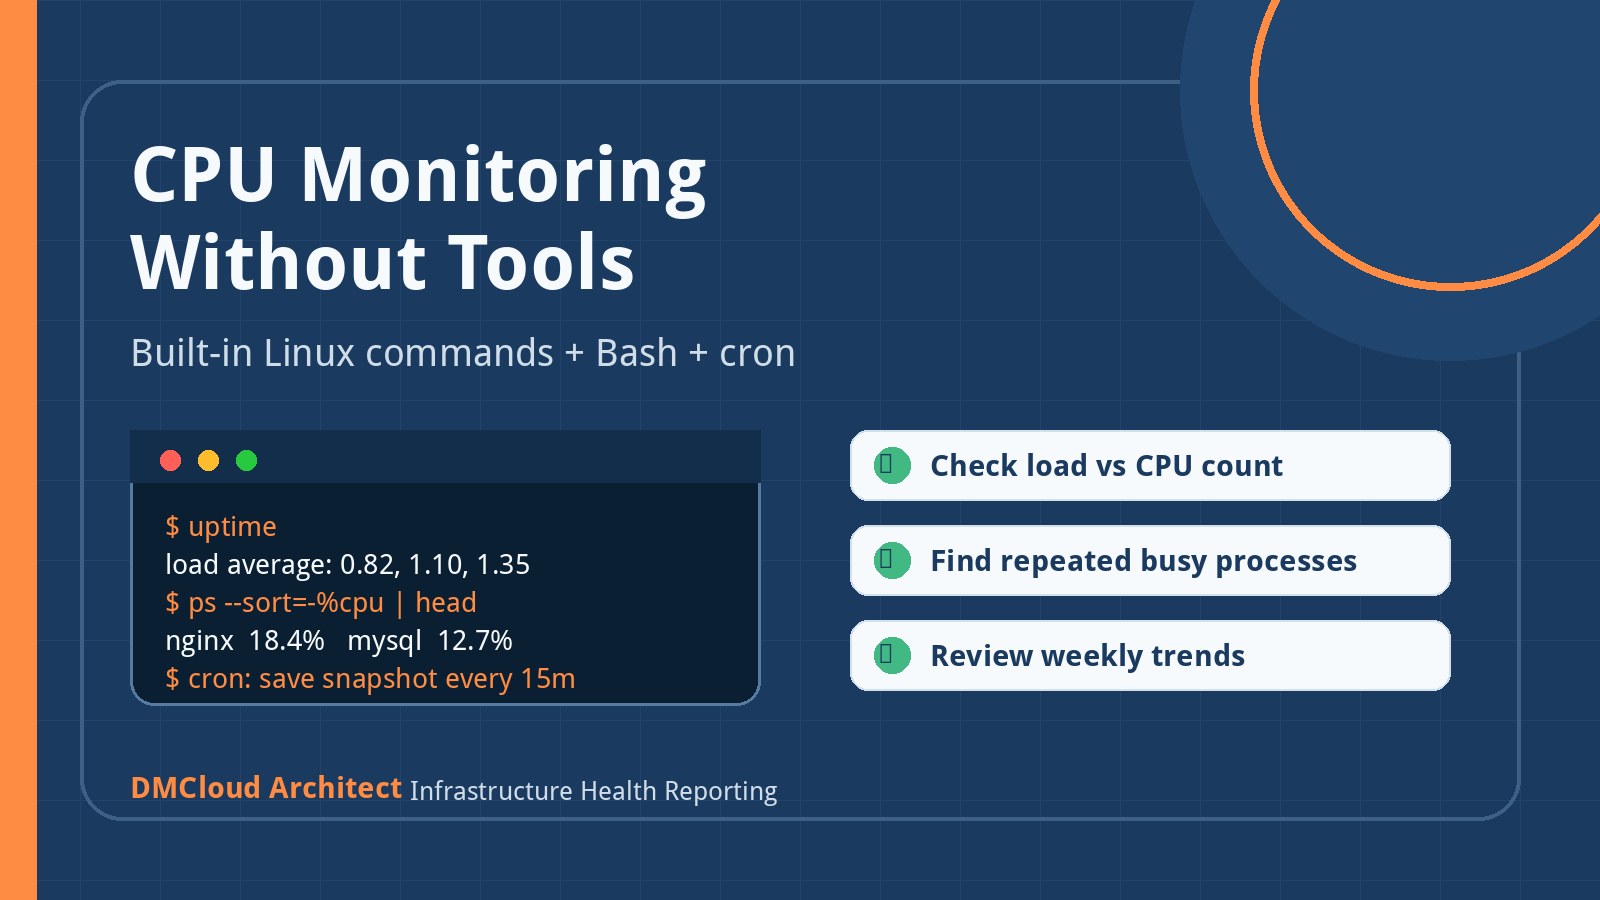
For each Linux server, review CPU utilization, load average, process spikes, and recurring busy periods over at least a few weeks. A single high-load moment may be normal during backups or batch jobs. A repeated climb every weekday afternoon is a capacity or scheduling signal.
Useful questions include:
- Is load consistently high compared with the number of CPU cores?
- Do the same processes appear during every spike?
- Are cron jobs, reports, backups, or AI workloads competing with user traffic?
- Has CPU usage changed since the last deployment or traffic increase?
If you can answer these questions from a weekly report, you may not need a new dashboard immediately. If you cannot answer them at all, visibility should come before optimization.
3. Review memory pressure and swap behavior
Memory problems often look like random slowness because the system remains online while response times quietly degrade. Look beyond free memory and check sustained memory pressure, swap usage, out-of-memory events, and whether application workers grow over time.
Bring a DevOps or backend engineer in when you see a repeatable pattern, such as a service leaking memory after each deploy or a queue worker consuming more RAM as jobs accumulate. Bring in monitoring first when nobody can say whether the pressure is new, recurring, or tied to normal traffic.
4. Treat disk space and inode usage as customer-impact risks
Disk monitoring is one of the simplest places to prevent avoidable outages. Check filesystem usage, inode consumption, log growth, backup directories, database storage, and temporary files. A server can have plenty of CPU and memory but still fail hard when logs or uploads fill the wrong partition.
Your checklist should identify:
- Which filesystems are above your warning threshold.
- Which directories are growing fastest.
- Whether log rotation is working.
- Whether backups are stored on the same disk they are meant to protect.
- How many days of growth remain at the current rate.
This is a good example of where weekly reporting can be more useful than a dashboard. Owners do not need to stare at disk graphs every day; they need a clear warning while there is still time to clean up, archive, resize, or move data safely.
5. Verify logs and alerts are actionable, not just noisy
Many small businesses have alerts that fire too often, too late, or to the wrong person. Before paying for new tooling, review the current signal quality. Which alerts led to action in the last month? Which were ignored? Which incidents had no alert at all?
A healthy monitoring setup has a short list of high-value checks: service availability, certificate expiration, disk growth, backup freshness, database errors, authentication failures, and resource trends. If alerts are noisy, a consultant can help tune them. If nobody is reviewing the basic signals, a weekly infrastructure report may be the more sustainable first step.
6. Separate security hardening from security visibility
Linux administration and server hardening are important, but they work best when backed by a current inventory. Before asking for broad hardening work, collect the basics: exposed ports, SSH access patterns, TLS certificate status, patch cadence, sudo users, firewall rules, and whether public services still match business needs.
Then classify the work:
- Immediate fixes: expired certificates, unnecessary public ports, missing backups, or stale admin access.
- Scheduled improvements: patch routines, configuration cleanup, least-privilege access, and documentation.
- Ongoing visibility: weekly checks that confirm the environment is not drifting back into risk.
This approach keeps the scope practical. You avoid turning every concern into a large project while still giving important risks a clear owner.
7. Decide when a dashboard is worth building
Dashboards are useful when someone has the time and responsibility to look at them. They are less useful when they become another browser tab that everyone assumes someone else is watching. For small teams, the better question is not “Do we need a dashboard?” but “What decision will this dashboard help us make?”
A dashboard is usually worth it when you have live operations, frequent releases, or multiple people responding to incidents. A weekly report is often better when you need executive-friendly visibility, recurring maintenance prompts, or a simple way to brief a part-time consultant before they touch production.
8. Use monitoring evidence to scope outside help
Once your baseline is clear, hiring gets easier. Instead of asking for open-ended DevOps support, you can request specific outcomes: reduce disk growth risk, investigate recurring load spikes, improve backup validation, tighten SSH access, or document a deployment rollback path.
That protects both sides. The business gets a focused scope. The engineer gets enough context to estimate honestly. And the servers get improvements based on measured health rather than guesswork.
A simple weekly review checklist
- Review CPU, load, memory, disk, and inode trends.
- Confirm backups completed and can be restored.
- Check certificate expiration and public service exposure.
- Scan logs for repeated application, database, and authentication errors.
- Compare current resource trends with recent deploys or traffic changes.
- Turn each concern into one of three actions: monitor, schedule, or fix now.
If the checklist produces a clean report, you may only need light ongoing monitoring. If it surfaces recurring risks, you have a strong brief for backend, Linux administration, or DevOps help.
Bottom line
Specialists are valuable, but they are most effective when they start with reliable server health evidence. Before hiring for broad backend, DevOps, or AI infrastructure work, build a clear monitoring baseline and identify the few risks that matter most. For many small teams, a weekly Linux server monitoring report is the practical bridge between “we hope everything is fine” and “we know exactly what to fix next.”
Want weekly infrastructure health checks without dashboard fatigue?
DMCloud Architect sends Linux and MySQL infrastructure health reports directly to your inbox, so you can spot risks early without adding another monitoring dashboard to watch.
Get the free starter plan for weekly infrastructure health reports.