CPU monitoring without tools sounds a little old-school, but it is still a helpful skill for developers and small business owners who manage a few Linux servers. Maybe you are troubleshooting a slow web app, checking a database box after a busy week, or trying to understand whether a cloud instance is quietly outgrowing its current size. You do not always need to install a full monitoring stack before you can learn something useful.
The goal is not to replace proper observability forever. The goal is to get enough signal, quickly and safely, using commands that are already available on most Linux systems. With a few snapshots and a simple weekly review habit, you can spot CPU pressure early and make better decisions about tuning, scheduling, or scaling.
Start with the question you are trying to answer
Before collecting CPU numbers, decide what decision the numbers should support. A one-time troubleshooting session is different from a lightweight trend report. For a small production server, useful questions include:
- Is the server CPU-bound right now, or is the slowdown coming from disk, memory, network, or database locks?
- Does CPU usage spike only during backups, reports, deployments, or batch jobs?
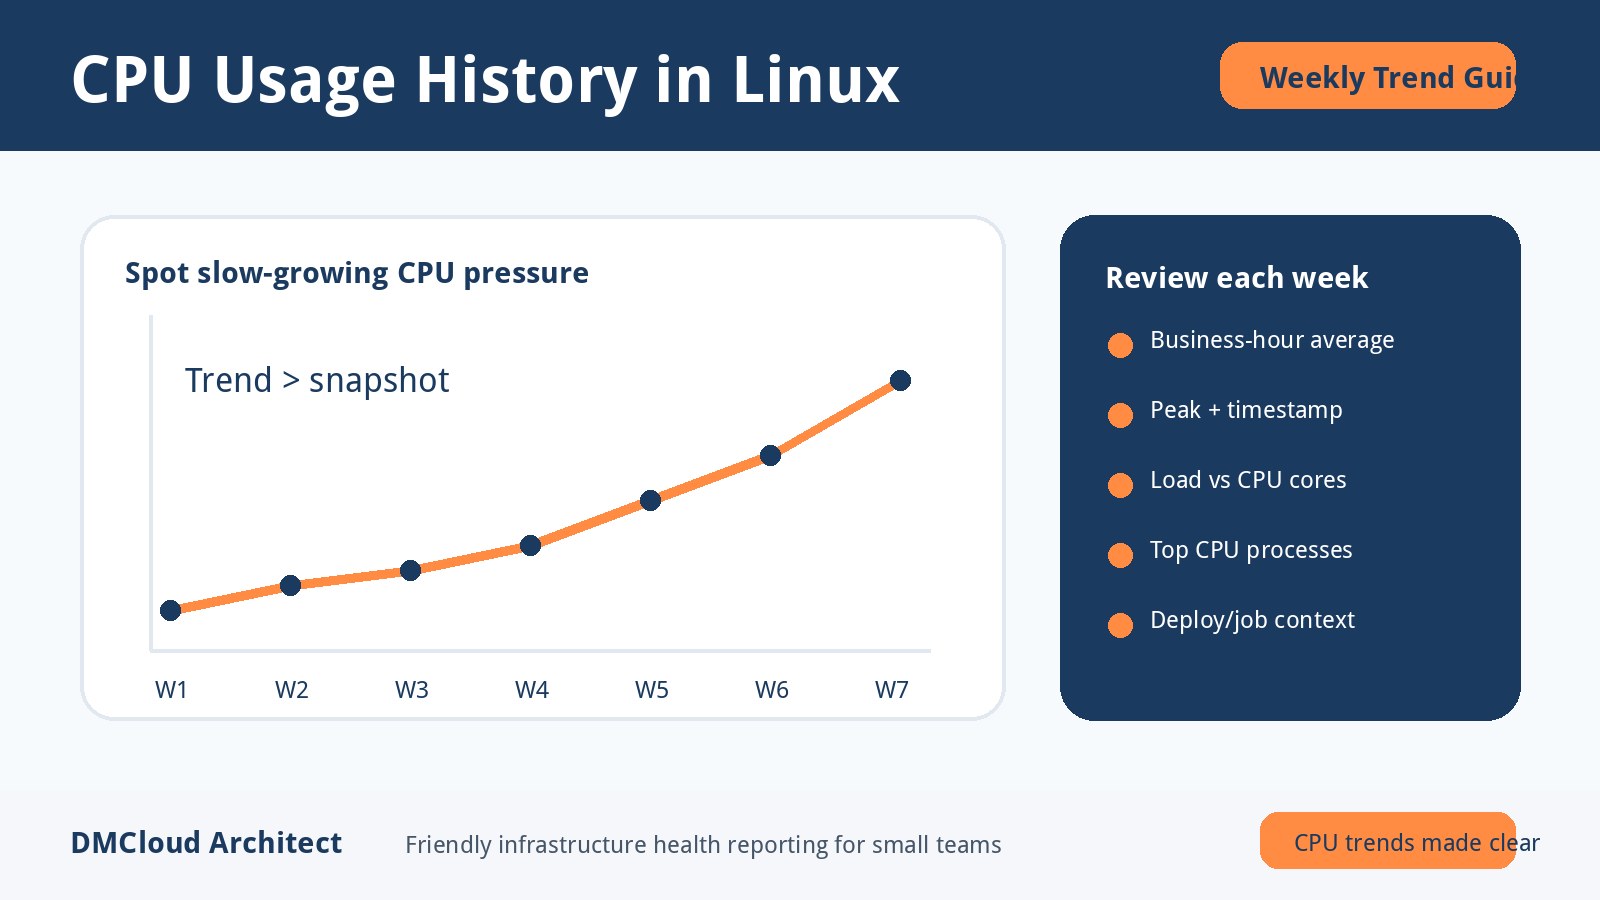
- Is average CPU pressure slowly increasing week over week?
- Are one or two processes responsible for most of the load?
- Is the instance sized correctly for the current traffic pattern?
Those questions keep the workflow practical. Instead of collecting every possible metric, you collect a short set of observations that help you decide what to do next.
Use uptime to check load pressure quickly
The simplest first check is often:
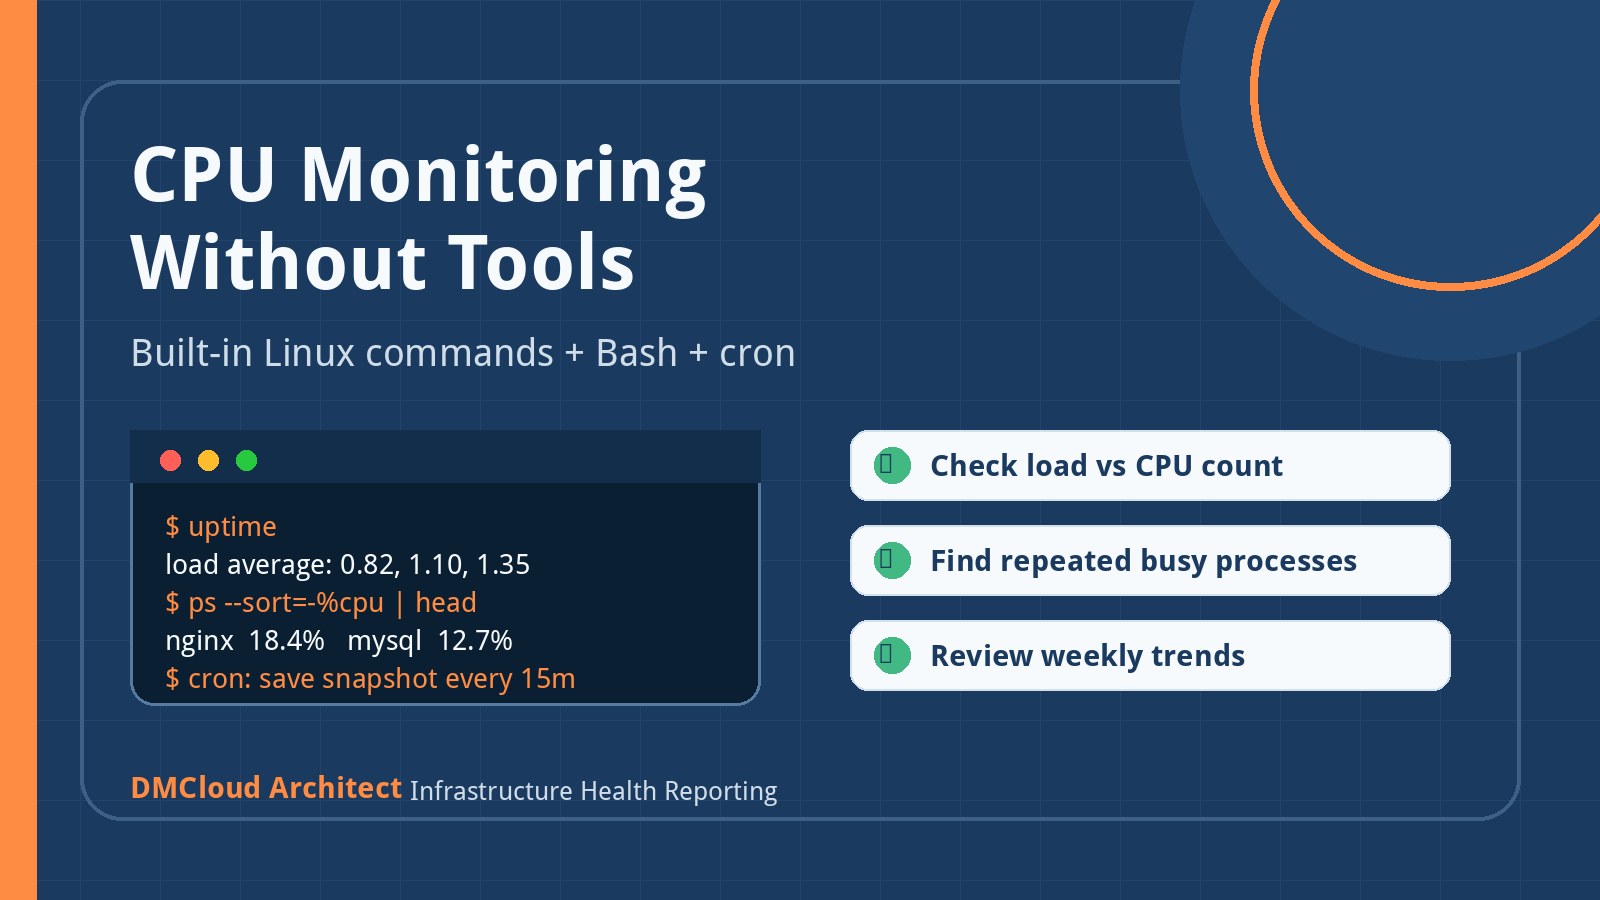
uptimeThis shows the 1-minute, 5-minute, and 15-minute load averages. Load average is not the same as CPU percentage, but it is a strong early clue. On a 2-vCPU server, a sustained load near or above 2.00 usually deserves attention. On an 8-vCPU server, the same number may be perfectly normal.
Compare load average to the number of available CPUs:
nprocIf the 15-minute load average is consistently near or above the CPU count, the server may be running at or beyond comfortable capacity. If the 1-minute load is high but the 15-minute load is calm, you may be seeing a short burst rather than a sustained problem.
Use top or ps to find the busy process
When load is high, the next step is to identify what is using CPU. For an interactive view, run:
topPress P to sort by CPU usage if it is not already sorted. Look for repeated patterns rather than a single surprising second. A web worker, database process, backup command, image conversion job, or reporting task may briefly use a lot of CPU and still be healthy.
For a script-friendly snapshot, use:
ps -eo pid,ppid,comm,%cpu,%mem --sort=-%cpu | head -n 12This gives you the top CPU consumers at that moment. It is especially helpful when pasted into a support ticket, incident note, or weekly server review.
Check CPU time by category
High CPU usage is more useful when you know what kind of CPU time it is. If vmstat is available, run:
vmstat 5 3The us column shows user/application CPU time, sy shows system/kernel CPU time, id shows idle time, and wa shows I/O wait. A server with high I/O wait may look busy, but the root cause may be disk latency rather than raw CPU shortage. That difference matters because upgrading CPU will not fix slow storage.
For a tiny server, a few repeated vmstat samples can quickly separate three common situations: an application doing real work, the kernel spending time on system operations, or processes waiting on I/O.
Create a simple CPU monitoring script
For lightweight history, save a small snapshot to a local log file. Here is a simple Bash example:
#!/usr/bin/env bash
set -euo pipefail

OUT="/var/log/simple-cpu-monitor.log"
TS="$(date -Is)"
HOST="$(hostname -f 2>/dev/null || hostname)"
LOAD="$(uptime | sed 's/.*load average: //')"
CPUS="$(nproc)"
TOP_PROC="$(ps -eo comm,%cpu --sort=-%cpu | awk 'NR==2 {print $1 " " $2}')"

printf '%s host=%s cpus=%s load=%s top_process=%s\n' \
  "$TS" "$HOST" "$CPUS" "$LOAD" "$TOP_PROC" >> "$OUT"
Save it as /usr/local/sbin/simple-cpu-monitor.sh, then make it executable:
sudo chmod 0755 /usr/local/sbin/simple-cpu-monitor.shRun it manually once and confirm the output is readable:
sudo /usr/local/sbin/simple-cpu-monitor.sh
sudo tail -n 5 /var/log/simple-cpu-monitor.log
This is intentionally small. It records timestamp, host, CPU count, load averages, and the top CPU process. That is enough to create a practical trail without installing agents or building a dashboard.
Schedule snapshots with cron
To collect regular history, add a cron entry:
*/15 * * * * /usr/local/sbin/simple-cpu-monitor.shFor many small servers, every 15 minutes is a reasonable starting point. It is frequent enough to show daily patterns, but light enough that the monitoring itself stays negligible. If the server is very busy or short-lived, use a shorter interval during troubleshooting and then return to a calmer schedule.
Remember to rotate the log. A minimal logrotate file might look like this:
/var/log/simple-cpu-monitor.log {
  weekly
  rotate 8
  compress
  missingok
  notifempty
}
This keeps a couple of months of weekly compressed history without letting the file grow forever.
Review trends instead of chasing every spike
The biggest mistake with simple CPU monitoring is overreacting to individual spikes. A backup, package update, report export, or short traffic burst can temporarily raise CPU usage without indicating a capacity problem. The better habit is to review trends.
Once a week, check:
- Whether the 15-minute load average is rising compared with previous weeks.
- Whether the same process appears as the top CPU consumer repeatedly.
- Whether high CPU aligns with known scheduled work, such as backups or reports.
- Whether user-facing slowdowns happen at the same time as CPU pressure.
- Whether CPU pressure appears together with memory pressure or I/O wait.
This turns simple command output into operational context. The value is not just the number; it is the story the number tells over time.
Know when simple checks are not enough
CPU monitoring without tools is great for quick visibility, small environments, and emergency troubleshooting. It is not enough when you need alerting, long retention, per-container breakdowns, application tracing, or correlation across many servers. It also will not automatically explain database query behavior, queue backlogs, or user experience.
Move beyond this approach when you need:
- Automatic alerts when sustained CPU pressure crosses a threshold.
- Centralized history across multiple servers.
- Dashboards for business stakeholders or clients.
- Capacity planning reports that combine CPU, memory, disk, and database signals.
- Evidence for cloud resizing or performance tuning decisions.
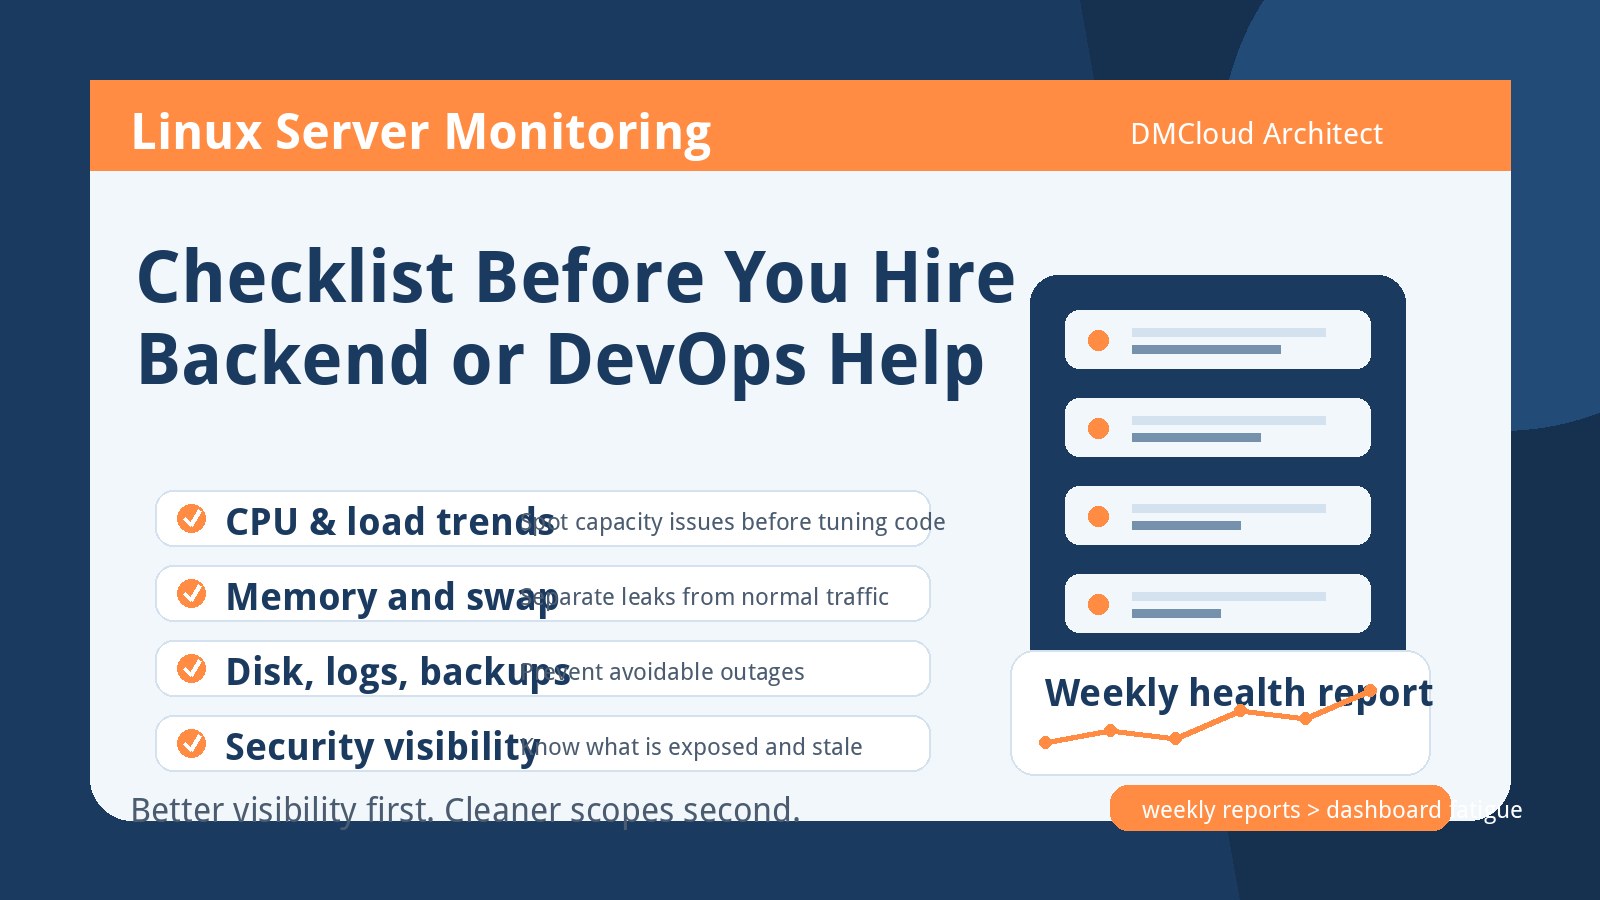
A lightweight script is a helpful starting point, but it should eventually feed a clearer review process. For small teams, a weekly infrastructure health report can bridge the gap between raw metrics and practical action.
A practical weekly CPU review checklist
If you only have 10 minutes each week, use this checklist:
- Confirm the server CPU count with
nproc. - Review recent 15-minute load averages and compare them to CPU count.
- Look for repeated top CPU processes in the snapshot log.
- Check whether high CPU periods match known cron jobs, backups, or traffic peaks.
- Use
vmstatduring a busy period to separate CPU pressure from I/O wait. - Write down one action: tune, reschedule, resize, investigate, or keep watching.
That final action matters. Monitoring should lead to decisions, not just more files. Even a short weekly note can help you avoid surprise slowdowns and make cloud spending conversations more objective.
Summary
CPU monitoring without tools is a practical way to understand Linux server health before committing to a larger monitoring platform. Start with load average, identify busy processes, sample CPU categories with vmstat, and store lightweight snapshots with Bash and cron. Review the trend weekly, focus on sustained pressure, and use the results to decide whether to tune workloads, reschedule jobs, resize infrastructure, or adopt a more complete reporting workflow.
Want weekly infrastructure health checks without dashboard fatigue?
DMCloud Architect sends Linux and MySQL infrastructure health reports directly to your inbox, so you can spot risks early without adding another monitoring dashboard to watch.
Get the free starter plan for weekly infrastructure health reports.