A server can feel slow long before it reaches 100 percent CPU. Requests begin to queue, scheduled jobs take longer, database queries overlap, and normal traffic starts consuming more processing time than it did a month ago. Useful CPU bottleneck reporting on Linux catches that pattern early and explains whether the processor is truly the limiting resource.
A single utilization number cannot do that job. A practical report combines CPU time, load, runnable tasks, process evidence, latency, and workload context. The result should help a developer or small business owner answer three questions: Is performance degrading, what is driving it, and what should happen next?
Define a CPU bottleneck before reporting one
A CPU bottleneck exists when demand for processor time persistently exceeds the capacity available to the workload and causes meaningful delay. High CPU can be part of that evidence, but it is not sufficient by itself. A batch job may use every core for five minutes and finish on schedule without affecting users. That is efficient use, not necessarily a fault.
Look for sustained utilization together with a growing run queue, longer request or job duration, and a process or workload that accounts for the demand. If CPU usage is modest while tasks remain blocked, storage, network, locks, memory pressure, or an external dependency may be the real constraint. Reporting the wrong bottleneck wastes time and can lead to unnecessary upgrades.
Collect the minimum set of Linux CPU signals
Start with system-wide CPU percentages split into user, system, idle, I/O wait, and steal time. User time points toward application work. System time reflects kernel activity such as networking, filesystems, and process management. I/O wait suggests tasks are waiting for storage, while steal time matters on virtual machines when the hypervisor is serving another guest.
Add load average and the number of runnable tasks. Load average alone is easy to misread because it includes runnable work and, on Linux, tasks in uninterruptible sleep. Compare it with the number of logical CPUs and inspect the run queue directly. A load of eight has a different meaning on a two-core virtual machine than on a sixteen-core server.
Finally, collect per-process CPU consumption, thread counts, context-switch rates, and application latency or job duration. These signals connect host pressure to an accountable workload. Tools such as top, pidstat, vmstat, mpstat, and sar can provide the raw evidence without requiring a heavy monitoring platform.
Distinguish CPU pressure from I/O and memory pressure
A busy server is not automatically CPU-bound. High I/O wait with a low run queue may point to slow disks or saturated storage. Frequent swapping can make applications appear CPU-heavy while memory pages are constantly moved. Database locks can extend request duration even when the processor has spare capacity.
- Likely CPU pressure: sustained user or system time, a growing runnable queue, low idle time, and higher application latency.
- Likely storage pressure: elevated I/O wait, disk latency, blocked tasks, and throughput near the device limit.
- Likely memory pressure: low available memory combined with swap activity, reclaim work, or out-of-memory events.
- Likely virtualization contention: elevated steal time that aligns with slow application periods.
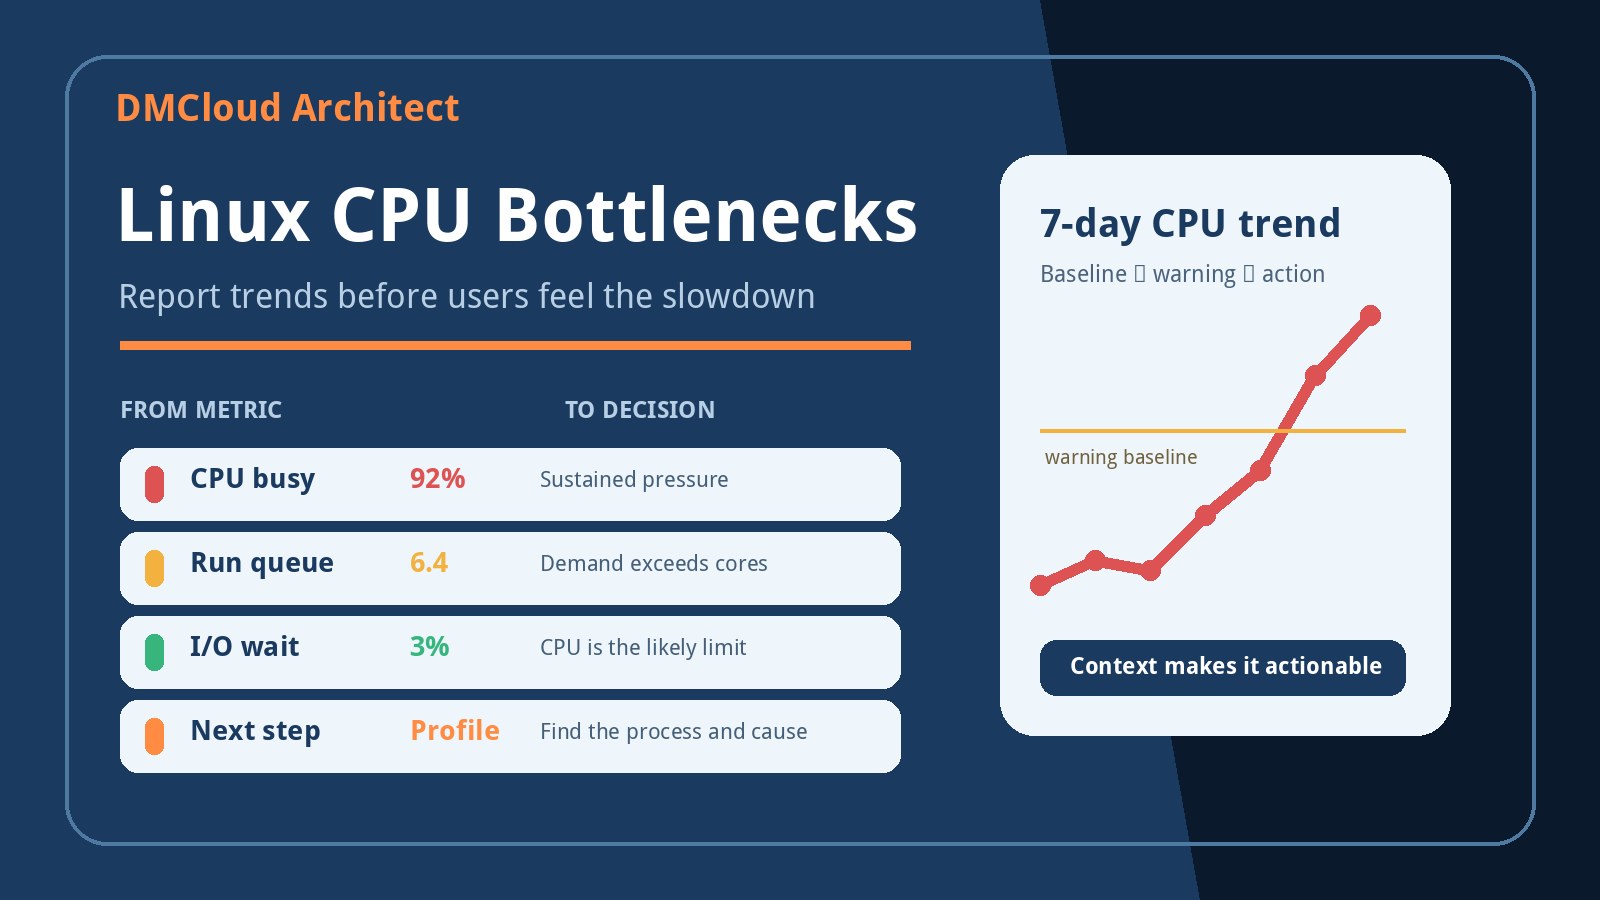
The report should state this distinction plainly. “CPU reached 91 percent” is an observation. “CPU demand exceeded four available cores for 18 minutes while API response time doubled; I/O wait remained below 3 percent” is evidence of a likely processor constraint.
Use baselines to detect CPU performance degradation
Early degradation is usually visible as change from normal behavior rather than a universal threshold. Compare the same workload periods across days or weeks. A nightly import that once used 55 percent CPU for twelve minutes but now uses 80 percent for twenty-five minutes deserves attention even if it never crosses a generic critical threshold.
Create baselines for typical business hours, scheduled jobs, backups, deployments, and peak traffic. Track duration as well as magnitude. A brief peak can be harmless; a steadily longer period above the normal range is often a better warning of growing data volume, inefficient code, an unindexed query, or increased customer demand.
Normalize comparisons where possible. Report CPU seconds per request, per job, or per thousand records alongside total utilization. This helps separate healthy growth in workload from a decline in efficiency.
Set warnings that account for duration and impact
A useful CPU saturation warning needs more than a percentage. Combine a level, a duration, and an impact signal. For example, sustained utilization above the established baseline for fifteen minutes may be a watch item; the same condition paired with a growing run queue and slower application responses may require action.
Use three simple states in a weekly report:
- Stable: CPU demand, queue depth, and workload duration remain within the expected range.
- Watch: one or more trends have moved beyond the baseline, but service impact is limited or not yet confirmed.
- Action needed: sustained processor pressure is delaying work, causing errors, or consuming the remaining capacity margin.
This structure reduces alert fatigue. It reserves immediate notifications for genuine service risk while preserving slower changes for the weekly review.
Identify the process, thread, and workload
Once host-level evidence points to CPU pressure, find the process responsible and determine whether one thread or many threads are active. A single-threaded process can saturate one core while total server utilization looks moderate. Conversely, a multi-process web service can consume all cores during a traffic spike.
Record the executable or service, its CPU share, relevant command context, and the time window. Then correlate it with deployments, cron jobs, traffic, queue depth, database activity, and logs. Do not rely only on a process snapshot after the event; short periodic samples or historical accounting are much more useful.
For a recurring application issue, profiling is the next step. Language-specific profilers, flame graphs, database query analysis, and request traces can reveal where processor time is spent. The weekly report does not need to contain all profiling data, but it should recommend the narrowest sensible investigation.
Account for containers and virtual machines
Containers can be throttled by CPU quotas even when the host has idle capacity. Include throttling time, configured limits, and container-level utilization when services run under Docker, Kubernetes, or another runtime. A container repeatedly hitting its quota may show application latency without an obvious host-wide saturation event.
On virtual machines, report the number of visible vCPUs and watch steal time. Also note recent instance-size changes or noisy-neighbor patterns. Adding vCPUs is not always the answer: software may not scale across cores, and an external quota or inefficient workload can remain the limit after an upgrade.
Turn raw measurements into a concise weekly report
A strong report leads with a conclusion and supports it with a small amount of evidence. Keep detailed command output available for investigation, but summarize the operational meaning.
- Status: stable, watch, or action needed.
- Change: what moved compared with the previous week or normal baseline.
- Evidence: CPU breakdown, run queue, duration, top process, and related latency.
- Context: traffic, scheduled work, release, data growth, or virtualization limits.
- Impact: whether customers, jobs, or service objectives were affected.
- Next action: one named investigation, optimization, schedule change, or capacity decision.
For example: “Watch: API CPU time per request increased 24 percent over four weeks. During Tuesday’s peak, all four vCPUs remained above 85 percent for 22 minutes, the runnable queue averaged 3.1, and response time rose from 280 ms to 510 ms. Profile the image-processing endpoint before the next release.” That is far more actionable than a chart labeled “high CPU.”
A practical Linux CPU reporting checklist
- Confirm the server’s logical CPU count and any VM or container limits.
- Capture user, system, idle, I/O wait, and steal percentages over useful intervals.
- Compare load and runnable tasks with available processing capacity.
- Identify top processes and whether pressure is single-threaded or distributed.
- Correlate CPU demand with application latency, throughput, traffic, and scheduled jobs.
- Compare the current period with workload-specific baselines and previous weeks.
- Rule out storage, memory, lock, network, and external-service constraints.
- Assign one clear owner and next action when the status is watch or action needed.
Detect CPU issues early without another noisy dashboard
The goal is not to collect every processor counter. It is to preserve enough history and context to recognize a CPU performance decline before it becomes an outage. Consistent baselines, duration-aware warnings, process evidence, and application impact make that possible.
DMCloud Architect turns Linux, MySQL, backup, and infrastructure signals into a concise weekly view for developers and small business owners. If you want trends, risks, and next actions without spending every day in monitoring dashboards, explore Infrastructure Health Reporting.