A database can accept connections and still be unhealthy. Slow queries may be accumulating, storage may be running out, backups may be failing quietly, or connection demand may be creeping toward a limit. A useful MySQL health check looks beyond service uptime and asks whether the database is reliable, responsive, recoverable, and ready for expected growth.
For developers and small business owners, the best routine is usually a short, consistent review rather than constant dashboard watching. The checklist below combines MySQL server monitoring with operating-system evidence and turns raw counters into decisions you can act on each week.
Start with scope and a known baseline
Before checking individual metrics, define which MySQL instance, application, and time period you are reviewing. Note the server version, workload pattern, maintenance window, and any important changes since the previous check. A deployment, bulk import, marketing campaign, or new integration can explain movement that would otherwise look mysterious.
A baseline is more useful than a universal threshold. Ten active connections may be normal for one application and a warning for another. Record healthy weekly values, then compare the current week with both the previous week and a longer normal range. Trends reveal slow deterioration that a single snapshot misses.
1. Confirm availability and restart history
Check whether MySQL is running and accepting an authenticated test query from the same network path used by the application. A process check alone cannot prove that authentication, name resolution, TLS, permissions, and query execution work end to end.
Review uptime and recent restart history. An unexpected restart may indicate a crash, an out-of-memory event, automated host maintenance, or an operator action. Correlate the timestamp with the MySQL error log and the system journal rather than assuming the service recovered cleanly.
- Run a lightweight query such as
SELECT 1;with a monitoring account. - Check MySQL uptime and compare it with the expected maintenance history.
- Inspect recent error-log entries for crashes, recovery, corruption, and repeated warnings.
- Confirm the application can complete an important read or write path.
2. Review connections and session pressure
Compare current connections, peak connections, active threads, aborted connections, and connection errors. A rising peak may reflect healthy growth, but it may also expose an oversized pool, leaked sessions, slow requests, or jobs that overlap.
Do not solve every connection warning by raising max_connections. More concurrent sessions can increase memory use and contention. First identify whether sessions are active, idle, blocked, or repeatedly reconnecting. The safer fix may be pool tuning, shorter transactions, better indexes, or staggered background jobs.
3. Check query latency and slow-query cost
MySQL performance monitoring should connect database work to user experience. Compare application response time with query latency, query volume, and the slow-query log. Where possible, use latency percentiles rather than one average because a stable average can hide a worsening slow tail.
Rank slow statements by total time as well as individual duration. A query that is moderately slow and runs thousands of times may consume more capacity than one rare outlier. Review rows examined versus rows returned, execution plans, temporary tables, sorting, and full scans for high-cost statements.
When a query changes, preserve the before-and-after evidence. Record the execution plan, representative parameters, timing, and workload. An optimization is successful only when production measurements improve without creating unacceptable write overhead or another bottleneck.
4. Look for locks and long transactions
Lock waits, deadlocks, and long-running transactions often cause intermittent delays while host CPU and memory appear normal. Check whether their count or duration is rising. A forgotten transaction can retain row versions, delay cleanup, and make unrelated queries progressively more expensive.
Capture the statements and application context before terminating sessions whenever the situation allows. Common fixes include shortening transaction boundaries, accessing tables in a consistent order, adding an appropriate index, moving batch work, or improving retry behavior after a deadlock.
5. Review InnoDB and memory behavior
Inspect buffer pool use, dirty pages, checkpoint activity, redo pressure, and signs of memory stress. These counters matter most when compared with workload and host evidence. A lower cache hit pattern alongside dataset growth may show that the active working set no longer fits comfortably in memory.
Also check Linux memory pressure, swap activity, and out-of-memory events. Low free memory by itself is not proof of trouble because Linux uses spare memory for cache. Sustained swapping, growing allocation pressure, or a killed MySQL process is stronger evidence that the system needs investigation.
6. Check disk capacity and storage latency
Measure free space on the filesystem containing MySQL data, binary logs, temporary files, and backups. Include inode availability where relevant. Estimate time to exhaustion from the growth rate instead of relying only on a fixed percentage threshold.
Review disk latency and queueing during busy periods, backups, imports, and checkpoint activity. Low CPU with slow queries can indicate storage waits. Confirm that log retention and backup copies cannot unexpectedly fill the same volume used by the live database.
- Track data, index, binary-log, temporary, and backup growth separately.
- Set a capacity horizon that leaves time to expand or clean up safely.
- Verify log rotation and retention policies are actually taking effect.
- Investigate latency changes alongside query volume and maintenance jobs.
7. Verify backups and recovery readiness
A successful backup job is not the same as a recoverable database. Confirm the latest backup completed, produced a plausible file size, reached the intended destination, and remains within retention. Check that encryption keys and credentials needed for recovery are available through a controlled process.
Schedule restore tests and record their results. A restore test catches corrupt archives, missing logs, incompatible procedures, and unrealistic recovery assumptions. If point-in-time recovery matters, verify binary-log continuity and confirm that retention supports the required recovery window.
8. Check replication when it is part of the design
For replicated systems, review replica connectivity, delay, SQL or I/O errors, and data consistency indicators. A replica can appear connected while falling progressively behind. Compare lag with workload peaks and long-running transactions, and make sure monitoring distinguishes a deliberately delayed replica from an unhealthy one.
Know the purpose of each replica. A reporting replica, high-availability standby, and backup source have different acceptable lag and recovery requirements. Test the operational procedure for promotion rather than assuming replication automatically provides failover.
9. Review security and configuration drift
Check for unexpected users, broad privileges, remote access changes, expired certificates, weak authentication settings, and configuration changes. Confirm that application accounts have only the permissions they need and that administrative access is restricted and auditable.
Compare important MySQL settings with the approved configuration. Drift can happen after upgrades, emergency changes, image replacement, or manual troubleshooting. Record why a value changed and how it will be validated or rolled back.
10. Correlate MySQL with the host and application
Database health cannot be interpreted in isolation. Place query latency beside CPU saturation, load average, memory pressure, disk latency, filesystem growth, application errors, traffic, and deployment timestamps. Correlation narrows the search even when it does not prove cause.
For example, rising latency with stable traffic and increasing rows examined suggests a query-plan or data-growth issue. Rising latency with doubled traffic may indicate capacity pressure. Slow queries with low CPU can point toward locks or storage. This context makes MySQL health reporting useful instead of merely descriptive.
Turn the weekly check into a short report
A practical report should lead with overall status and exceptions, then summarize availability, performance, connections, storage, backups, security, and capacity. Include only charts or counters that support a decision. Mark each finding as healthy, watch, or action required, and assign an owner and date to every action.
- Healthy: within the established range, with no adverse trend.
- Watch: still operating normally, but movement deserves another comparison.
- Action required: evidence shows user risk, recovery risk, or shrinking capacity headroom.
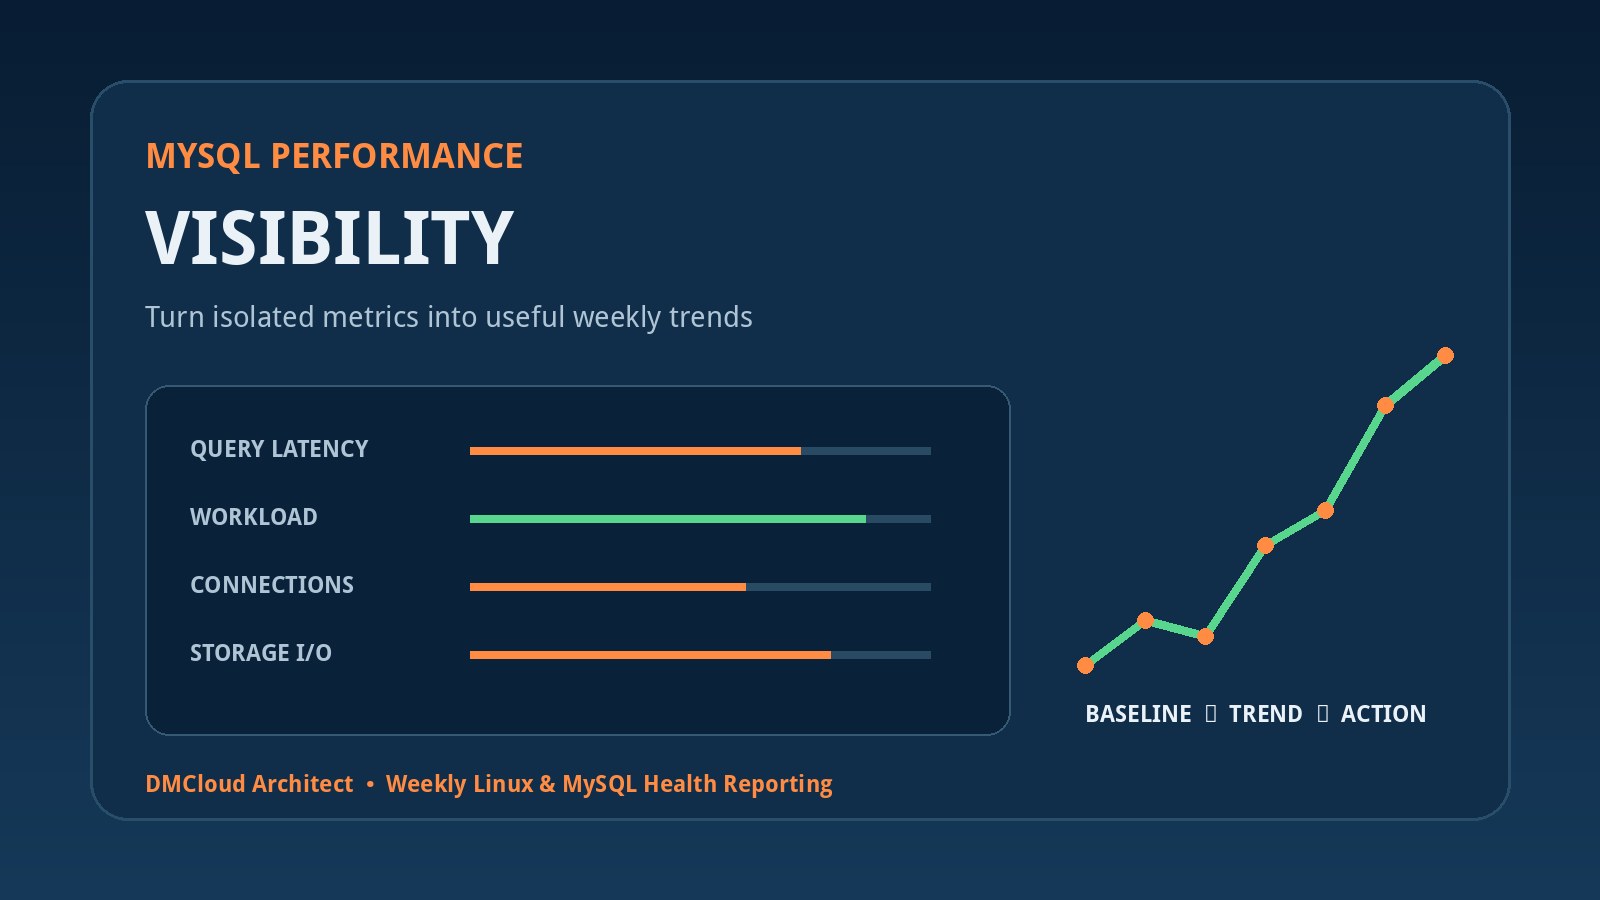
Keep the process repeatable. Use the same collection time, definitions, and comparisons each week. Simple MySQL monitoring becomes valuable when it shows direction: latency rising for four weeks, backup duration expanding with data size, free space shrinking faster, or aborted connections appearing after a release.
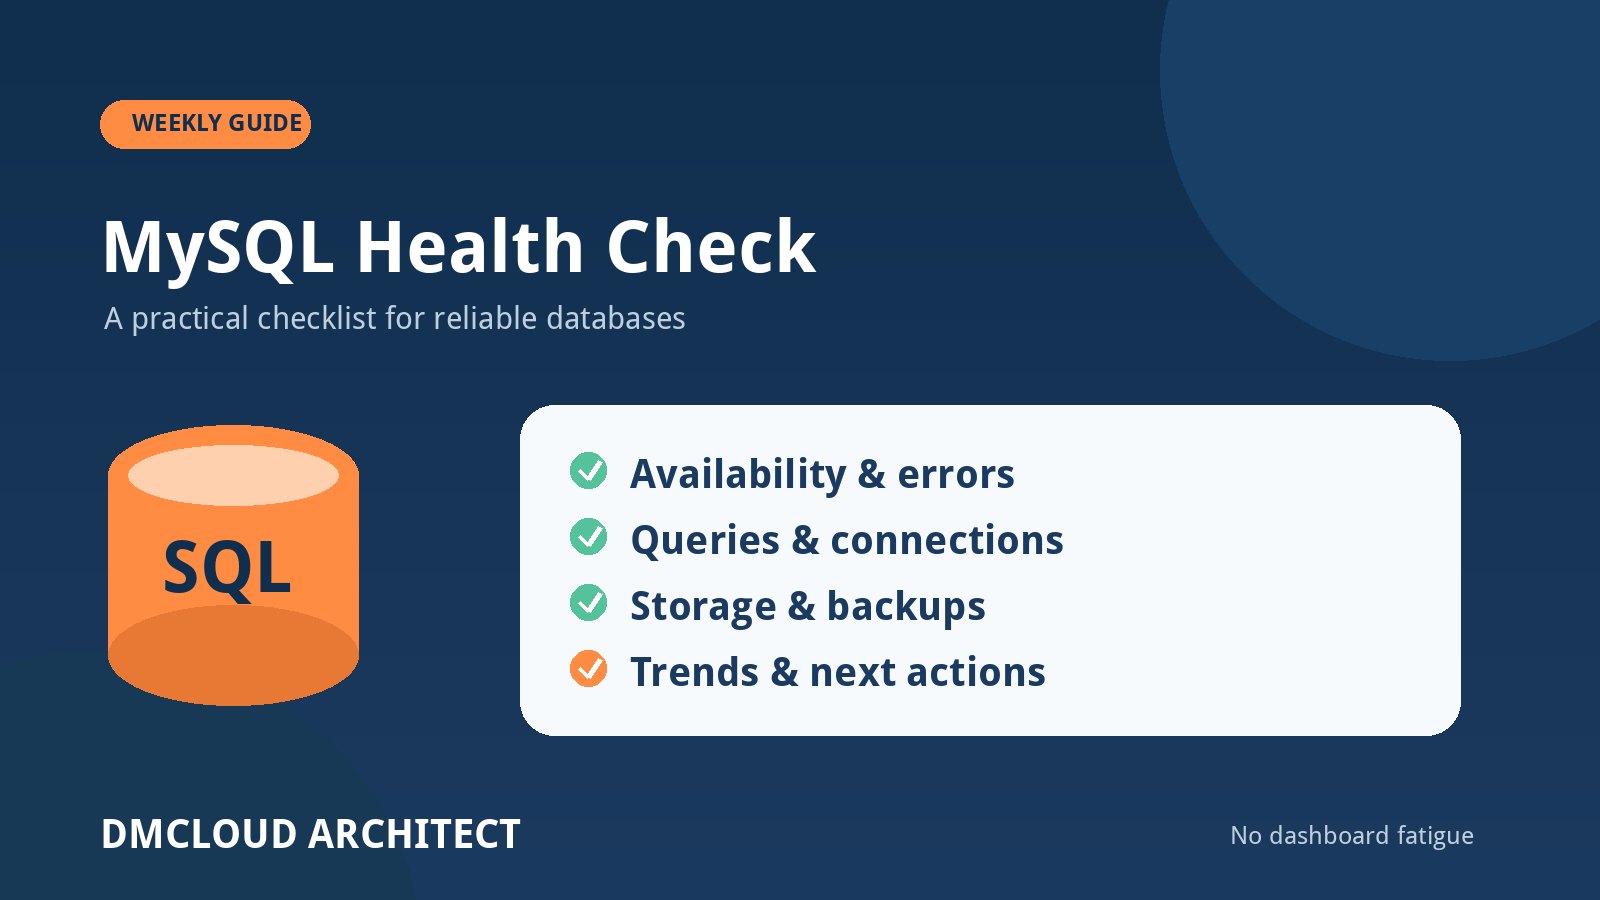
A compact weekly MySQL checklist
- Confirm authenticated connectivity and important application paths.
- Review uptime, restarts, errors, and recovery messages.
- Compare connections, active sessions, and aborted connections.
- Review latency percentiles, slow-query cost, and execution-plan changes.
- Check locks, deadlocks, and long-running transactions.
- Compare InnoDB, memory, CPU, and storage behavior with the baseline.
- Forecast disk capacity and verify log retention.
- Confirm backup completion and recent restore-test evidence.
- Review replication health, security, and configuration drift.
- Record findings, owners, deadlines, and the next verification step.
A MySQL health check works best as a trend-based operating habit, not a one-time emergency command. DMCloud Architect turns Linux and MySQL signals into concise weekly reports for developers and small business owners. For clear health trends and practical next actions without another dashboard, explore Infrastructure Health Reporting.