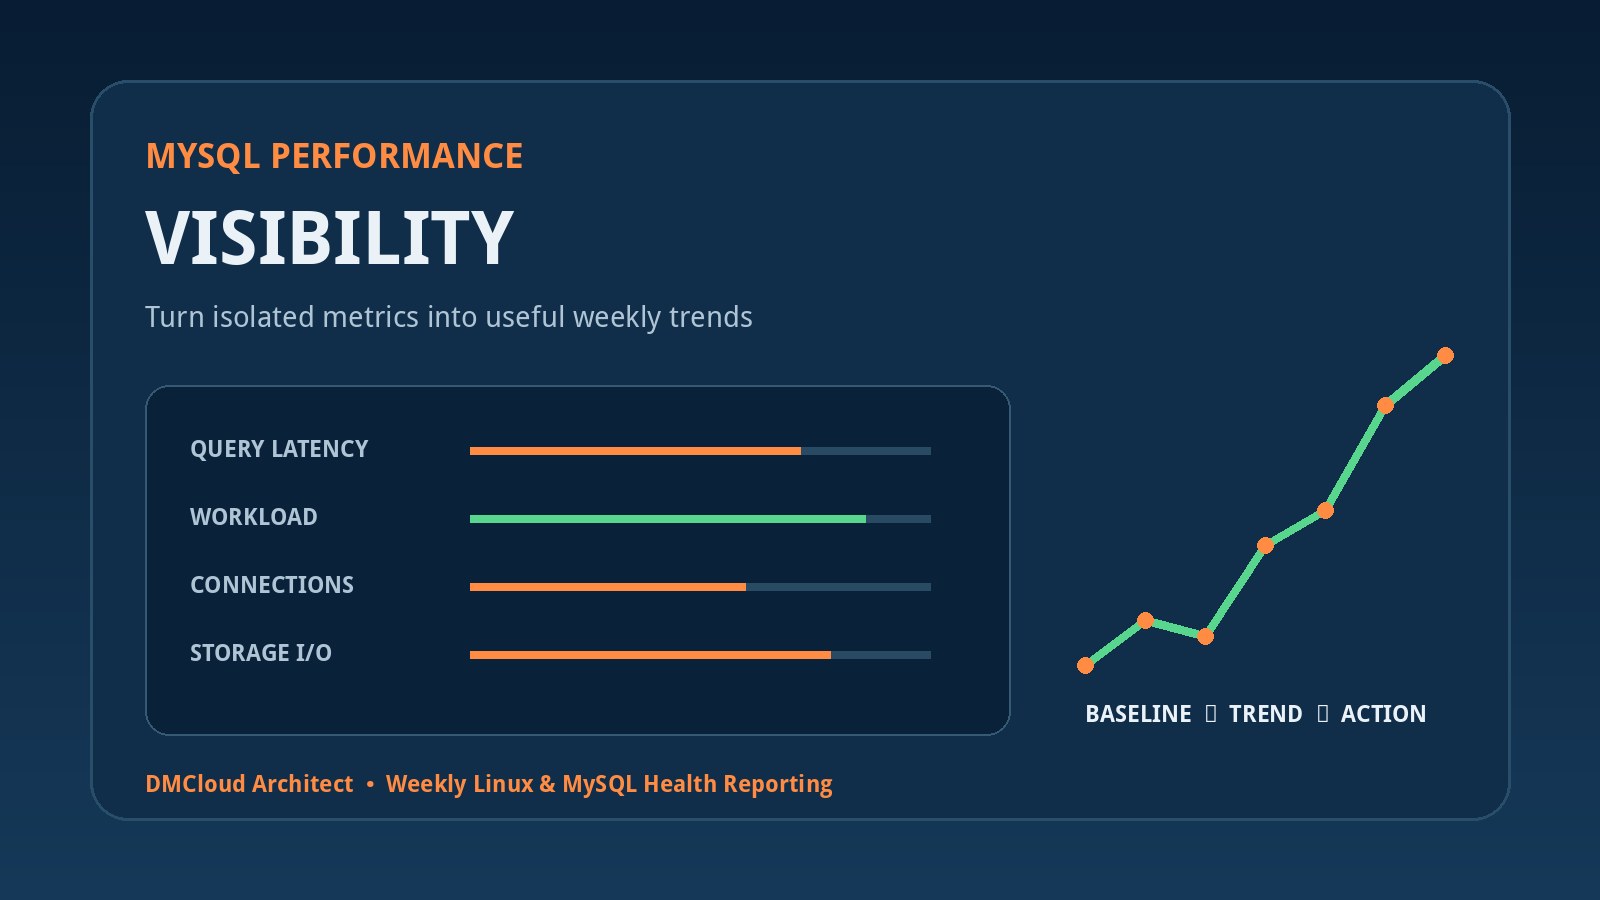
MySQL can remain online while becoming slower a little at a time. Queries take a few milliseconds longer, connections stay open for longer, temporary work increases, and storage latency becomes less forgiving. Each change may look harmless in isolation. Without MySQL performance visibility, the combined trend often becomes obvious only after users report delays.
Useful visibility does not require watching dozens of dashboards. It requires a consistent baseline, a compact set of measurements, and enough context to explain why those measurements changed. For developers and small business owners, a weekly trend review can reveal gradual performance loss without creating another stream of noisy alerts.
What MySQL performance visibility should answer
A good performance view should answer four practical questions: Is the workload changing? Are queries taking longer? Is MySQL waiting for a constrained resource? Did a release, configuration change, or data-growth event alter normal behavior? If the report cannot help answer those questions, more metrics will not necessarily make it more useful.
Start by defining the important application paths. A database supporting checkout, customer login, reporting, or scheduled billing needs measurements that reflect those outcomes. Host uptime alone is not enough. MySQL may accept connections while a critical query waits on a lock or reads far more rows than it did last month.
Build a baseline before choosing thresholds
A baseline describes normal behavior across ordinary busy and quiet periods. Collect at least several representative weeks when possible. Include weekdays, weekends, backups, report jobs, imports, and known traffic peaks. Record deployments and maintenance so later changes have context.
Generic thresholds can provide an initial safety net, but they cannot describe every workload. Fifty active connections may be excessive for one application and routine for another. A query latency of 200 milliseconds may be acceptable for an internal report but damaging for a frequently called API. Compare the system with its own healthy history before labeling a value good or bad.
Track workload before interpreting performance
Performance measurements need a workload denominator. Record queries or transactions per second, active sessions, rows examined, rows returned, and the timing of recurring jobs. If latency rises while workload doubles, capacity may be the primary concern. If latency rises while workload stays flat, investigate query plans, locking, cache behavior, storage, and recent changes.
MySQL workload trends also expose changes that application teams may not notice immediately. A new feature can call the same query repeatedly, a crawler can increase read traffic, or a scheduled integration can shift into business hours. A simple weekly comparison makes those patterns easier to connect to releases and operating schedules.
Measure latency as a distribution, not one average
An average can hide the requests that users actually feel. Where tooling allows it, compare median latency with a higher percentile such as the 95th percentile. Also track the count and total time of slow queries. A stable average alongside a rising slow tail often means a subset of queries, parameters, or concurrent workloads needs attention.
Use the slow query log carefully. Set a threshold suited to the application, control retention, and review the queries responsible for the most total time, not only the single slowest statement. A moderately slow query executed thousands of times can consume more capacity than one rare outlier.
Compare connections and concurrency
Review current and peak connections, aborted connections, thread activity, connection errors, and time spent waiting. Increasing connection counts can indicate traffic growth, but they can also reveal a pool that is too large, leaked sessions, slow application requests, or jobs that overlap unexpectedly.
Do not respond by raising max_connections automatically. Every additional active session can add memory and contention. First determine whether connections are busy, idle, blocked, or repeatedly reconnecting. The useful action may be to repair pooling, shorten transactions, stagger jobs, or optimize the query keeping sessions occupied.
Watch locks and transaction behavior
Lock waits, deadlocks, long-running transactions, and history growth can explain intermittent slowdowns that host metrics miss. Track whether their frequency or duration is increasing. A transaction left open by an application path can retain row versions, delay cleanup, and make unrelated work progressively more expensive.
When a lock trend changes, capture the statements and application context rather than treating the symptom as a database-only issue. The fix may involve transaction boundaries, statement order, indexes, retry logic, or moving a batch process away from a busy period.
Connect query behavior to execution plans
Data growth can change the economics of a query even when the SQL text stays the same. Review rows examined versus rows returned, full scans, temporary tables, sorting, and execution plans for important or high-cost statements. A query that once touched hundreds of rows may now inspect millions.
Use EXPLAIN and, where safe and supported, runtime plan analysis to validate assumptions. Check index selectivity, stale statistics, changed parameter patterns, and whether an optimization merely shifts cost to writes or storage. Preserve the before-and-after evidence so the next trend review can confirm the improvement.
Include InnoDB and storage signals
Buffer pool effectiveness, dirty pages, checkpoint activity, redo pressure, I/O latency, and fsync behavior help explain whether MySQL is serving work from memory or waiting on storage. These values are most useful as trends linked to workload and host capacity.
For example, a falling buffer pool hit pattern alongside rapid dataset growth may indicate that the active working set no longer fits comfortably in memory. Rising storage latency during backups may indicate scheduling or I/O contention. Avoid tuning one counter in isolation; confirm which user-facing latency changed at the same time.
Correlate MySQL with CPU, memory, disk, and the application
Database measurements should sit beside host and application evidence. Compare MySQL query latency with CPU saturation, load average, memory pressure, swap activity, disk latency, filesystem capacity, application response time, error rates, and deployment timestamps. Correlation does not prove causation, but it narrows the investigation.
This wider view prevents misleading conclusions. High CPU can be a sign that MySQL is doing productive work, while low CPU with slow queries can indicate lock waits or storage delays. Free memory can look low because Linux is using cache, while sustained swap activity points to genuine pressure.
Detect MySQL performance degradation early
MySQL performance degradation is often a slope rather than a sudden failure. Compare each week with both the previous week and a longer healthy baseline. Highlight sustained changes such as rising p95 latency, increasing rows examined per request, longer lock waits, growing disk usage, or backups taking progressively longer.
Separate short incidents from persistent movement. A one-hour spike during a planned import needs context, not panic. A five-percent latency increase repeated for six weeks deserves investigation even if no alert threshold has been crossed. Trend monitoring is valuable precisely because it notices direction before a hard limit is reached.
Create a concise weekly MySQL trend report
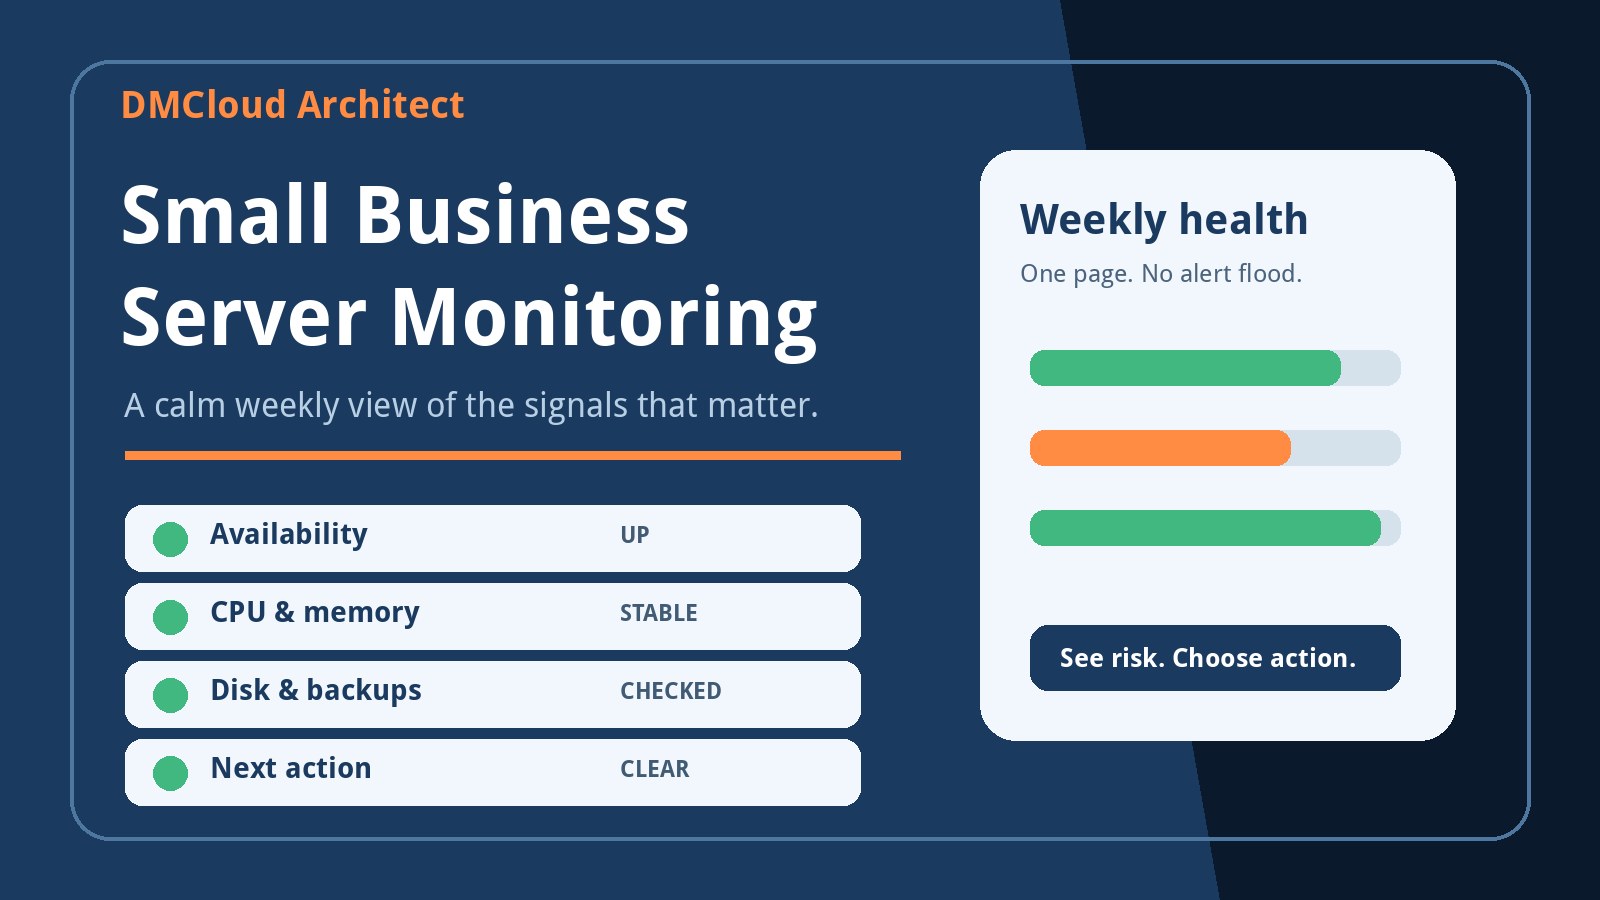
A useful report is short enough to read and specific enough to act on. Lead with overall status, then summarize workload, latency, connection behavior, query risks, resource pressure, backup health, and capacity. Show only charts that reveal a meaningful comparison.
- Workload: transactions, queries, active sessions, and recurring job timing.
- User impact: application response time, query latency percentiles, and errors.
- Query efficiency: slow-query cost, rows examined, scans, temporary work, and plan changes.
- Contention: lock waits, deadlocks, and long-running transactions.
- Resources: CPU, memory pressure, buffer behavior, storage latency, and disk growth.
- Resilience: backup completion, restore-test evidence, replication status, and capacity headroom.
Finish with a small action list. Each item should name the evidence, expected risk, owner, and next step. “Database slow” is not actionable. “Checkout p95 rose 18 percent for three weeks while rows examined doubled; review the changed plan and index selectivity before Friday” is.
A practical investigation sequence
When a trend looks wrong, begin with scope and timing. Confirm which application paths are affected and when the change started. Compare workload, releases, configuration, jobs, and data growth. Then identify the dominant wait or resource, inspect the highest-cost queries, test a focused change safely, and verify the result against the same baseline.
Change one important variable at a time where possible. Record configuration values and execution plans before tuning. A performance fix is complete only when production evidence shows that latency, resource use, or reliability improved without creating a new problem elsewhere.
Turn database metrics into decisions
MySQL trend monitoring works when it reduces uncertainty. A stable baseline shows what normal looks like; workload and latency trends show what users experience; query, lock, InnoDB, and host signals explain where to investigate. The result is earlier, calmer maintenance instead of reactive tuning after complaints.
DMCloud Architect turns Linux and MySQL health signals into concise weekly reports for developers and small business owners. If you want clearer performance trends and practical next actions without watching another dashboard, explore Infrastructure Health Reporting.