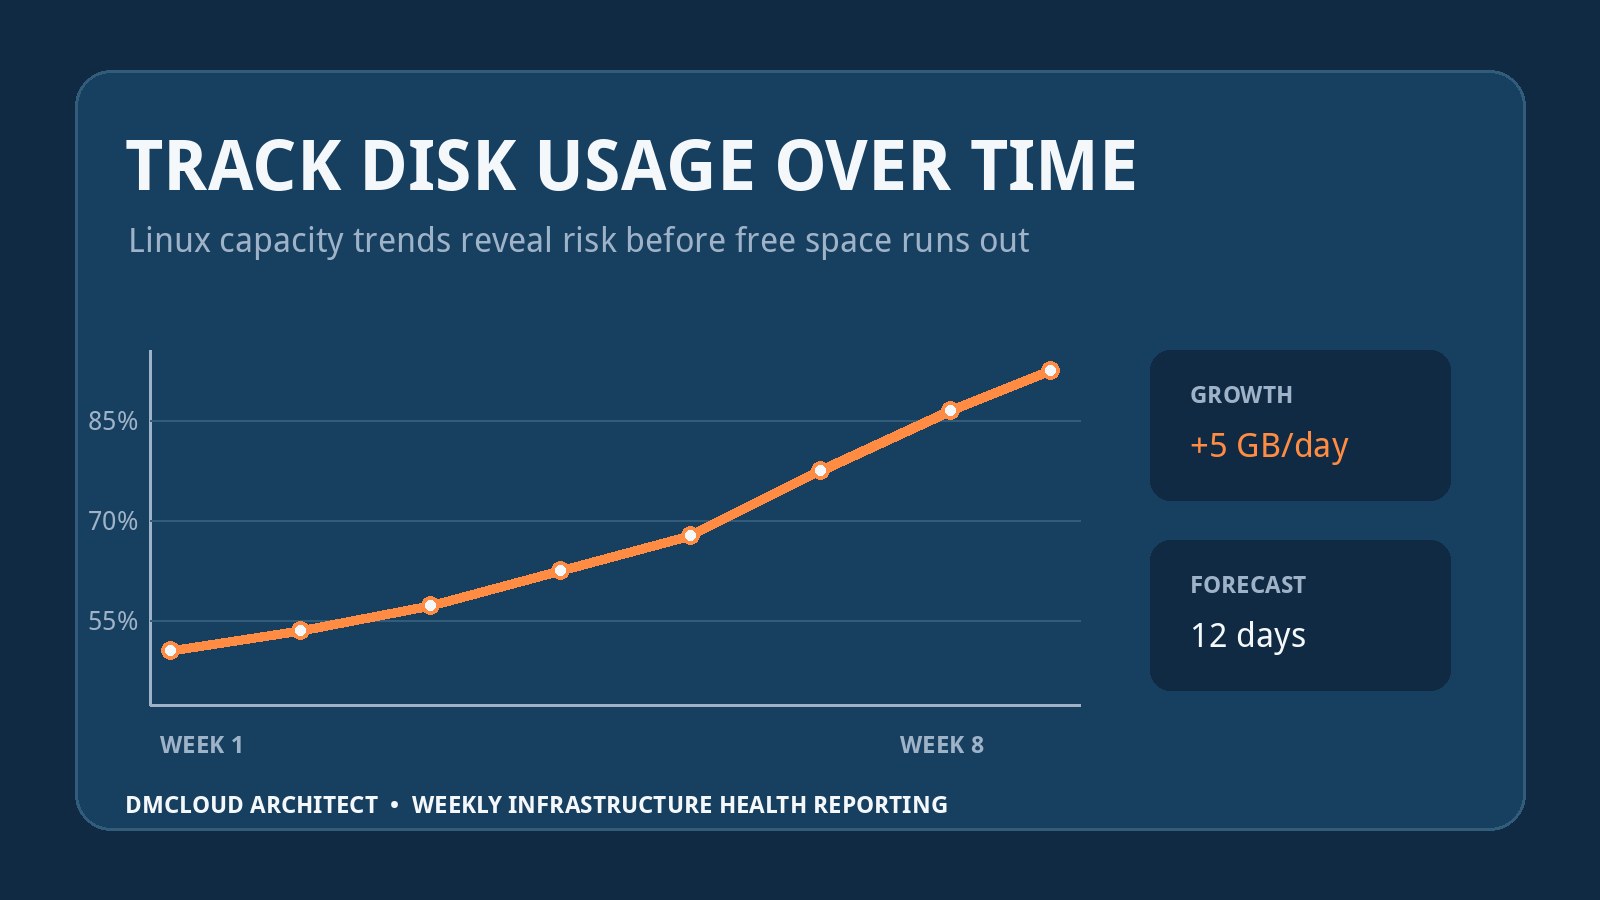
A Linux server can look healthy today and still be heading toward a storage incident. A single df result tells you how much space is free now, but it does not show whether a filesystem is growing by 200 MB a week or 20 GB a day. Tracking disk usage over time on Linux turns that snapshot into a capacity forecast.
You do not need a large monitoring platform to get useful trend data. A scheduled command, a small history file, and a weekly review can reveal steady growth, sudden jumps, and shrinking safety margins. The key is to collect consistent measurements and connect them to the workloads that create the data.
Why a disk usage snapshot is not enough
Percentage-used thresholds are useful, but they describe only the current state. Two filesystems at 70 percent can carry very different risks. One may have remained stable for a year; the other may have gained ten percentage points since Monday and be on course to fill before the weekend.
Trend data answers the operational questions that a snapshot cannot:
- How quickly is each filesystem growing?
- Is growth steady, seasonal, or sudden?
- How many days of usable capacity remain at the recent rate?
- Which application, database, log, backup, or user directory is responsible?
- Did cleanup or retention changes have the expected effect?
Start with consistent filesystem measurements
Collect the same fields at the same time each day. For local filesystems, df provides total, used, available, and percentage-used values. POSIX output keeps each filesystem on one line, while byte units make calculations consistent:
date -u +%Y-%m-%dT%H:%M:%SZ
df -P -B1 -x tmpfs -x devtmpfs
Exclude temporary pseudo-filesystems that do not represent persistent capacity. Be deliberate about network mounts: include them when your service depends on their available space, but label them separately because remote availability and reporting behavior may differ.
Record the filesystem device and mount point, not just a display name. Mount points can move, devices can be replaced, and containers can show filesystems differently from the host. Stable identifiers help prevent an apparent trend from being caused by a configuration change.
Save a lightweight daily history
A CSV file is enough for a small server. The following Bash example appends one row per persistent filesystem with a UTC timestamp:
#!/usr/bin/env bash
set -euo pipefail
out=/var/log/disk-usage-history.csv

if [[ ! -f "$out" ]]; then
  echo 'timestamp,filesystem,bytes_total,bytes_used,bytes_available,percent_used,mountpoint' > "$out"
fi

ts=$(date -u +%Y-%m-%dT%H:%M:%SZ)
df -P -B1 -x tmpfs -x devtmpfs | awk -v ts="$ts" 'NR > 1 {
  gsub(/%/, "", $5)
  print ts "," $1 "," $2 "," $3 "," $4 "," $5 "," $6
}' >> "$out"
Run the collector from a systemd timer or cron at a quiet, consistent time. Protect the output file from untrusted writes, monitor the collector itself, and apply rotation or retention so the measurement history does not become another source of uncontrolled growth.
Calculate growth rate instead of watching percentages alone
Compare used bytes between two observations and divide by elapsed time. If a filesystem gained 35 GB over seven days, its average growth was 5 GB per day. Available space divided by that growth rate gives a rough time-to-capacity estimate.
daily_growth = (used_now - used_previous) / elapsed_days
days_remaining = available_now / daily_growth
Treat the result as a forecast, not a promise. Growth may accelerate during imports, backups, sales periods, or product launches. Filesystem overhead and reserved blocks also mean that “100 percent” is not a safe operating target. Forecast against a practical action threshold such as 80 or 85 percent, with a suitable buffer for your workload.
Use multiple windows to avoid misleading forecasts
A one-day difference can be dominated by log rotation, a temporary export, or a backup cycle. Calculate short and medium windows—for example, seven-day and thirty-day growth. A fast seven-day rate with a modest thirty-day rate highlights a recent change; similar rates suggest sustained growth.
For cyclical workloads, compare equivalent points in the cycle. Measure Monday after the weekend backup against the previous Monday, not against Sunday before the backup. Median daily growth is often more robust than a simple average when occasional cleanup jobs create large downward steps.
Find what is consuming the space
A trend warning should lead to a focused investigation. Start at the affected mount point and summarize its largest top-level directories without crossing into other filesystems:
sudo du -x -h --max-depth=1 /var | sort -h
sudo du -x -h --max-depth=1 /srv | sort -h
Use du carefully on busy or very large trees because a full walk can create I/O load. Run it during an appropriate window, narrow the path, or use filesystem-specific tools and application metrics when available.
Common sources of unexplained growth include application logs without effective rotation, MySQL binary logs, database tables, container layers, package caches, abandoned uploads, local backup copies, and deleted files that remain open by a process. If df reports more usage than du can account for, check open deleted files with lsof +L1.
Monitor inode usage as well as bytes
A filesystem can fail to create files while plenty of byte capacity remains if it runs out of inodes. This is common when an application creates millions of small cache, session, queue, or temporary files. Add df -Pi to the collection and trend inode utilization for filesystems where file counts can grow rapidly.
Report byte capacity and inode capacity separately. A server at 45 percent bytes but 92 percent inodes needs action even though a conventional space alert may remain quiet.
Account for databases, containers, snapshots, and backups
Host filesystem growth is only the outer layer. For MySQL, correlate disk growth with database and table size, binary-log retention, temporary files, and backup output. A database directory growing steadily may be expected; a binary-log directory growing after a failed purge is a different issue with a different fix.
Container hosts need visibility into images, writable layers, volumes, and logs. Deleting a container does not always remove its volumes, and unbounded JSON logs can consume host capacity quickly. Avoid automated deletion until ownership and recovery requirements are clear.
Snapshots and backups can hide capacity use outside the normal directory view or on separate storage. Include their retention, repository growth, and restore requirements in the same weekly capacity conversation.
Choose warnings based on time to action
Static percentage thresholds remain useful as a final safety net, but trend warnings should consider how long your team needs to respond. A small server gaining 2 GB per day with 20 GB free has about ten days of raw capacity. If procurement, migration, or maintenance approval takes a week, that is already an action item.
- Stable: utilization and growth remain within the expected range, with a comfortable capacity horizon.
- Watch: growth has accelerated, the safety margin is narrowing, or an expected cleanup did not occur.
- Action needed: projected capacity is inside the response window, inode use is critical, or a sudden jump threatens service continuity.
Require both evidence and context in the warning. “Disk is 76 percent full” is less useful than “/var gained 48 GB in seven days, mainly under MySQL binary logs; at the current rate it will cross the 85 percent action threshold in nine days.”
Build a concise weekly disk growth report
A practical report does not need every daily measurement. For each important filesystem, include current utilization, change over the reporting period, seven- and thirty-day growth rates, forecast to the action threshold, inode status, likely growth source, and one recommended next step.
- Current state: used and available capacity, percentage used, and inode utilization.
- Trend: change since last week and whether growth is accelerating.
- Forecast: estimated time to the operational threshold, with assumptions stated.
- Cause: the directory, service, database, backup, or retention behavior driving growth.
- Action: clean up safely, correct retention, expand storage, archive data, or investigate the workload.
Keep raw measurements for audit and deeper analysis, but lead with the conclusion. Developers and business owners should be able to see which storage risk matters, why it changed, and who needs to act.
Track disk growth without another noisy dashboard
Reliable capacity planning starts with small, repeatable measurements. Daily collection and a weekly trend review expose slow growth that point-in-time alerts miss while keeping immediate notifications for genuinely urgent conditions.
DMCloud Architect turns Linux, MySQL, backup, and infrastructure signals into a clear weekly view with risks and next actions. To monitor disk growth and other operational trends without spending every day in dashboards, explore Infrastructure Health Reporting.