Most monitoring tools are built to answer one question: “Is something broken right now?”
That sounds useful—and it is—but it misses something critical. By the time you get an alert, the issue has already crossed a threshold. CPU is already spiking. Disk is already full. Queries are already slow.
Here’s the thing: infrastructure problems rarely appear instantly. They grow slowly, quietly, like a leak you don’t notice until the damage is obvious.
Why Traditional Monitoring Falls Short
Alert-based monitoring focuses on thresholds:
- CPU > 90%
- Disk usage > 85%
- Memory nearly exhausted
This works for detecting immediate failures. But it doesn’t tell you how you got there.
And that’s the real problem.
You’re seeing the result, not the progression.
In practice, this leads to:
- Reactive firefighting instead of proactive fixes
- Alert fatigue from noisy thresholds
- No visibility into slow degradation
So what does this mean? You’re constantly responding instead of preventing.
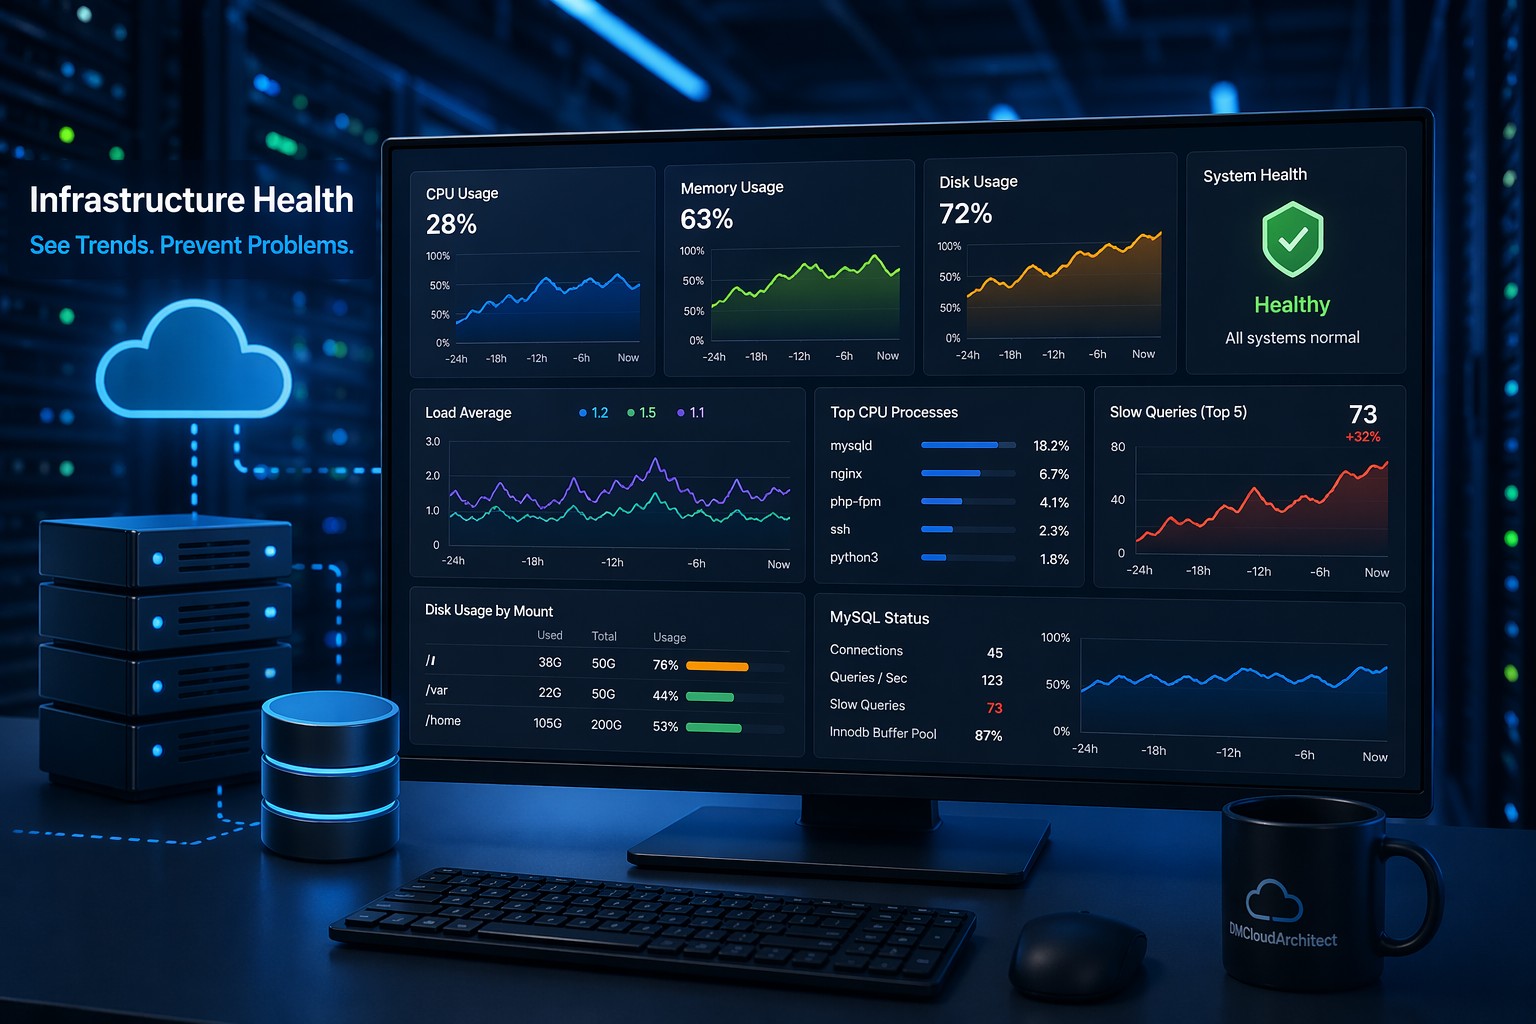
What Infrastructure Health Actually Means
Infrastructure health flips the perspective.
Instead of asking “Is something broken?”, it asks:
- How has this system been behaving over time?
- Are there patterns forming?
- Is performance trending in the wrong direction?
This is where things start to get interesting.
Because trends reveal problems long before alerts do.
Real-World Example: The Slow Disk Problem
Imagine a server where disk usage increases by 1% every day.
No alerts fire for weeks.
Everything looks fine—until suddenly you hit 90% and alarms go off.
Now you’re in a rush.
But if you had been tracking the trend:
- You would have seen steady growth
- You could predict when capacity runs out
- You could act early without urgency
This is the difference between reacting to a problem and managing it.
CPU Spikes vs CPU Trends
Short CPU spikes happen all the time. Most are harmless.
But a gradual increase in baseline CPU usage? That’s different.
It might indicate:
- Growing traffic
- Inefficient code paths
- Background jobs piling up
Traditional monitoring might ignore this completely.
Health reporting makes it visible.
And once you see the pattern, you can investigate before it becomes critical.
MySQL Performance: A Hidden Example
Database issues are rarely instant.
Slow queries tend to increase gradually:
- More data over time
- Indexes becoming less effective
- Query patterns changing
If you only rely on alerts, you’ll notice when latency spikes.
But if you track trends, you’ll see:
- Average query time creeping upward
- Slow query counts increasing week over week
- Performance degradation before users complain
That’s a completely different level of visibility.
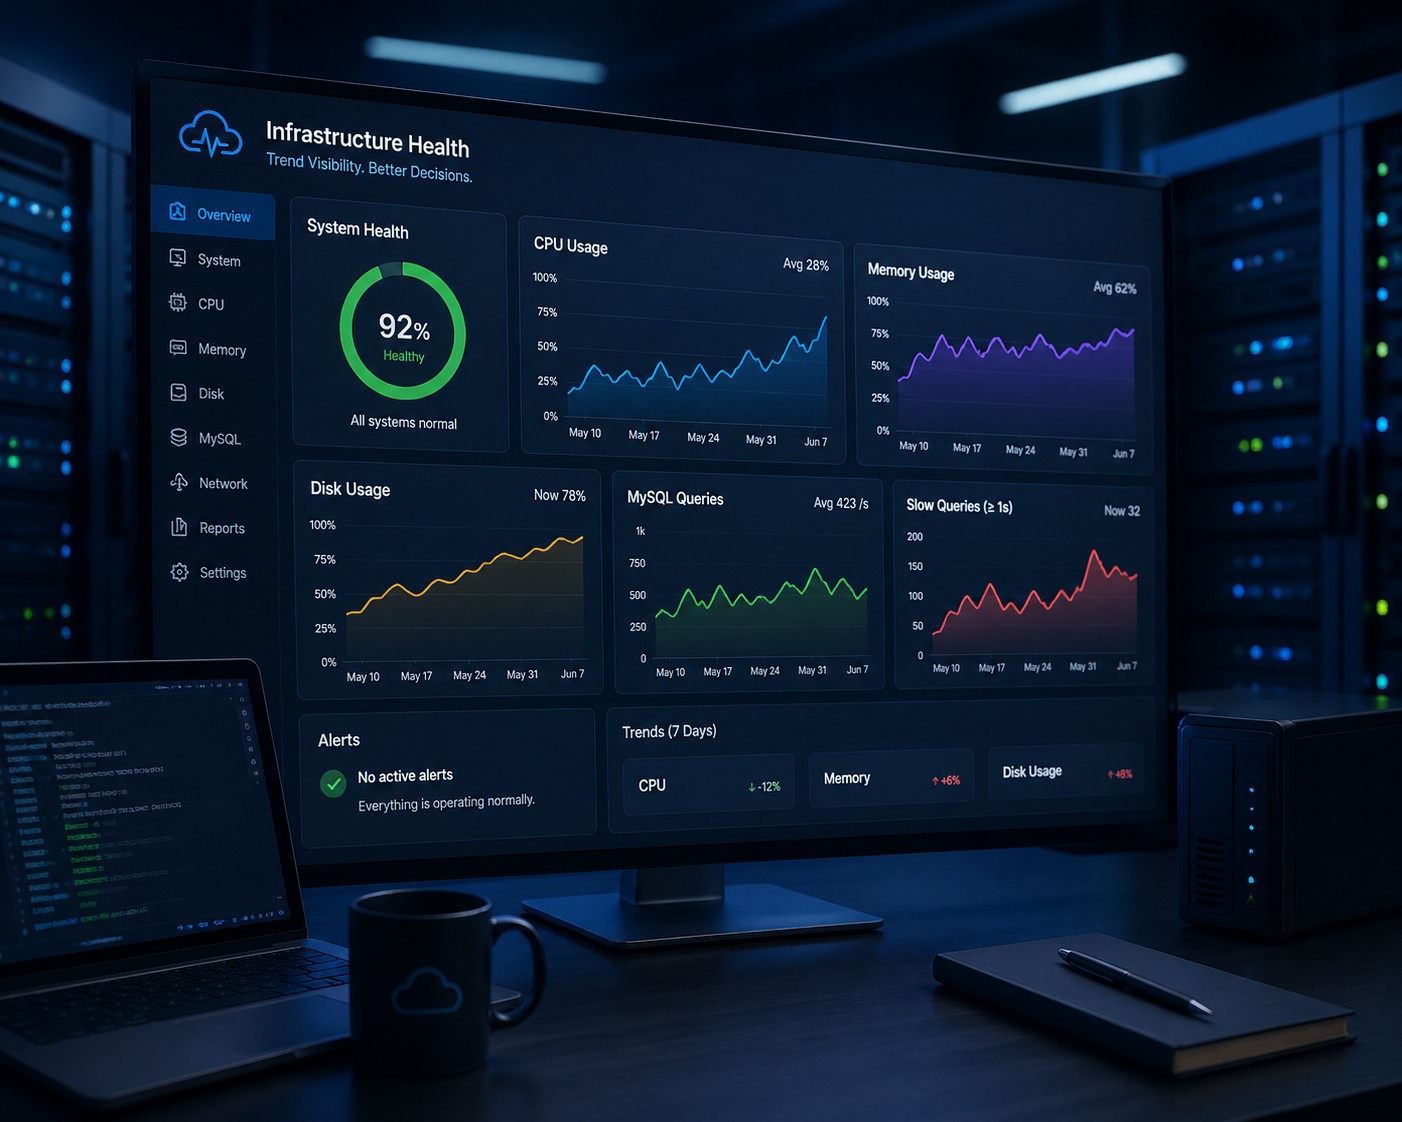
Why Trends Reduce Alert Fatigue
One of the biggest pain points in monitoring is noise.
Too many alerts. Too little context.
When you shift to trend-based health:
- You rely less on aggressive thresholds
- You focus on meaningful changes over time
- You investigate patterns, not just incidents
But this is where it matters most: you stop chasing every spike.
Instead, you focus on what’s actually changing.
How to Start Thinking in Trends
You don’t need a complex system to begin.
Start by tracking a few core metrics over time:
- CPU usage (baseline, not just peaks)
- Memory consumption patterns
- Disk growth rate
- Database query performance
Then ask simple questions:
- Is this stable?
- Is it increasing slowly?
- When will this become a problem?
This mindset alone changes how you manage infrastructure.
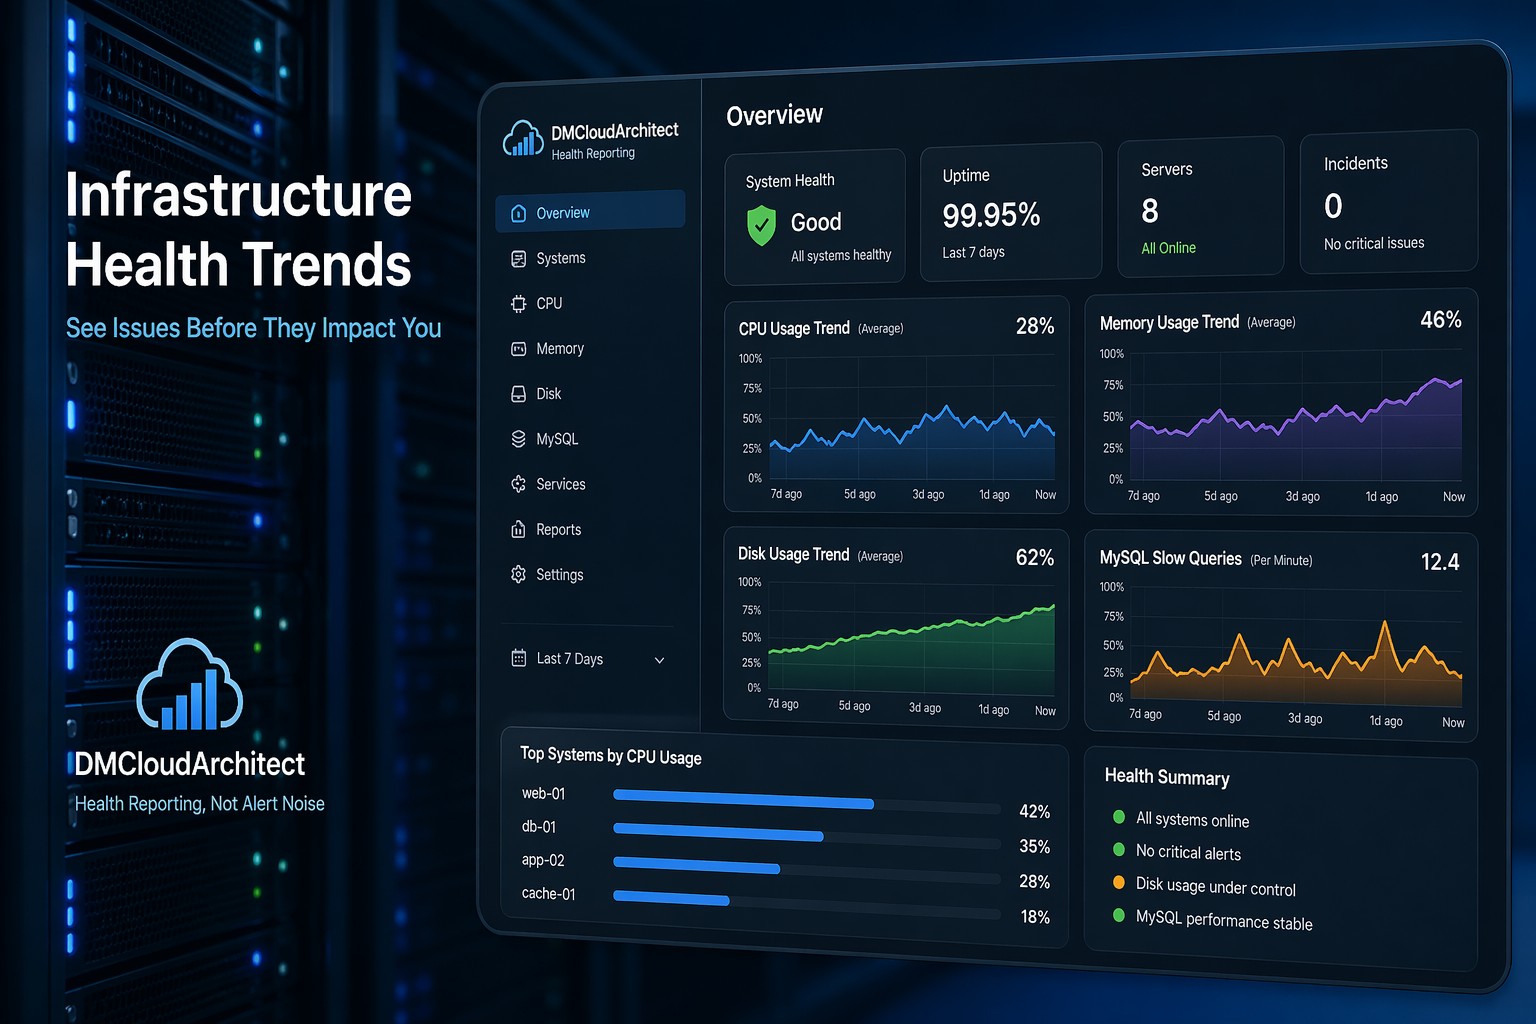
From Monitoring to Visibility
Monitoring tells you when something breaks.
Health reporting shows you how things are evolving.
One is reactive.
The other is predictive.
And for small teams especially, that difference matters.
You don’t have time to constantly respond to alerts. You need clarity, not noise.
Summary
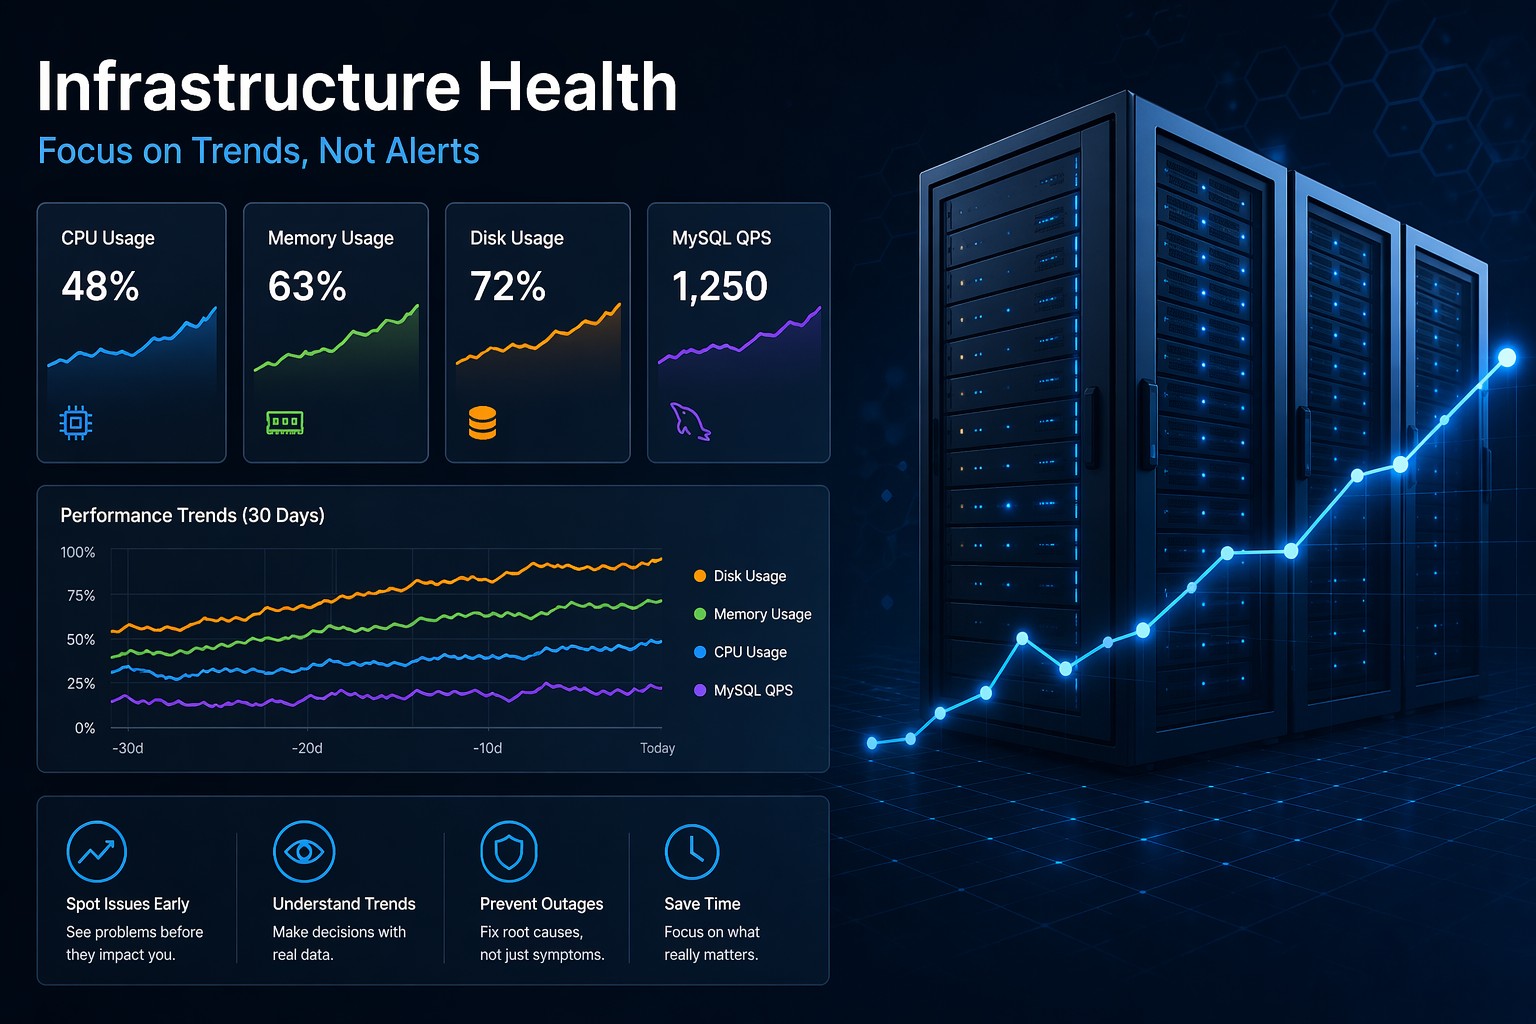
Most infrastructure issues don’t appear suddenly—they grow over time. If you only rely on alerts, you’ll always be reacting late.
By focusing on trends instead of thresholds, you gain early visibility into problems like rising CPU usage, growing disk consumption, and degrading database performance.
This approach reduces noise, improves decision-making, and helps you fix issues before they turn into outages.
If you want a simpler way to see how your systems are evolving over time, consider shifting toward health-based reporting. It’s a more practical way to manage infrastructure without getting buried in alerts.