CPU issues rarely show up all at once. More often, they creep in slowly—like a system that feels “just a bit slower” every week until something finally breaks. By the time alerts trigger, you're already dealing with degraded performance, frustrated users, or missed SLAs.
If you want to identify CPU bottleneck Linux environments early, you need to move beyond reactive monitoring and start paying attention to trends and subtle signals.
Why CPU Bottlenecks Are Hard to Spot Early
Most monitoring tools focus on thresholds. CPU hits 90%, you get an alert. But real-world degradation doesn’t work that way.
Here’s the thing—CPU performance degradation in Linux often builds over time:
- Background jobs increase gradually
- Application logic becomes less efficient
- Query load grows as your dataset expands
- More users or services compete for the same resources
None of these trigger immediate alarms. But together, they create a slow drift toward CPU saturation.
Key Signals of CPU Performance Decline
To detect CPU issues early in Linux systems, you need to look at patterns—not just spikes.
1. Rising Baseline CPU Usage
If your "idle" CPU usage used to be 10% and is now consistently 30–40%, something has changed. This is one of the earliest signs of CPU performance decline on a server.
Even if peak usage hasn’t changed, the reduced headroom means you’re closer to saturation during traffic spikes.
2. Increasing Load Average Without Traffic Growth
Load average reflects how many processes are waiting for CPU time. If this number climbs without a clear increase in workload, it's a red flag.
This usually points to inefficient processes or contention between services.
3. More Time Spent in System or I/O Wait
CPU isn’t just about user processes. If system time or iowait increases, it can indicate deeper issues:
- Kernel-level inefficiencies
- Disk bottlenecks causing CPU stalls
- Poor thread scheduling
These often appear before full CPU saturation happens.
4. Slower Response Times Without High CPU
This is where many teams get confused. The system feels slower, but CPU isn’t maxed out.
But this is where it matters—CPU contention can exist even below 100%. Processes may be waiting longer for CPU slices, causing latency without obvious spikes.
Practical Commands to Investigate CPU Bottlenecks
Once you suspect an issue, Linux gives you several tools to dig deeper.
Check Overall CPU Usage
top
htop
Look beyond total usage. Pay attention to:
- Load average vs CPU cores
- %us (user), %sy (system), %wa (iowait)
Identify CPU-Heavy Processes
ps -eo pid,ppid,cmd,%mem,%cpu --sort=-%cpu | head
This helps you find which processes are consuming the most CPU over time.
Track CPU Usage Over Time
sar -u 1 10
This is useful for capturing short-term patterns, but it’s still limited for long-term trend analysis.
Analyze Run Queue and Context Switching
vmstat 1
Focus on:
- r: number of runnable processes
- cs: context switches
A consistently high run queue is a strong signal of CPU contention.
Real-World Example: The Slow Leak Problem
Imagine a small application server running fine at 20% CPU. Over a few months, a reporting feature is added, and more users rely on it.
CPU usage slowly increases:
- Month 1: 25%
- Month 2: 35%
- Month 3: 50%
No alerts fire. Everything seems “fine.”
But then one day, a traffic spike pushes CPU to 95%, and suddenly everything slows down.
So what happened?
The issue wasn’t the spike—it was the unnoticed trend leading up to it. This is a classic case of CPU saturation warning signs being ignored because they didn’t cross thresholds.
Why Trend-Based Monitoring Changes Everything
Most teams rely on real-time metrics. But CPU bottlenecks are often about gradual change, not sudden failure.
When you track trends over time, you can:
- See baseline shifts in CPU usage
- Detect performance degradation early
- Understand how workload changes impact resources
- Plan scaling before problems occur
This shifts your approach from reactive firefighting to proactive system health management.
How to Think About CPU Health in Practice
Instead of asking "Is CPU high right now?", ask:
- Is CPU usage trending upward over weeks?
- Is available headroom shrinking?
- Are workloads becoming less efficient?
So what does this mean in practice?
You start treating CPU like a resource that degrades gradually—not something that fails instantly.
Summary
To identify CPU bottleneck Linux systems effectively, you need to look beyond spikes and focus on patterns. Rising baselines, increasing load averages, and subtle shifts in CPU behavior often tell the real story.
If you rely only on alerts, you’ll always be reacting late. But when you track trends and understand how performance evolves, you can catch issues early and avoid production impact.
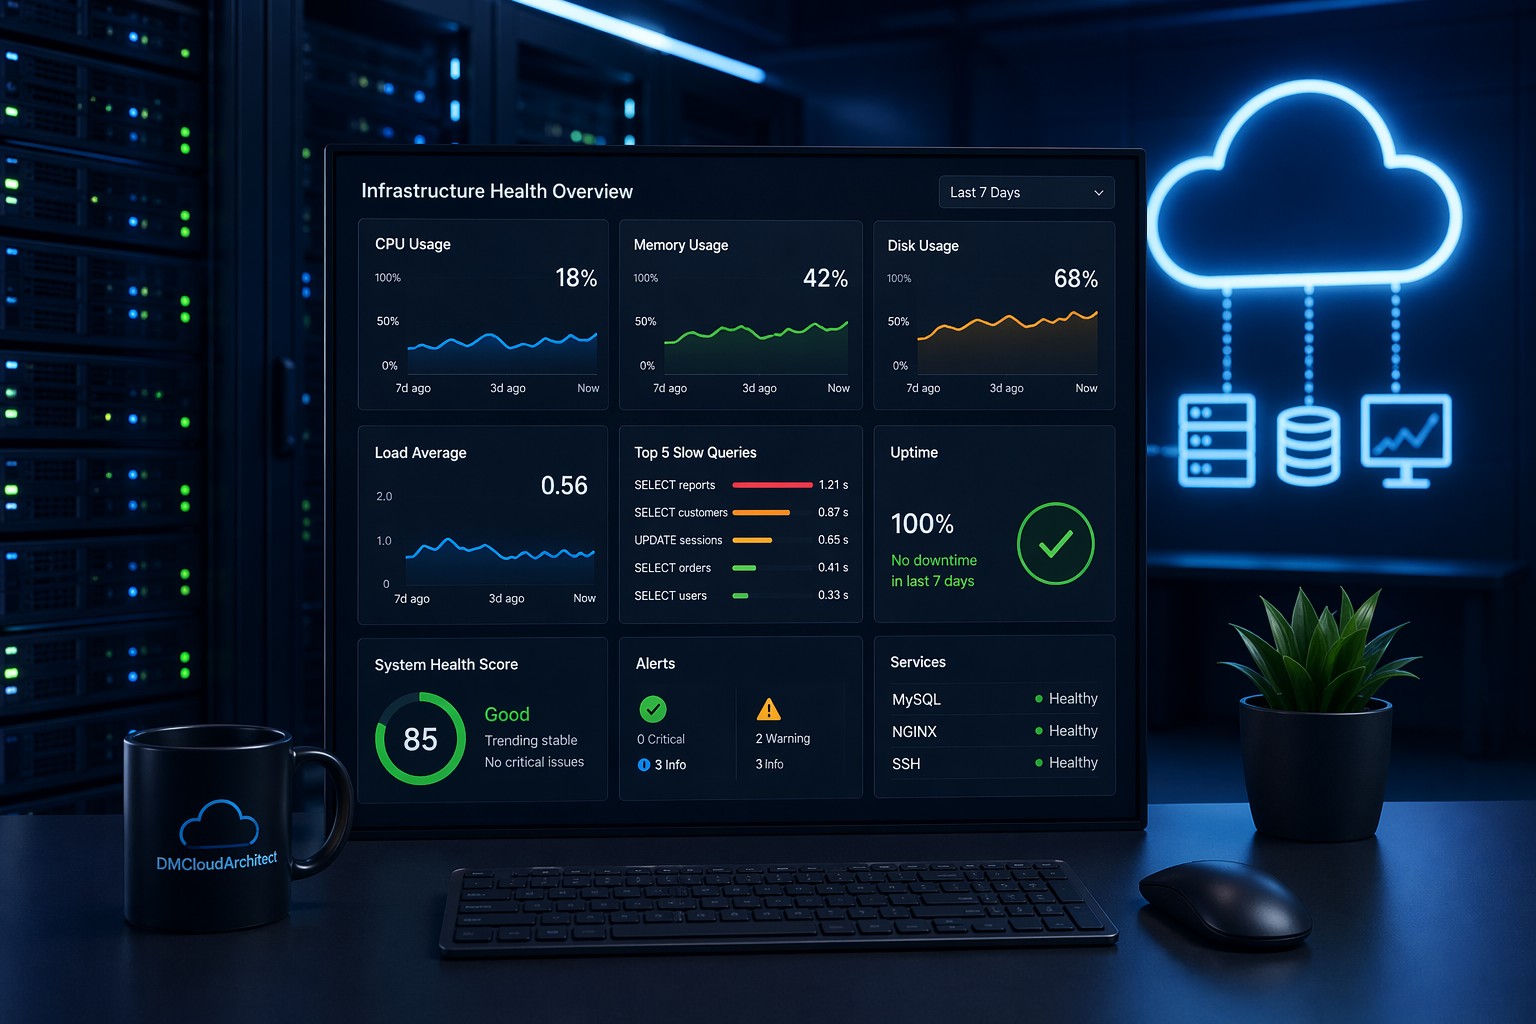
If you want a clearer, long-term view of how your infrastructure behaves, take a look at Infrastructure Health Reporting and see how trend-based insights can help you stay ahead of CPU bottlenecks.