Most teams only notice slow queries when something breaks. A page loads too slowly, an API times out, or CPU suddenly spikes. At that point, you're already reacting.
Here’s the thing—slow queries rarely appear out of nowhere. They grow gradually. A query that took 50ms last month might now take 300ms, and no one notices until it starts impacting users.
This is where understanding mysql slow query trends becomes far more valuable than simply logging individual slow queries.
Why Slow Query Trends Matter More Than Alerts
Traditional mysql slow query monitoring focuses on capturing queries that exceed a threshold. While that’s useful, it doesn’t tell you how performance is evolving.
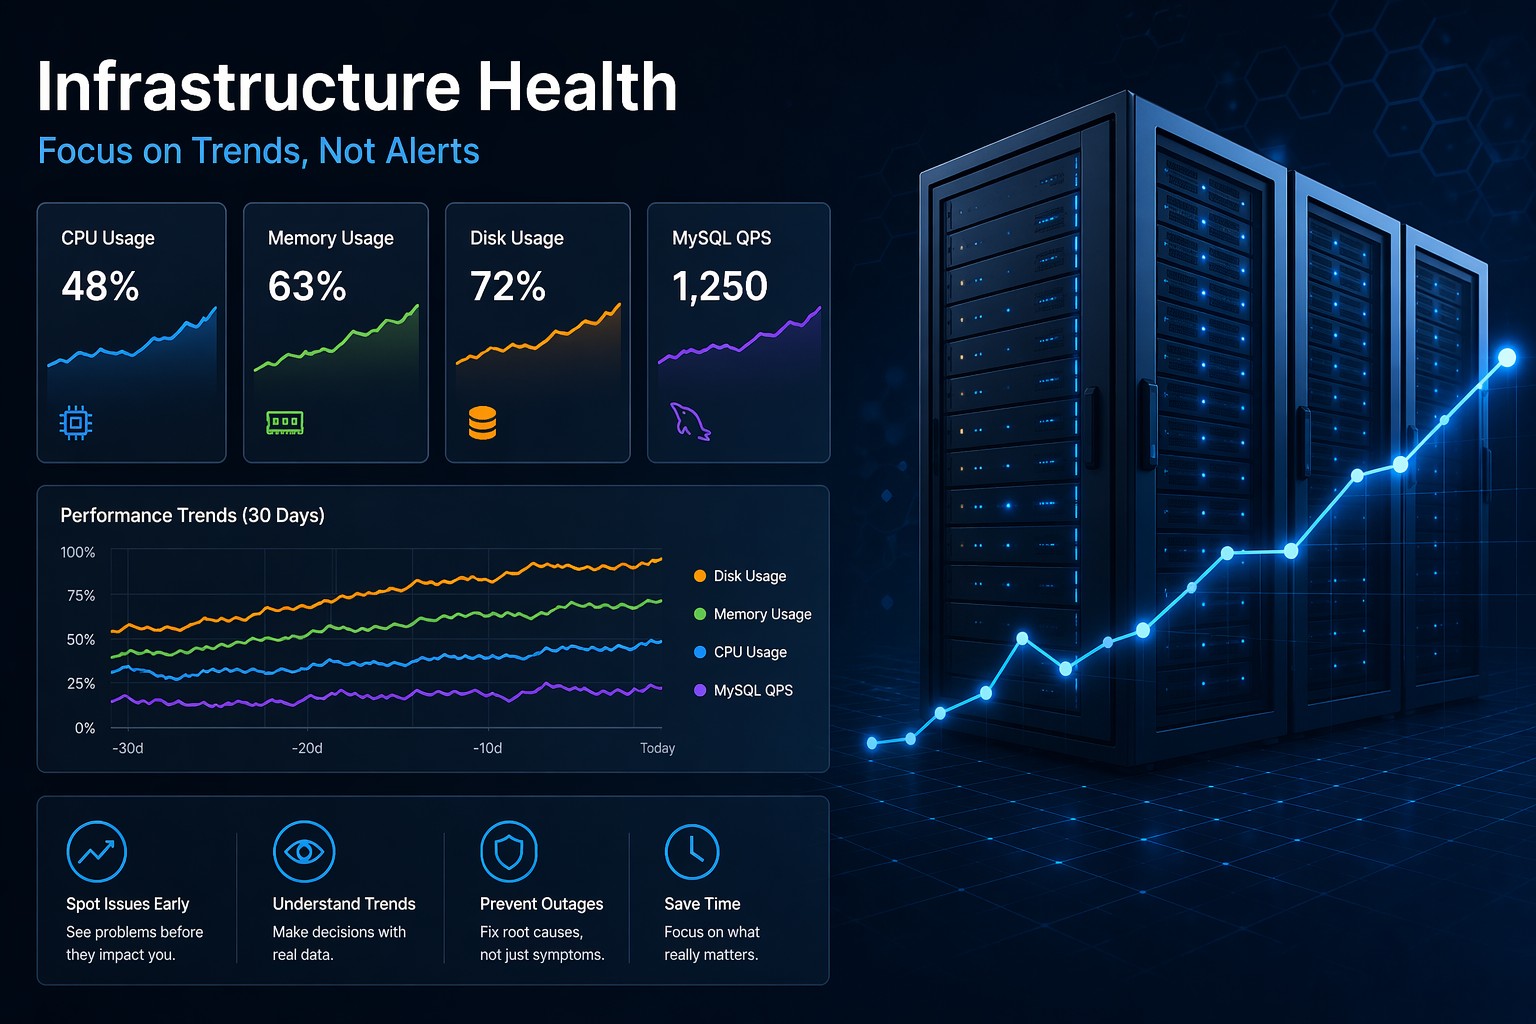
But this is where it matters—trend data shows direction.
- Are slow queries increasing week over week?
- Is execution time gradually creeping up?
- Are specific queries becoming more expensive over time?
Without this context, you’re always reacting instead of preventing issues.
What MySQL Slow Query Trends Actually Show
When you analyze trends instead of raw logs, you start to see patterns across your database workload.
1. Growth in Slow Query Volume
If the number of slow queries increases steadily, it often indicates:
- Data growth affecting indexes
- Queries that no longer scale
- Missing optimizations as usage increases
2. Increasing Query Execution Time
A query that was once fast may degrade over time. This usually happens due to:
- Larger datasets
- Outdated execution plans
- Fragmented indexes
3. Recurring Performance Patterns
Trend-based mysql slow query analysis helps you spot recurring issues, like:
- Nightly batch jobs causing spikes
- Weekly reporting queries slowing the system
- Traffic-related slowdowns during peak hours
How to Detect Slow Queries in MySQL (Properly)
Most setups rely on the slow query log:
slow_query_log = 1
long_query_time = 1
log_queries_not_using_indexes = 1
This is a good starting point, but raw logs alone aren’t enough for meaningful insights.
To actually detect slow queries in mysql effectively, you need to aggregate and analyze them over time.
Key Metrics to Track
- Total slow queries per hour/day
- Average query execution time
- 95th percentile latency
- Top slow queries by frequency
- Top slow queries by total execution time
These metrics turn raw logs into actionable signals.
Real-World Example: The Slow Creep Problem
Imagine a production database handling an e-commerce platform.
At first, everything looks fine. Queries are fast, and there are no alerts.
But over time:
- Product catalog grows
- Indexes become less efficient
- A reporting query starts scanning more rows
Each change is small. Nothing triggers an alert.
But over a few weeks, the same query goes from 80ms to 600ms.
Now multiply that across hundreds of requests.
Suddenly, you’re dealing with noticeable latency and rising CPU usage.
This is exactly the kind of issue that slow query reporting mysql trend analysis would have exposed early.
From Logs to Insights: Building a Trend-Based View
Instead of reviewing logs manually, you want a system that summarizes performance over time.
What That Looks Like in Practice
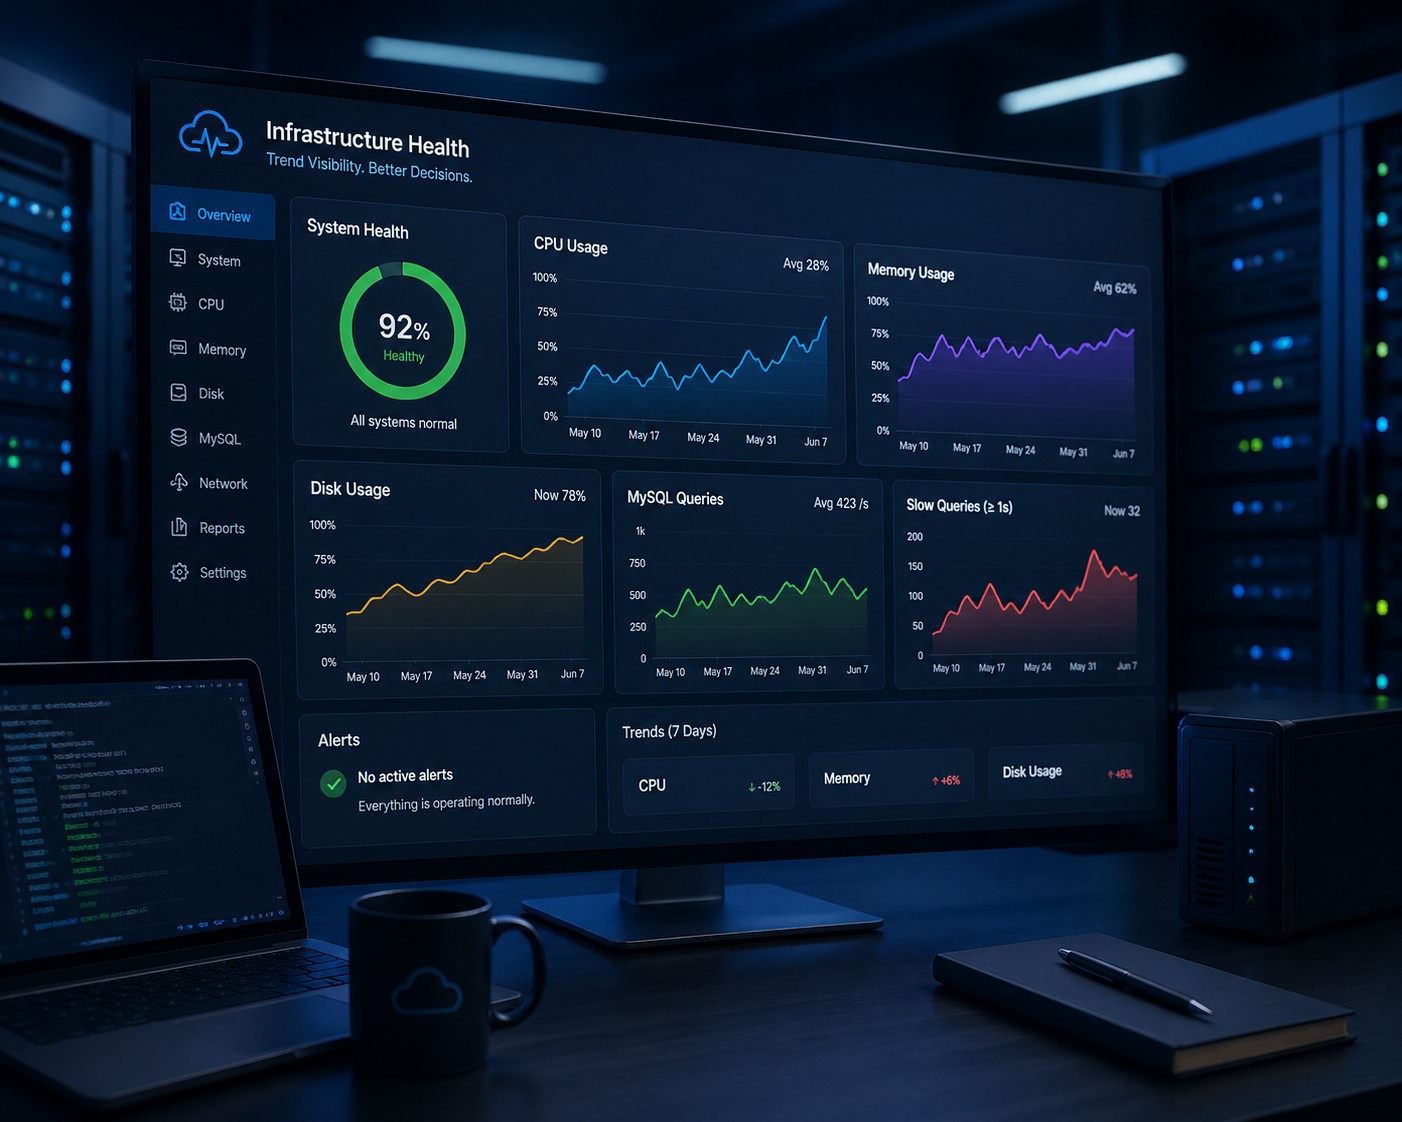
- Daily slow query counts plotted over time
- Top queries tracked week by week
- Execution time trends for critical queries
- Correlation with CPU and disk usage
So what does this mean in practice?
You can answer questions like:
- "When did performance start degrading?"
- "Which query is responsible for the trend?"
- "Is this getting worse or stabilizing?"
Common Causes Behind MySQL Query Performance Issues
Trend data often leads you back to a few common root causes:
- Missing or inefficient indexes
- Growing table sizes
- Unoptimized joins
- Inefficient application queries
- Schema design limitations
The key difference is timing—you discover these before they become outages.
Why Small Teams Struggle With This
Most small infrastructure teams don’t lack data. They lack visibility.
Logs exist. Metrics exist. But they’re scattered.
And reviewing slow query logs manually doesn’t scale.
This leads to a familiar pattern:
- Ignore slow queries until users complain
- Fix issues under pressure
- Repeat the cycle
Trend-based monitoring breaks this cycle by making performance changes visible early.
Summary
MySQL performance issues rarely happen suddenly. They build slowly, like a leak that gets worse over time.
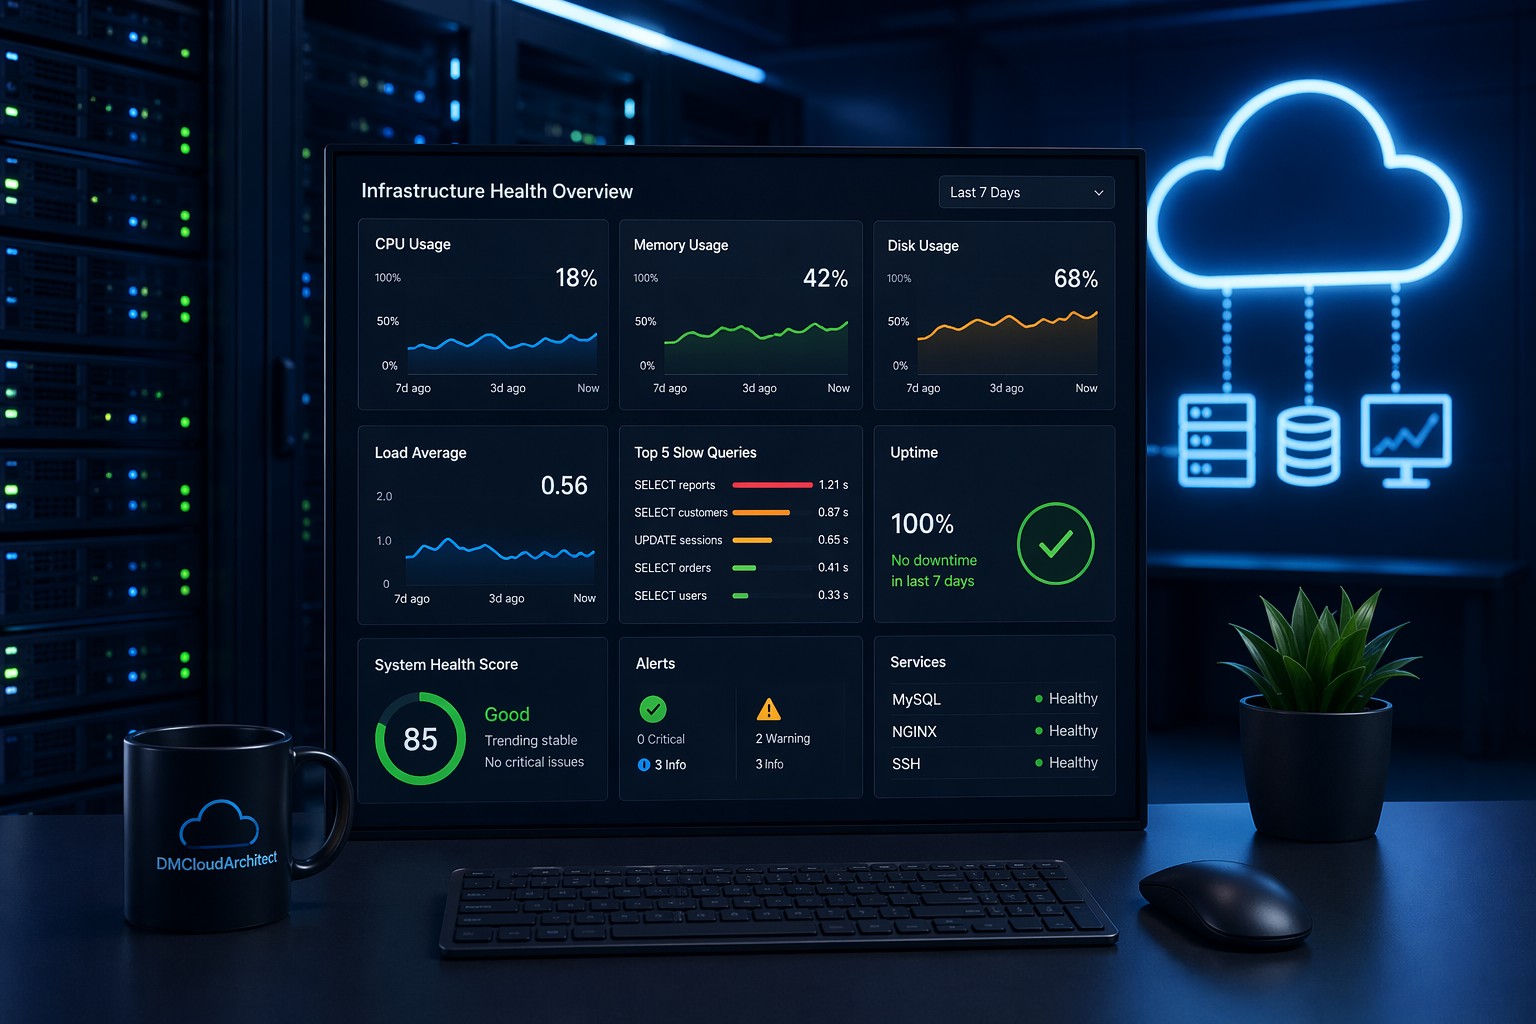
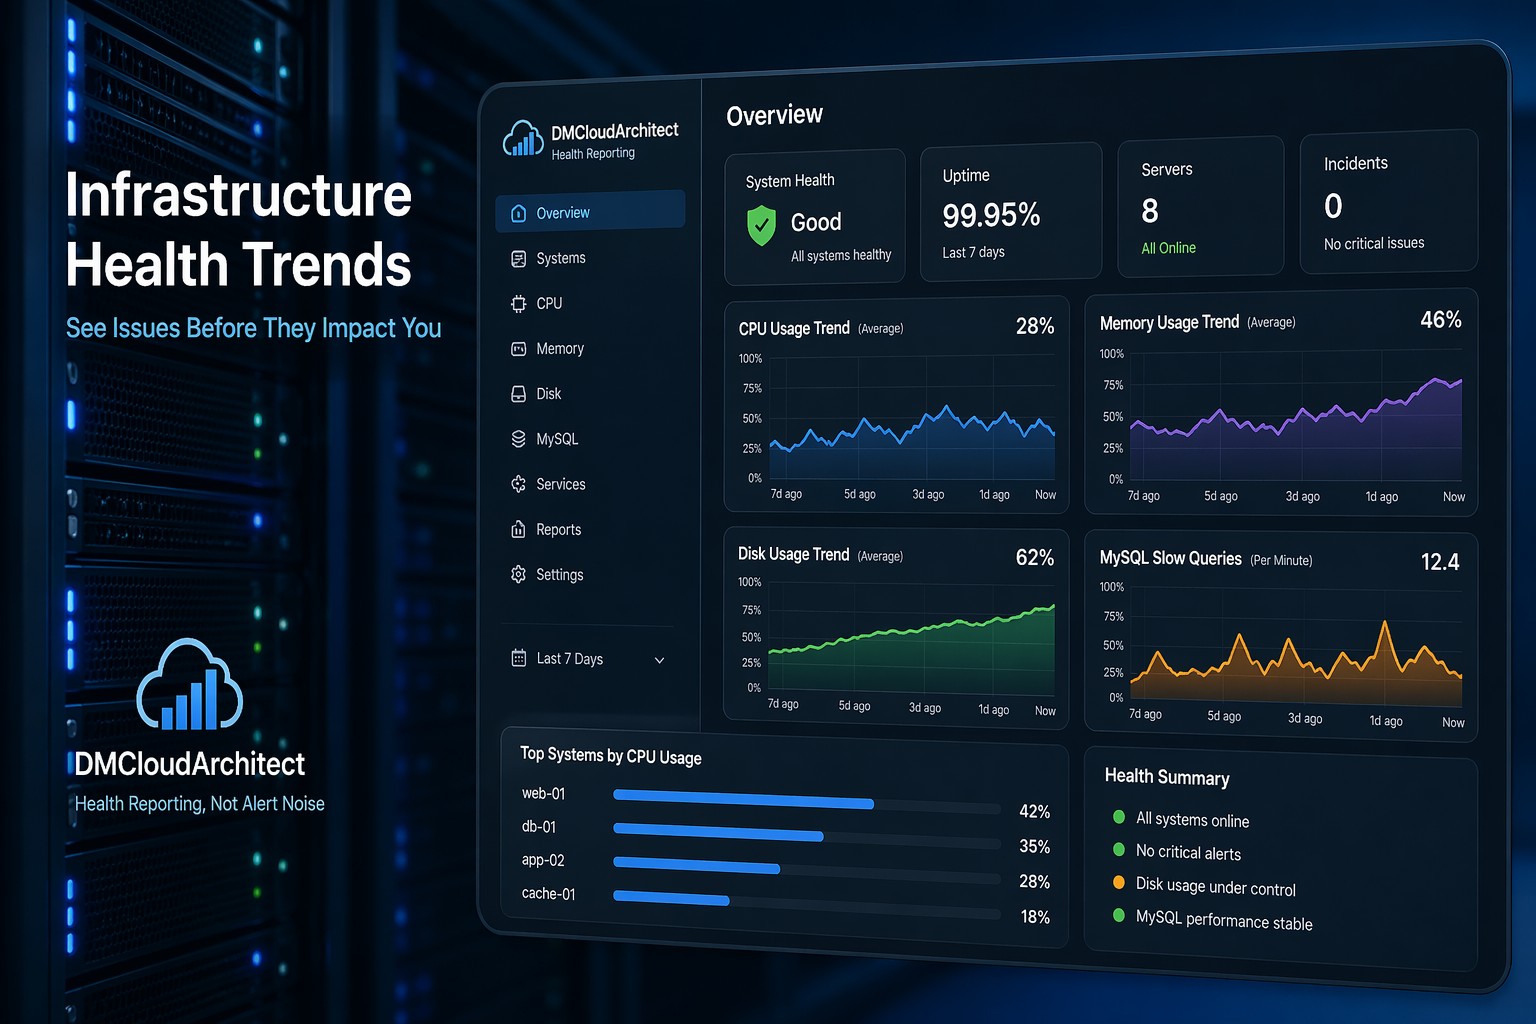
Tracking mysql slow query trends gives you the visibility to catch these problems early, understand their progression, and fix them before they impact users.
If you want a clearer, less noisy way to understand how your database health evolves over time, take a look at Infrastructure Health Reporting. It focuses on trends instead of alerts, helping you see issues long before they become incidents.