MySQL rarely becomes slow overnight. In most real environments, performance issues build gradually—queries take slightly longer, CPU usage creeps up, and what used to feel instant starts lagging just enough to frustrate users.
Here’s the thing… by the time alerts fire or complaints start coming in, the problem has usually been growing for weeks. Understanding why MySQL slow performance over time happens is the difference between reacting late and staying ahead of it.
Why MySQL Slows Down Gradually
Performance degradation in MySQL is often subtle. It’s not a single failure—it’s a trend.
- Growing datasets increasing query cost
- Indexes becoming less effective over time
- Workload changes (more users, more queries)
- Slow queries accumulating silently
- Fragmentation and inefficient storage patterns
Individually, these don’t cause immediate issues. But combined, they create a steady decline.
What This Looks Like in Practice
Imagine a production database handling customer orders.
At first, queries run in milliseconds. Over a few months:
- Table size doubles
- Indexes are no longer optimal
- New features introduce heavier joins
- Background jobs increase query load
No alerts fire because nothing “breaks.” But average response time increases from 50ms to 300ms. Then to 800ms. Eventually, users notice.
But this is where it matters… the issue wasn’t the spike. It was the trend.
Key MySQL Performance Trends to Watch
If you want to catch problems early, you need to track how things change over time—not just current values.
1. Query Execution Time Trends
Look at average and percentile query times over days or weeks. A slow upward trend is an early warning sign.
2. Slow Query Volume
The number of slow queries often grows gradually. Even a small increase per day compounds quickly.
3. CPU and I/O Usage
Rising CPU or disk I/O without a clear workload change usually signals inefficiency.
4. Connections and Throughput
Increasing connections or queries per second can expose bottlenecks that weren’t visible before.
5. Buffer Pool Efficiency
If your InnoDB buffer pool hit rate drops over time, disk reads increase—and performance follows.
Why Traditional Monitoring Misses This
Most monitoring tools focus on real-time alerts:
- CPU above 90%
- Disk full
- Query time exceeding threshold
But slow degradation doesn’t cross thresholds immediately. It lives below the alert line.
So what happens? You get no alerts… until the system is already struggling.
How to Approach MySQL Trend Monitoring
Instead of asking “Is it slow right now?”, shift to “How has it changed?”
Track Historical Metrics
Collect and retain metrics over time:
- Query execution times
- Slow query counts
- CPU and memory usage
- Disk I/O patterns
Compare Week Over Week
Look for gradual increases rather than spikes. Even a 5–10% weekly increase can become a serious issue.
Correlate Changes
When performance shifts, connect it to:
- Deployments
- Schema changes
- Traffic growth
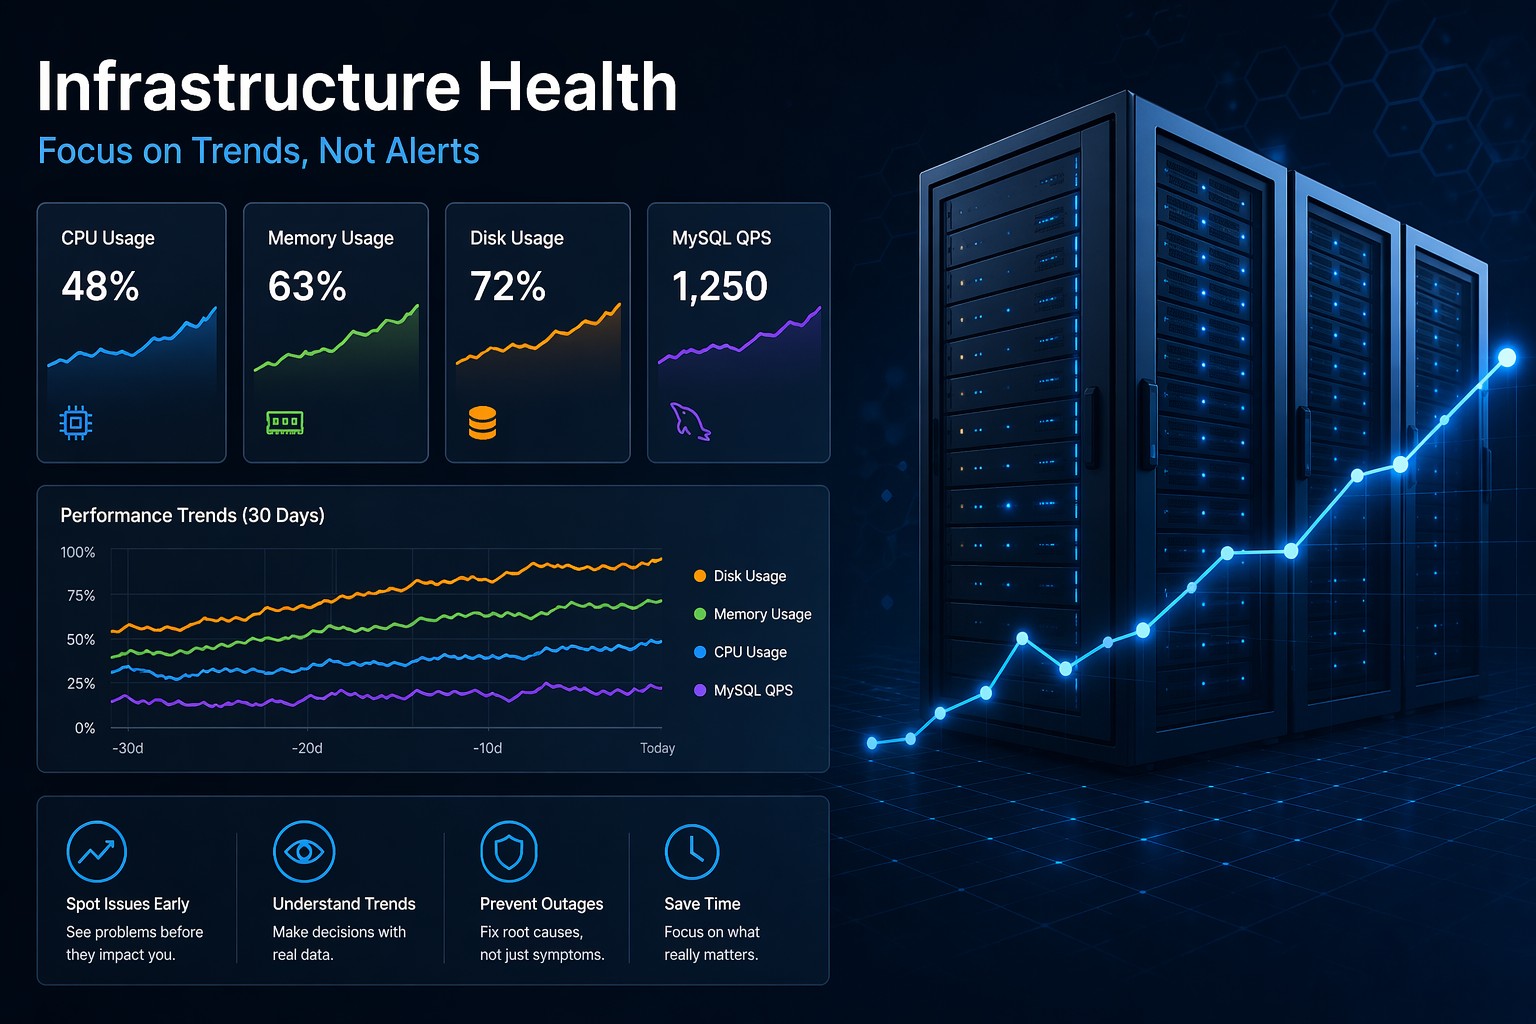
Focus on Trends, Not Noise
You don’t need hundreds of alerts. You need clear visibility into how your system evolves.
Real-World Scenario
A small SaaS team noticed their application felt “a bit slower” over time. Nothing critical.
After reviewing trends:
- Slow queries increased 3x over two months
- Average query time doubled
- Disk reads steadily climbed
The root cause? A reporting feature added heavy queries that weren’t optimized for growing data.
Fixing indexes and optimizing queries restored performance—but only after weeks of unnoticed degradation.
How to Prevent Performance Degradation
- Regularly review slow query logs
- Re-evaluate indexes as data grows
- Monitor workload changes
- Track long-term performance metrics
- Plan capacity before bottlenecks appear
So what does this mean in practice? You’re not just maintaining performance—you’re managing its direction.
Summary
MySQL slow performance over time is rarely a sudden failure. It’s a gradual shift caused by growing data, evolving workloads, and unnoticed inefficiencies.
If you only rely on alerts, you’ll always be late. But if you focus on trends, you can see problems forming long before they impact users.
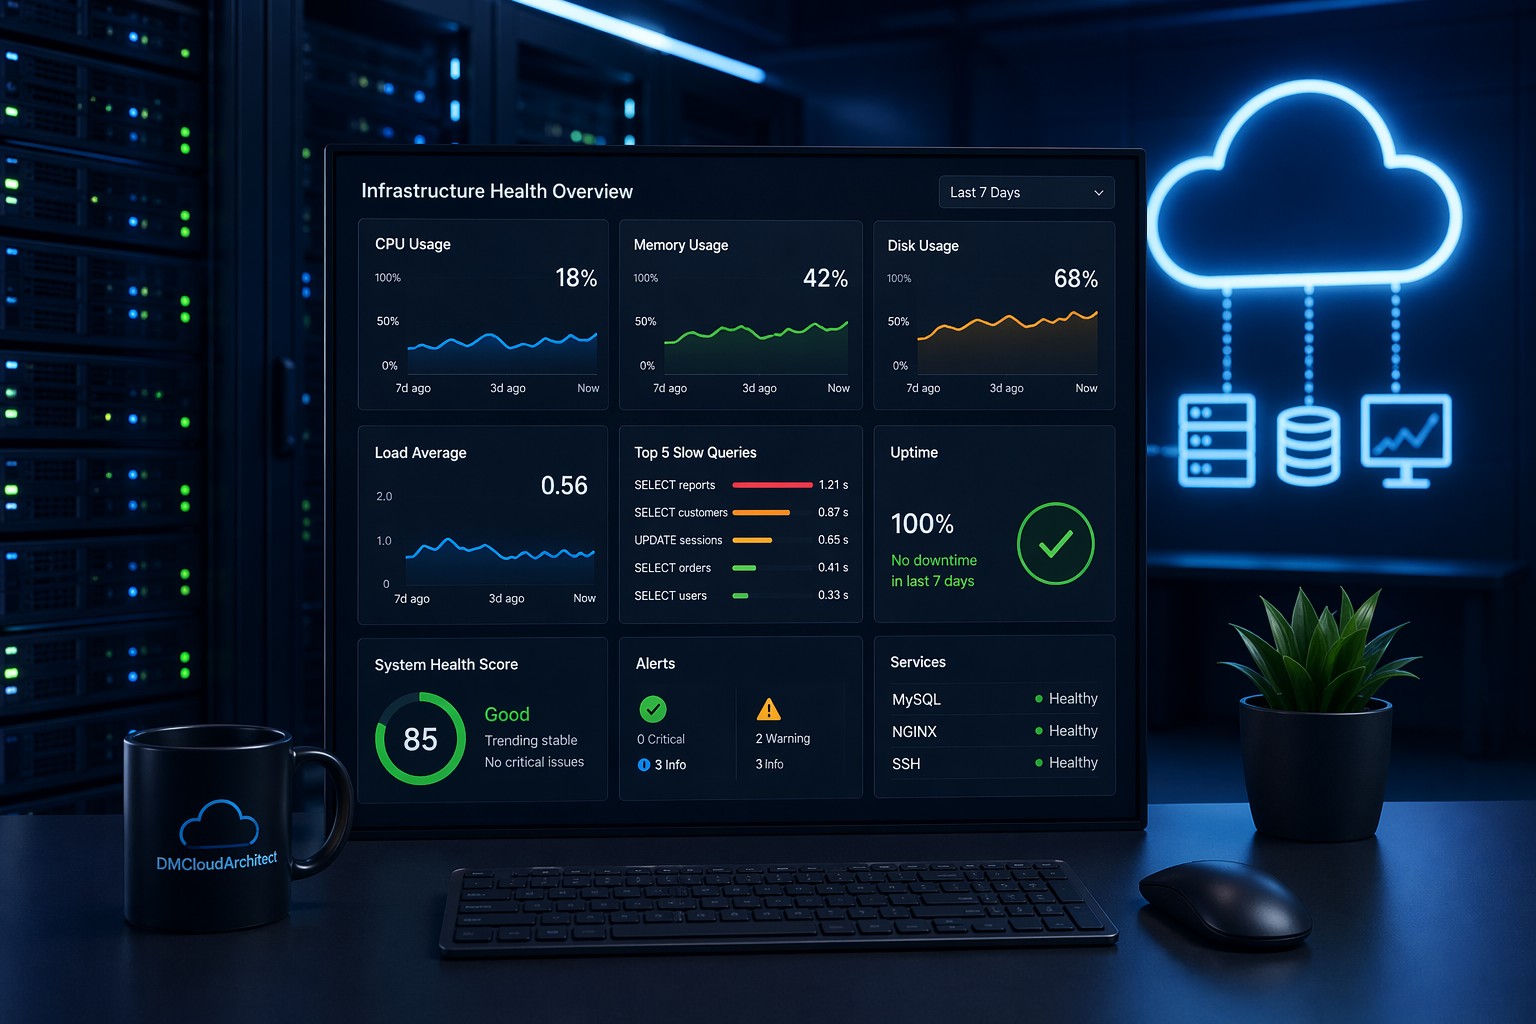
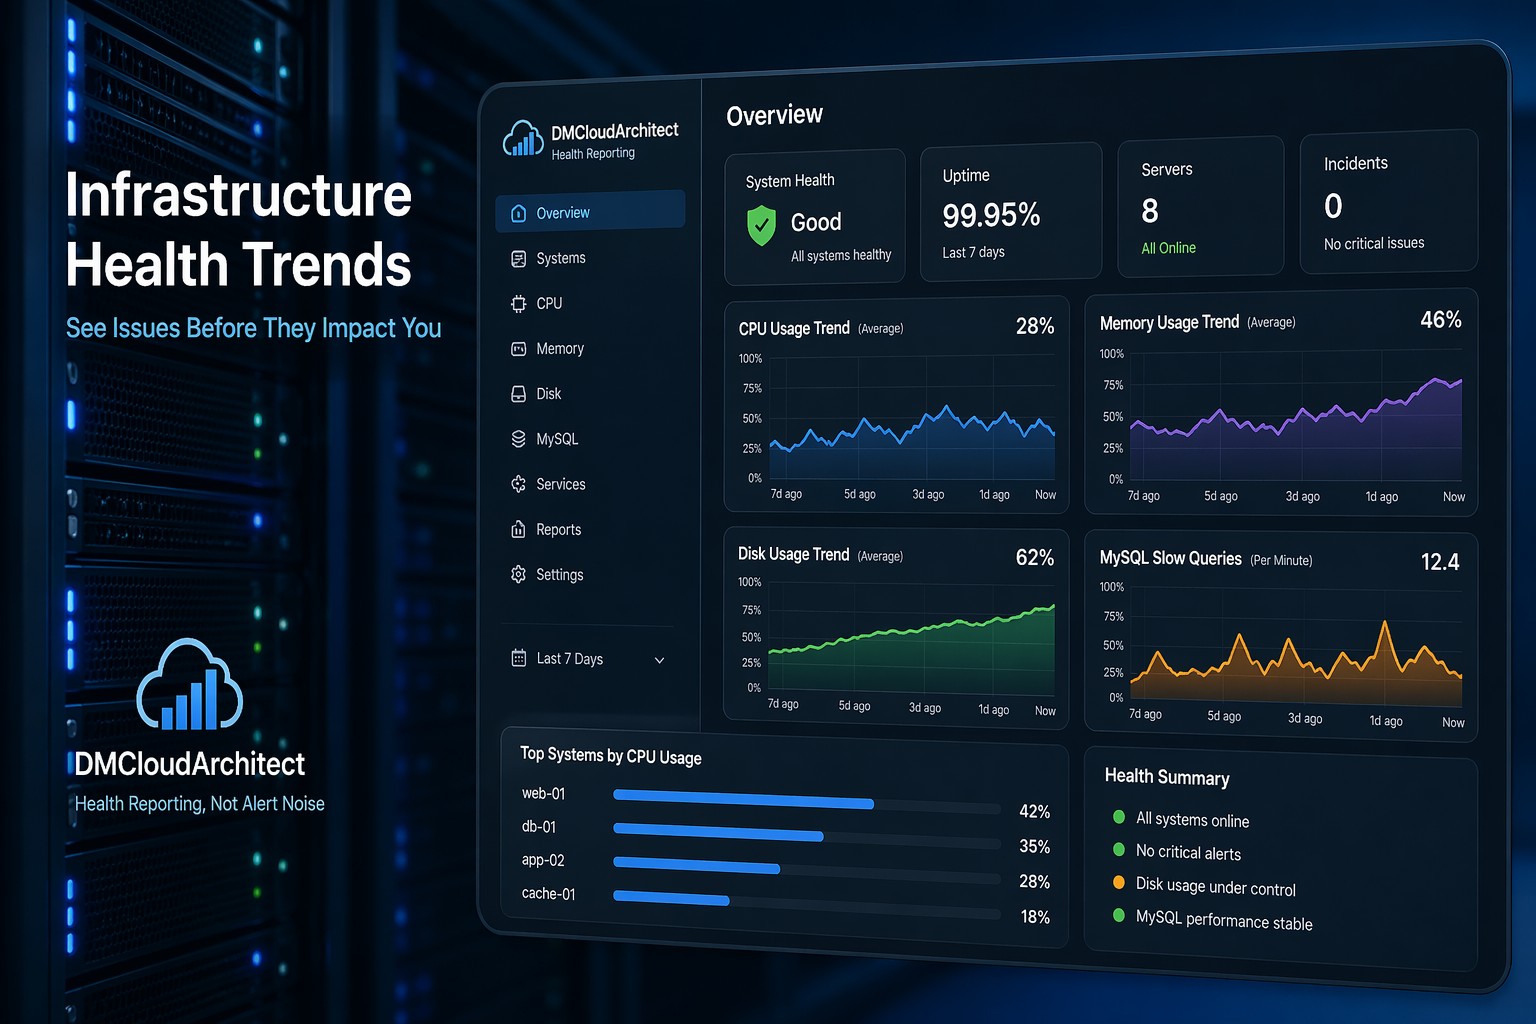
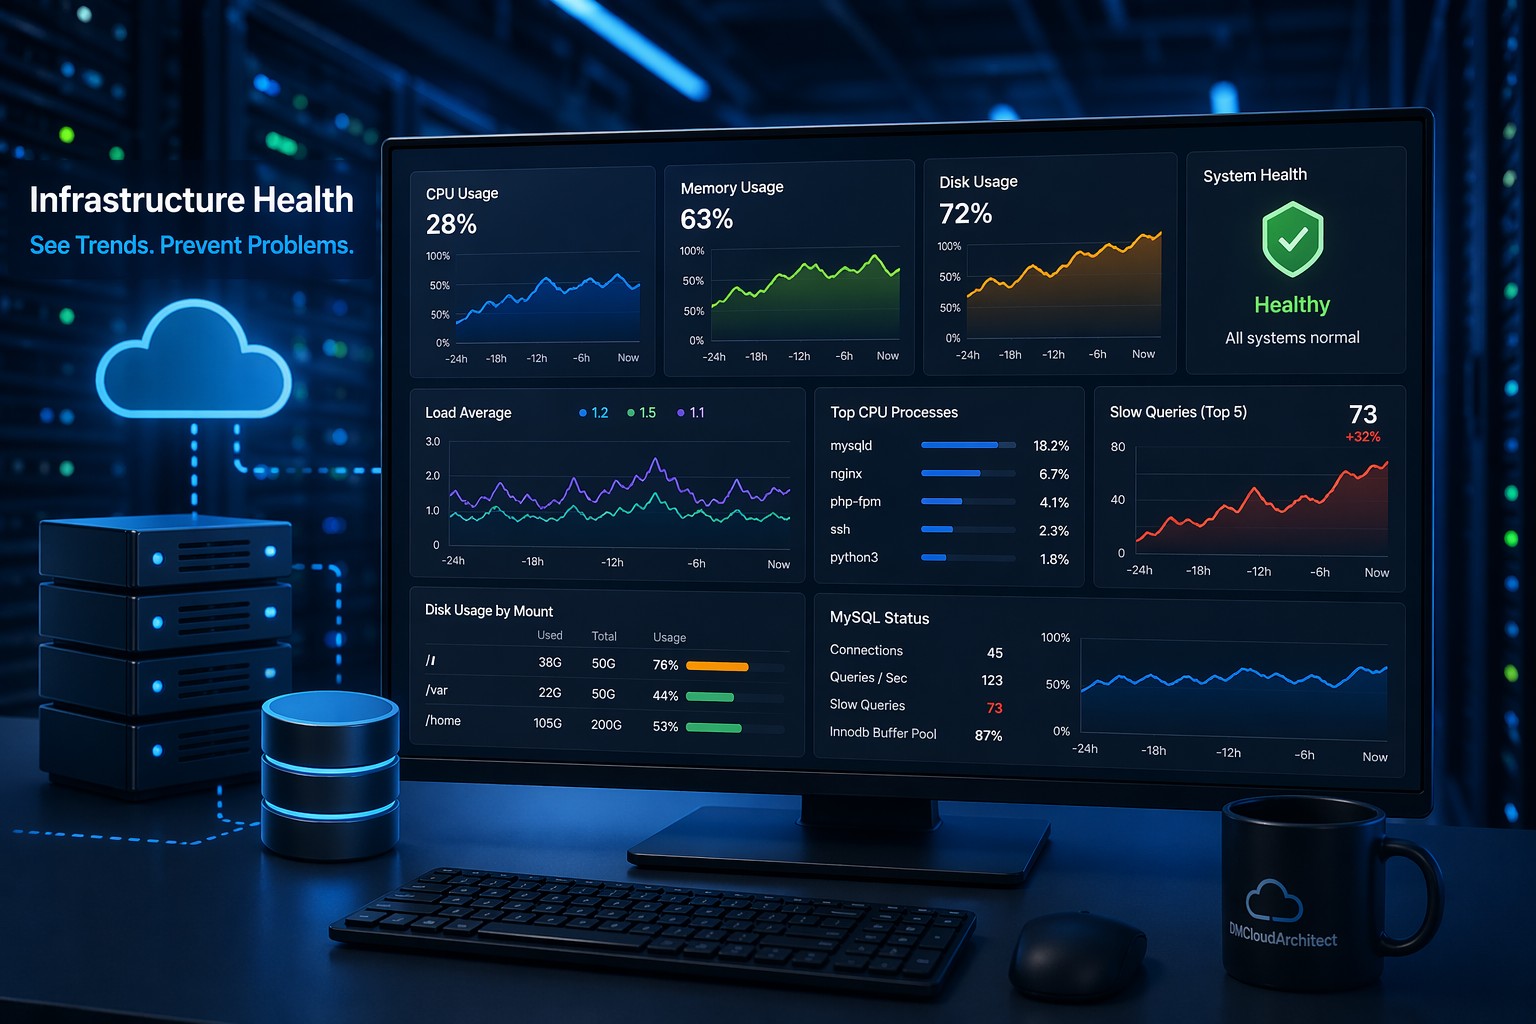
If you want a clearer way to track these patterns without adding more noise, take a look at Infrastructure Health Reporting. It’s designed to show how your systems change over time—so you can fix issues before they become outages.