Most teams don’t realize their CPU problems until users start complaining. By then, the spike is already happening—or worse, it’s been building quietly for days.
If you’ve ever wondered how to monitor CPU usage in Linux without adding another heavy tool, a simple bash cpu monitoring script can give you exactly what you need. Not alerts, not noise—just clear visibility into what your system is doing over time.
Here’s how to build one that actually helps you understand trends, not just react to problems.
Why Simple CPU Monitoring Still Matters
Modern observability tools are powerful, but they often come with complexity and constant alerts. For smaller teams or single-server setups, that can quickly turn into alert fatigue.
But this is where it matters: CPU issues are rarely instant. They usually grow slowly—like a background job getting heavier, or traffic increasing over time.
A lightweight script lets you capture that growth without overcomplicating your setup.
What We’re Building
We’re going to create a cpu monitoring script linux users can run via cron. It will:
- Capture CPU usage at intervals
- Store results in a simple log file
- Let you review trends over time
No external tools. Just bash and standard Linux utilities.
Step 1: Understanding CPU Usage in Linux
CPU usage is typically derived from /proc/stat. It provides cumulative values for CPU time spent in different states.
We calculate usage by comparing two snapshots over time.
Quick Example
grep 'cpu ' /proc/statThis returns values like user time, system time, idle time, and more.
Step 2: Create the Bash CPU Monitoring Script
Here’s a simple script that calculates CPU usage percentage:
#!/bin/bash

LOG_FILE="/var/log/cpu_usage.log"

read cpu user nice system idle iowait irq softirq steal guest < /proc/stat
prev_idle=$idle
prev_total=$((user + nice + system + idle + iowait + irq + softirq + steal))

sleep 1

read cpu user nice system idle iowait irq softirq steal guest < /proc/stat
idle_diff=$((idle - prev_idle))
total_diff=$((user + nice + system + idle + iowait + irq + softirq + steal - prev_total))

cpu_usage=$((100 * (total_diff - idle_diff) / total_diff))

echo "$(date '+%Y-%m-%d %H:%M:%S') CPU: ${cpu_usage}%" >> $LOG_FILE
This script measures CPU usage over a one-second interval and appends it to a log file.
Step 3: Automate with Cron
To turn this into a continuous monitoring system, schedule it with cron.
crontab -eAdd a job like this:
*/5 * * * * /path/to/cpu_monitor.shThis runs the script every 5 minutes. Over time, you’ll build a dataset of CPU usage.
Step 4: Reading the Data
Your log file will look like this:
2026-04-21 10:00:01 CPU: 12%
2026-04-21 10:05:01 CPU: 18%
2026-04-21 10:10:01 CPU: 35%
At first glance, this seems basic. But over hours or days, patterns start to appear.
Real-World Example
Imagine a background job that runs every hour. Initially, CPU usage spikes briefly. But over time, the spikes get higher and longer.
Without trend data, you’d only notice when it hits 90% and triggers alerts.
With this script, you see the gradual increase—like a slow leak—before it becomes critical.
Step 5: Making It More Useful
You can extend this simple cpu monitoring without tools setup in a few ways:
- Track load average: Add
uptimeoutput - Log per-core stats: Parse additional CPU lines
- Rotate logs: Prevent large files
- Export to CSV: Easier analysis
Even small improvements can turn this into a practical visibility tool.
When This Approach Works Best
This kind of simple cpu monitoring linux setup is ideal when:
- You don’t want another monitoring agent
- You’re debugging performance issues
- You need historical visibility, not just alerts
- You’re running small or cost-sensitive infrastructure
It’s not a replacement for full observability—but it solves a very specific problem well.
Summary
A bash cpu monitoring script gives you a lightweight way to understand how your system behaves over time. Instead of reacting to spikes, you start seeing patterns.
And that changes how you manage infrastructure. You stop chasing alerts and start spotting trends early.
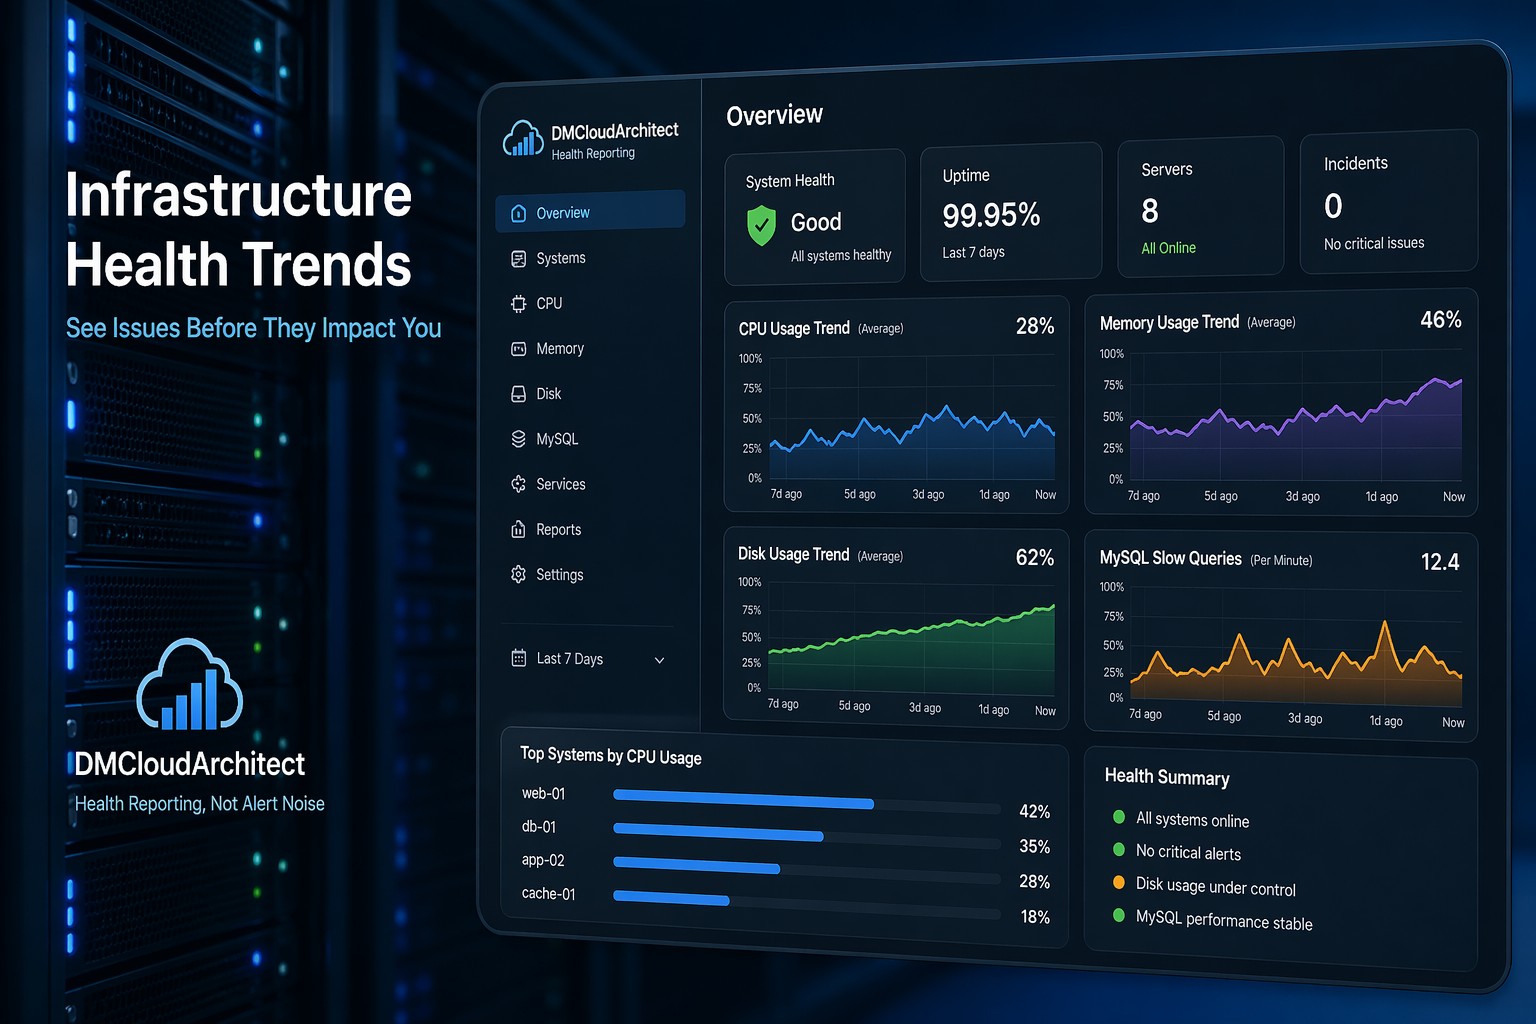
If you want to take this further and turn raw metrics into clear, actionable insights, explore Infrastructure Health Reporting. It’s built around the same idea—less noise, more visibility.