Most Linux servers do not fail suddenly. Problems usually build slowly over time. CPU usage creeps upward week after week. Disk usage grows a little every day. MySQL queries become slightly slower until applications start feeling unstable.
That is why many small teams start looking for a minimal linux monitoring setup instead of deploying large observability platforms. They want visibility into system health without maintaining a complicated stack filled with exporters, dashboards, and noisy alerts.
Here’s the thing: lightweight monitoring is often enough when your goal is operational awareness instead of enterprise-scale telemetry. A simple setup can help you spot trends early, reduce alert fatigue, and keep infrastructure manageable.
Why Many Teams Want Simpler Linux Monitoring
Modern monitoring platforms are powerful, but they also introduce complexity. Tools like Prometheus and Grafana can provide deep visibility, yet they often require additional infrastructure, ongoing tuning, and time to maintain.
For a small business or a lean operations team, that overhead may not be practical.
In many environments, teams only need answers to a few important questions:
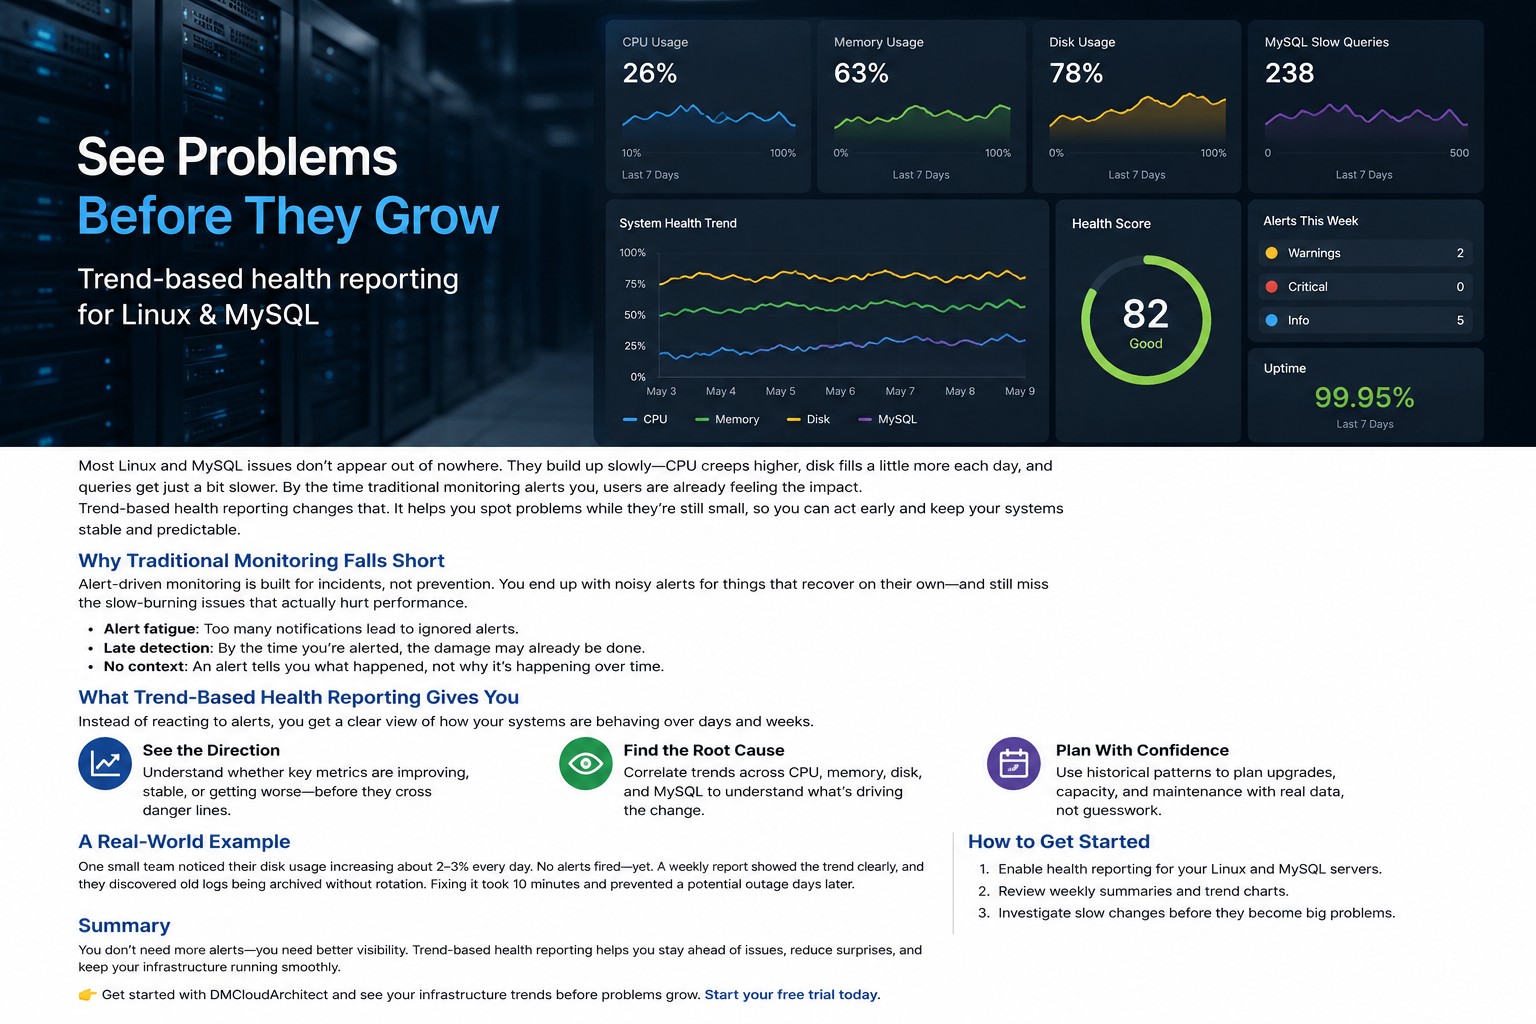
- Is CPU usage gradually increasing?
- Are disks filling faster than expected?
- Is memory pressure becoming more frequent?
- Are MySQL slow queries growing over time?
- Has server stability changed this month?
A simple linux monitoring solution focused on long-term trends can answer those questions without turning monitoring into a full-time job.
What a Minimal Linux Monitoring Setup Should Include
A lightweight linux monitoring tool does not need hundreds of metrics. The goal is clarity, not metric overload.
A practical setup usually tracks:
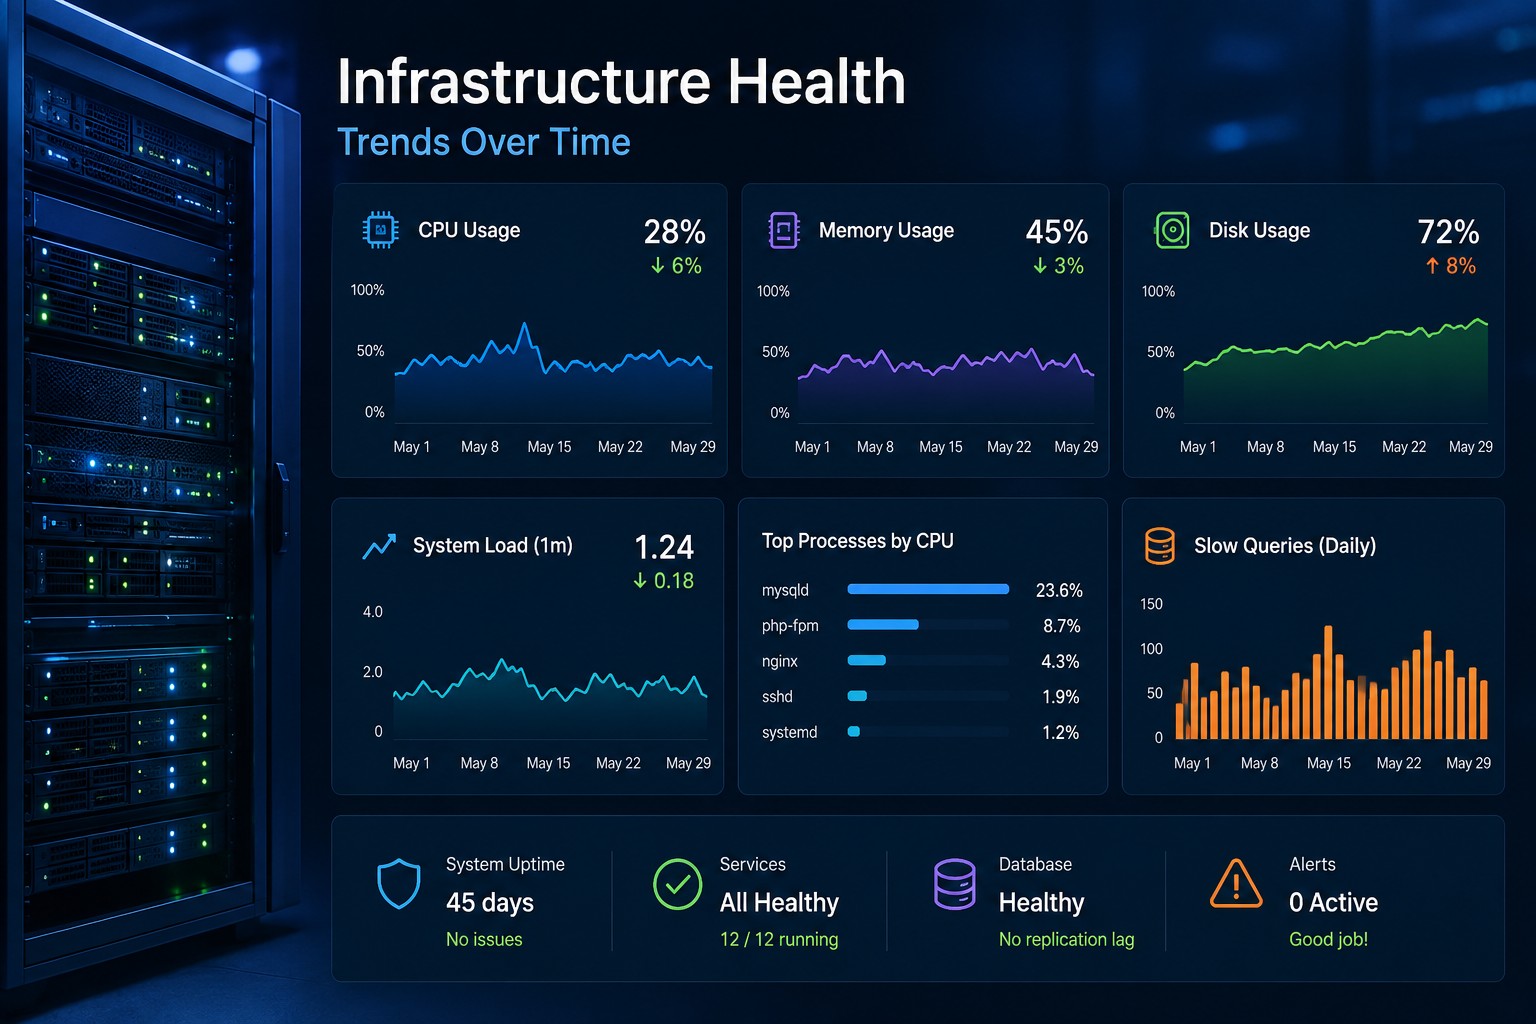
CPU Trends
Short CPU spikes are normal. What matters more is whether average utilization slowly increases over weeks. This often reveals background jobs, application inefficiencies, or growing traffic before systems become unstable.
Memory Usage
Memory pressure can act like a slow leak. Small increases may not trigger alerts immediately, but long-term growth often points to caching issues, container sizing problems, or memory leaks.
Disk Usage
Disk growth is one of the easiest issues to predict when trends are visible. Log retention problems, failed cleanup jobs, and growing backups are common examples.
System Load
Load averages help identify sustained resource pressure instead of temporary spikes. This becomes especially useful on shared application servers.
MySQL Performance
Most teams do not need deep database observability on day one. Tracking slow query growth, connection counts, and storage trends is often enough to identify emerging problems.
Linux Monitoring Without Prometheus
Prometheus is excellent for large-scale environments, but it is not always the right fit for smaller infrastructure teams.
Linux monitoring without Prometheus becomes attractive when:
- You manage only a handful of servers
- You want fewer moving parts
- You prefer lightweight agents or scripts
- You need historical visibility more than real-time telemetry
- You want lower maintenance overhead
Many administrators eventually discover that maintaining the monitoring platform itself becomes another operational burden.
But this is where it matters: simpler systems are often more sustainable. A monitoring setup that your team consistently uses is far more valuable than a powerful platform nobody has time to maintain properly.
Linux Monitoring Without Grafana
Dashboards are useful, but they can also become overwhelming. Large wallboards full of charts sometimes hide the important story: whether system health is improving or getting worse.
Linux monitoring without Grafana usually focuses on reports, summaries, and trend visibility instead of highly customized visualization layers.
This approach works especially well for:
- Weekly infrastructure reviews
- Capacity planning
- Small DevOps teams
- Managed VPS environments
- Internal business applications
Instead of watching dashboards all day, teams can review historical patterns and identify slow operational drift.
So what does this mean in practice? It means fewer distractions and more attention on infrastructure behavior over time.
A Real-World Example of Lightweight Monitoring
One small SaaS company managed six Linux application servers and a single MySQL database. They initially deployed a large monitoring stack with exporters, dashboards, and aggressive alerting.
Within a few months, the team stopped paying attention to alerts because too many notifications turned out to be temporary spikes.
Meanwhile, a more important issue went unnoticed.
Disk utilization on the database server increased by roughly 2% every day due to archived logs not rotating correctly. No critical threshold had been crossed yet, so no urgent alerts were triggered.
When the team finally reviewed long-term disk trends, the pattern became obvious immediately.
The fix took less than fifteen minutes.
That is the advantage of a minimal linux monitoring setup focused on health reporting instead of alert volume. It helps you notice gradual changes before they become outages.
Building a Simple Linux Monitoring Solution
You do not need a massive platform to create effective visibility.
A practical lightweight setup can be built with:
- Basic metric collection scripts
- Scheduled health reports
- Simple trend graphs
- Log rotation monitoring
- MySQL slow query tracking
- Weekly operational summaries
Many teams also combine standard Linux tools such as:
topvmstatiostatsardfmysqladmin
These tools already provide valuable system visibility. The key difference is organizing the information into trends instead of relying only on instant snapshots.
What Small Infrastructure Teams Actually Need
Linux monitoring for small business environments should reduce operational stress, not create more of it.
Most small teams care more about stability and predictability than advanced telemetry pipelines.
That usually means:
- Understanding infrastructure health over time
- Detecting gradual performance degradation
- Reducing unnecessary alerts
- Keeping tooling easy to maintain
- Improving capacity planning decisions
Small environments often benefit from operational simplicity because there are fewer engineers available to maintain supporting systems.
A lightweight linux monitoring tool can provide enough visibility without introducing additional infrastructure complexity.
Common Mistakes in Minimal Monitoring Setups
Keeping monitoring simple does not mean ignoring important metrics.
Some common mistakes include:
Tracking Only Real-Time Data
Real-time monitoring helps during incidents, but trend visibility is what helps prevent them.
Ignoring Storage Growth
Disk issues rarely appear instantly. Watching long-term usage trends is one of the easiest ways to avoid outages.
Collecting Too Many Metrics
More metrics do not automatically create better visibility. Excessive collection often creates noise instead of insight.
No Regular Review Process
Even the best reports are useless if nobody reviews them consistently. Weekly infrastructure reviews can reveal patterns that alerts miss entirely.
Choosing the Right Monitoring Approach
There is no universal monitoring stack that fits every environment.
Large enterprise platforms make sense for distributed systems with complex scaling requirements. But smaller teams often achieve better operational clarity with focused, lightweight reporting.
The best setup is usually the one your team can maintain consistently without creating additional operational burden.
If your infrastructure is relatively small, a simple linux monitoring solution may provide all the visibility you actually need.
Summary
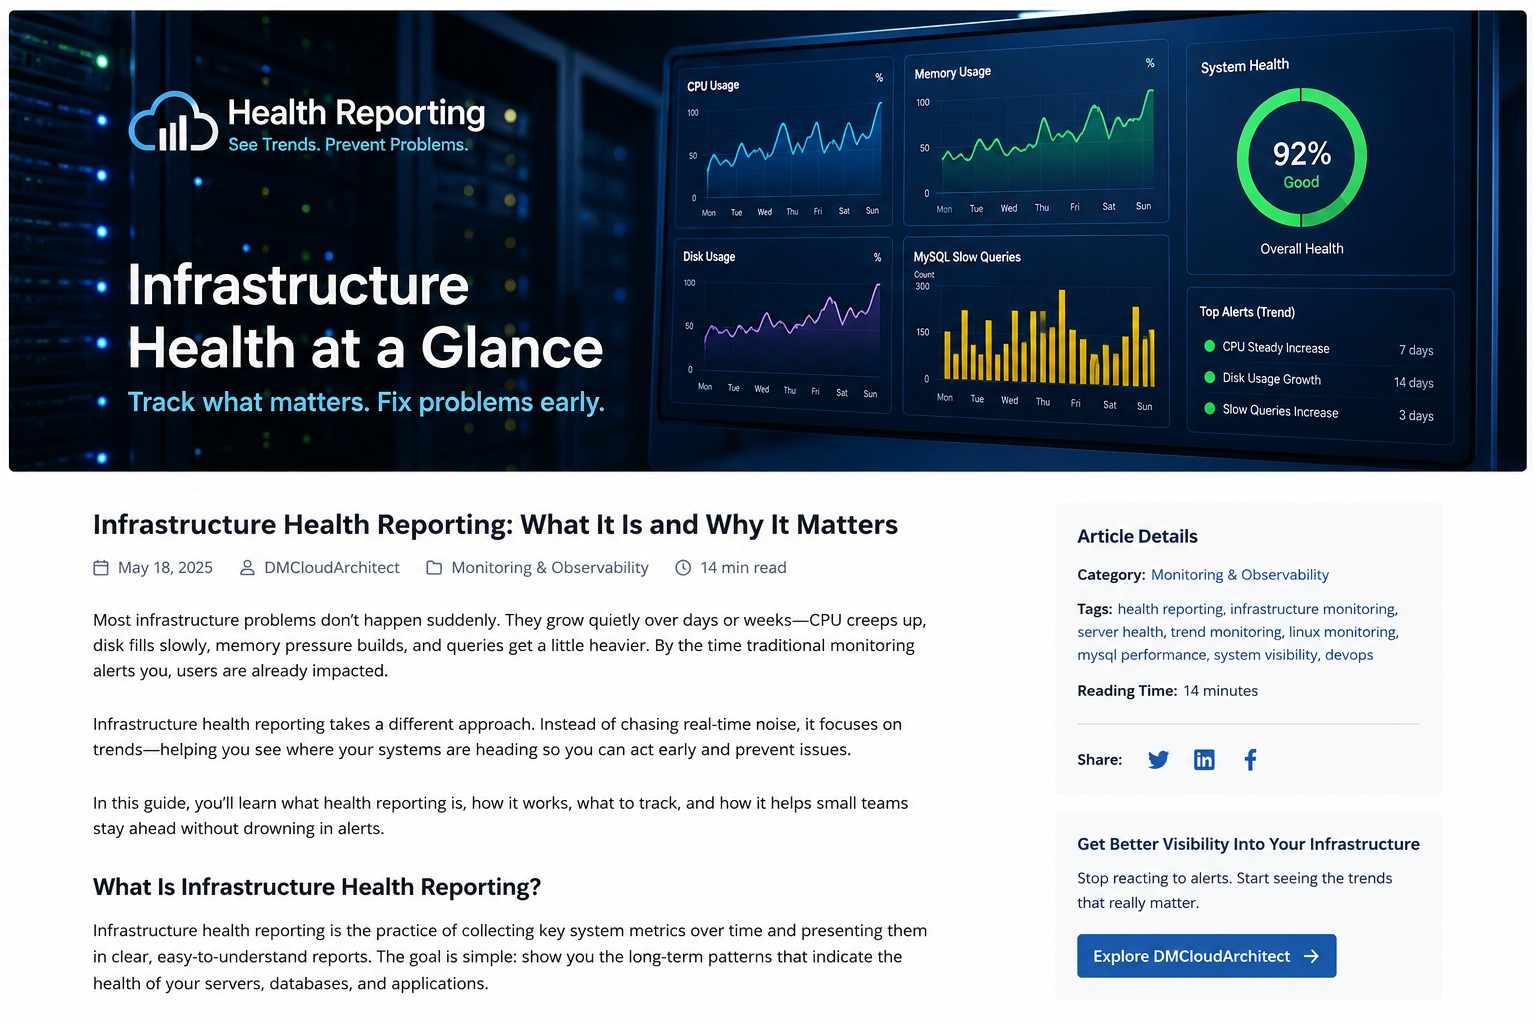
A minimal linux monitoring setup is not about giving up visibility. It is about focusing on the signals that matter most.
By tracking trends in CPU usage, memory pressure, disk growth, and MySQL performance, small teams can identify problems earlier without maintaining a large observability stack.
Most monitoring tools alert you after issues become urgent. Trend-based health reporting helps you understand how systems change over time so you can act before outages happen.
If you want a calmer and more practical approach to infrastructure visibility, explore Infrastructure Health Reporting to see how lightweight reporting can help you monitor Linux systems without unnecessary complexity.