Disk space problems rarely appear all at once. In most Linux environments, storage issues build slowly over time until something finally breaks. A log directory keeps growing, backups start stacking up, or temporary files quietly consume space in the background. By the time an alert fires, the server may already be struggling.
That’s why many administrators still rely on cron-based disk monitoring. It’s lightweight, predictable, and easy to customize. Instead of deploying a large observability platform for every small server, you can automate regular disk usage checks with a simple script and a scheduled cron job.
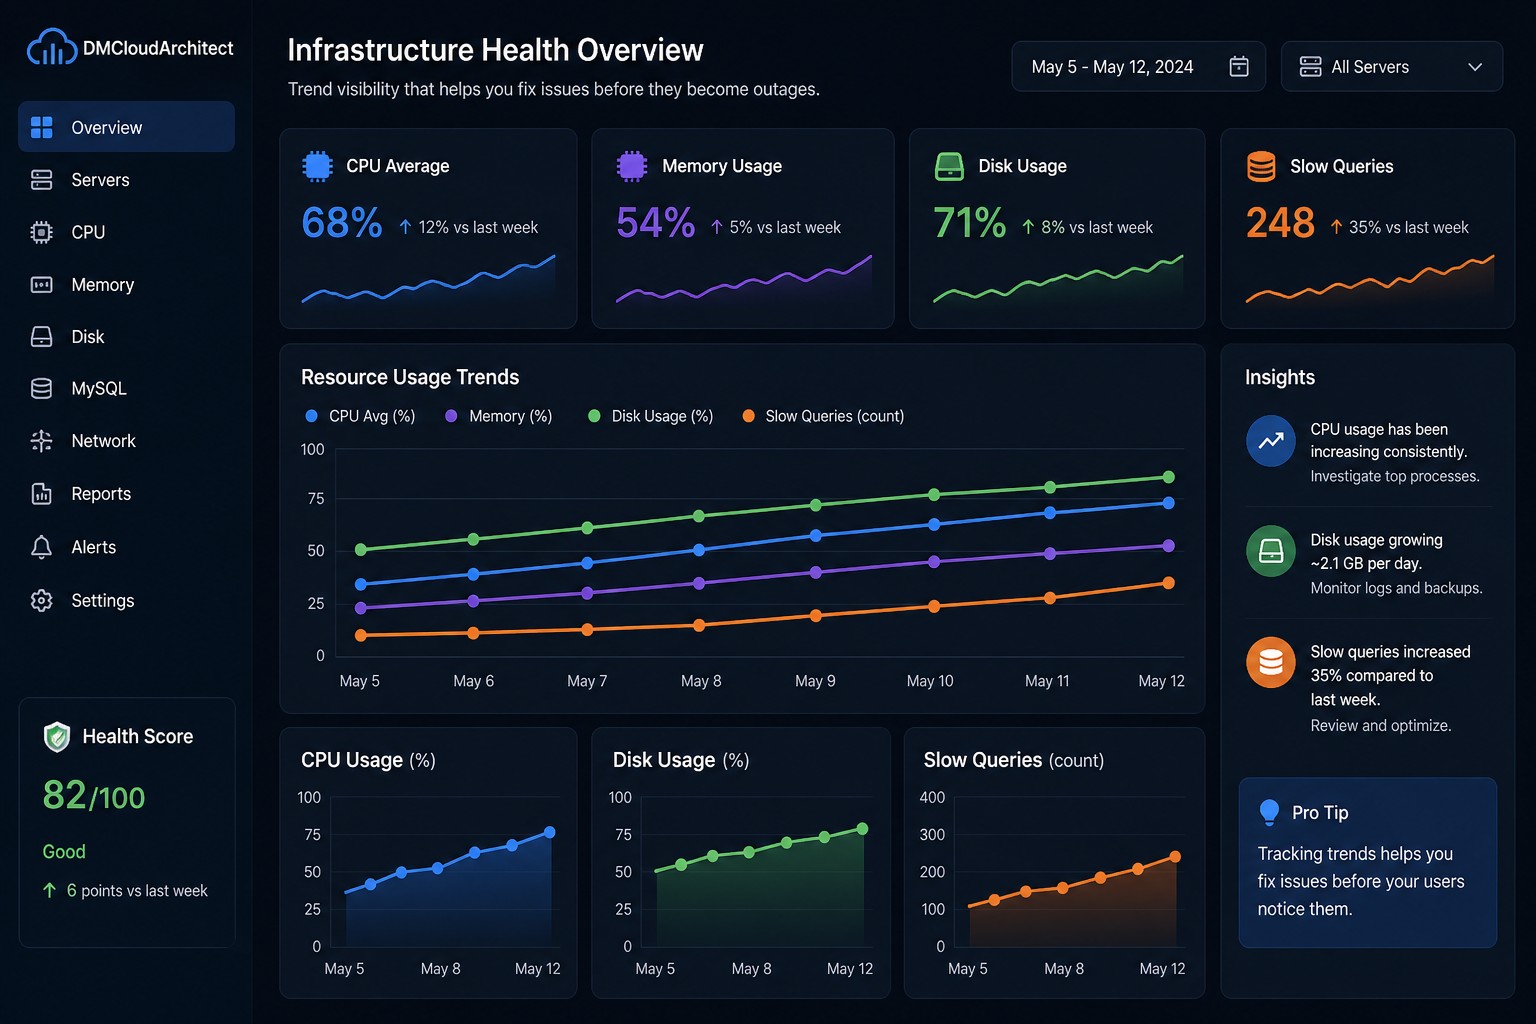
Here’s the thing: consistent visibility matters more than noisy alerts. When you can track disk usage trends over days or weeks, it becomes much easier to spot slow-moving problems before they turn into outages.
Why Cron-Based Disk Monitoring Still Works
Modern monitoring platforms are powerful, but they can also become overly complex for smaller environments. Many Linux teams just need reliable reporting on server health without adding another heavy service stack.
A cron disk monitoring Linux setup gives you:
- Automated scheduled checks
- Low resource usage
- Simple reporting workflows
- Easy integration with email or logs
- Visibility into long-term storage growth
This approach works especially well for:
- Small infrastructure teams
- VPS environments
- Database servers
- Web servers with growing log files
- Backup storage systems
But this is where it matters: the goal is not just checking if a disk is full right now. The real value comes from tracking changes over time.
Using Native Linux Disk Monitoring Commands
Before creating automation, it helps to understand the core Linux disk monitoring command options available on most systems.
Check Overall Disk Usage
df -hThis command shows mounted filesystems, available space, and percentage usage in a readable format.
Example output:
Filesystem      Size  Used Avail Use% Mounted on
/dev/sda1        80G   58G   19G  76% /
/dev/sdb1       500G  320G  155G  68% /data
For automated monitoring, many administrators focus on the Use% column and trigger warnings when thresholds exceed 80% or 90%.
Find Large Directories
du -sh /var/*This helps identify which directories are consuming the most storage.
In practice, this becomes useful when troubleshooting:
- Growing MySQL binary logs
- Large application cache directories
- Container image accumulation
- Rotating log failures
Building a Simple Disk Usage Script
A good disk usage script Linux administrators can rely on should be readable, lightweight, and easy to modify later.
Here’s a practical example:
#!/bin/bash

THRESHOLD=80
ALERT_EMAIL="[email protected]"

OUTPUT=$(df -hP | awk 'NR>1 {print $1, $5, $6}')

while read line; do
    USAGE=$(echo $line | awk '{print $2}' | sed 's/%//')
    PARTITION=$(echo $line | awk '{print $1}')
    MOUNT=$(echo $line | awk '{print $3}')

    if [ $USAGE -ge $THRESHOLD ]; then
        echo "Warning: $PARTITION mounted on $MOUNT is at ${USAGE}% usage" \
        | mail -s "Disk Usage Alert" $ALERT_EMAIL
    fi
done <<< "$OUTPUT"
This bash script disk monitoring approach checks all mounted filesystems and sends an email alert when usage crosses the configured threshold.
You can save the script as:
/usr/local/bin/disk-monitor.shThen make it executable:
chmod +x /usr/local/bin/disk-monitor.shScheduling the Script with Cron
Once the script works manually, automation becomes straightforward.
Open the crontab editor:
crontab -eAdd a scheduled job:
0 * * * * /usr/local/bin/disk-monitor.shThis runs the monitoring script every hour.
You can also adjust the schedule depending on the environment:
- Every 15 minutes for busy database servers
- Every hour for standard application servers
- Daily for backup storage systems
So what does this mean in practice? Your servers now perform automated health checks without requiring a dedicated monitoring agent.
Improving Your Monitoring Script
Basic scripts are useful, but over time most teams improve them to support better visibility and trend reporting.
Write Results to a Log File
Instead of only sending alerts, store disk usage history:
df -h >> /var/log/disk-usage-history.logThis creates historical records that help identify slow storage growth patterns.
For example, you might notice:
- Database storage increasing 2 GB per week
- Application logs growing unusually fast
- Backup retention policies failing silently
These slow trends are often more important than sudden spikes.
Monitor Specific Filesystems Only
Some administrators only care about critical mount points:
df -h / /var /dataThis reduces noise and keeps reports focused on operationally important storage.
Exclude Temporary Filesystems
Tmpfs mounts and container overlays can clutter monitoring results.
You can filter them out:
df -hP -x tmpfs -x devtmpfsThis creates cleaner reporting for production environments.
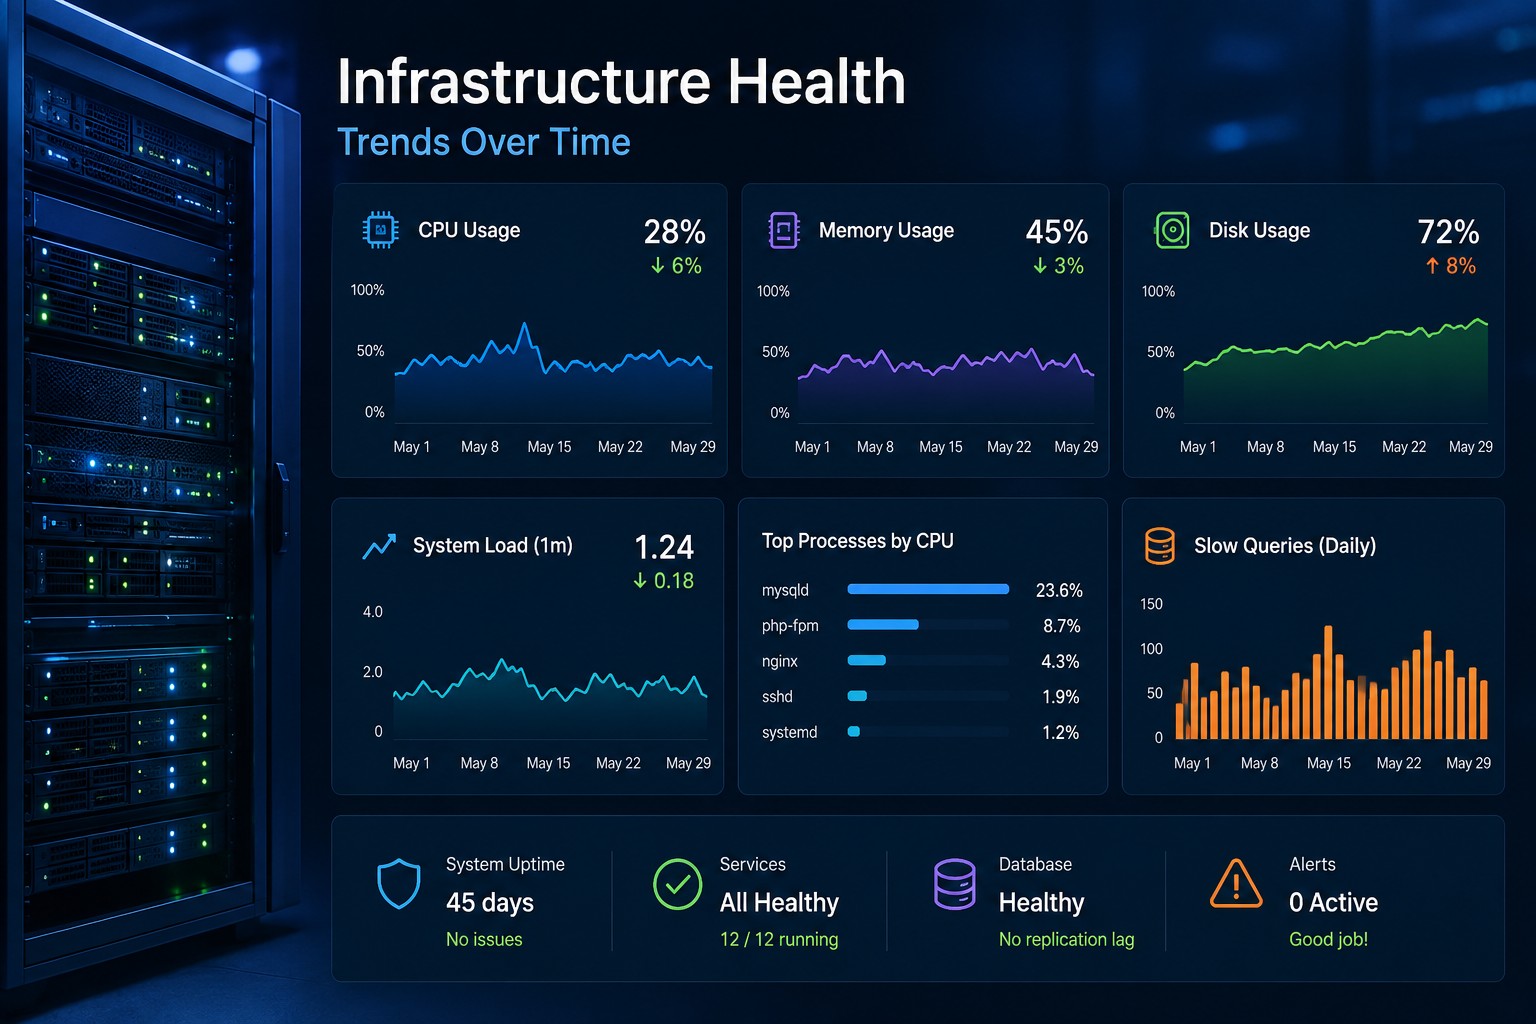
Real-World Example: Slow Log Growth
Imagine a Linux web server running several PHP applications with verbose logging enabled.
At first, everything looks normal. Disk usage only increases slightly each day. No immediate alerts appear.
But over several weeks, the /var/log directory continues growing like a slow leak.
Without visibility into the trend, the server eventually reaches critical storage usage during a busy weekend deployment.
Now compare that to a cron-based monitoring setup:
- Hourly disk reports show gradual growth
- Historical logs reveal increasing usage patterns
- The operations team identifies the issue early
- Log rotation policies are corrected before downtime occurs
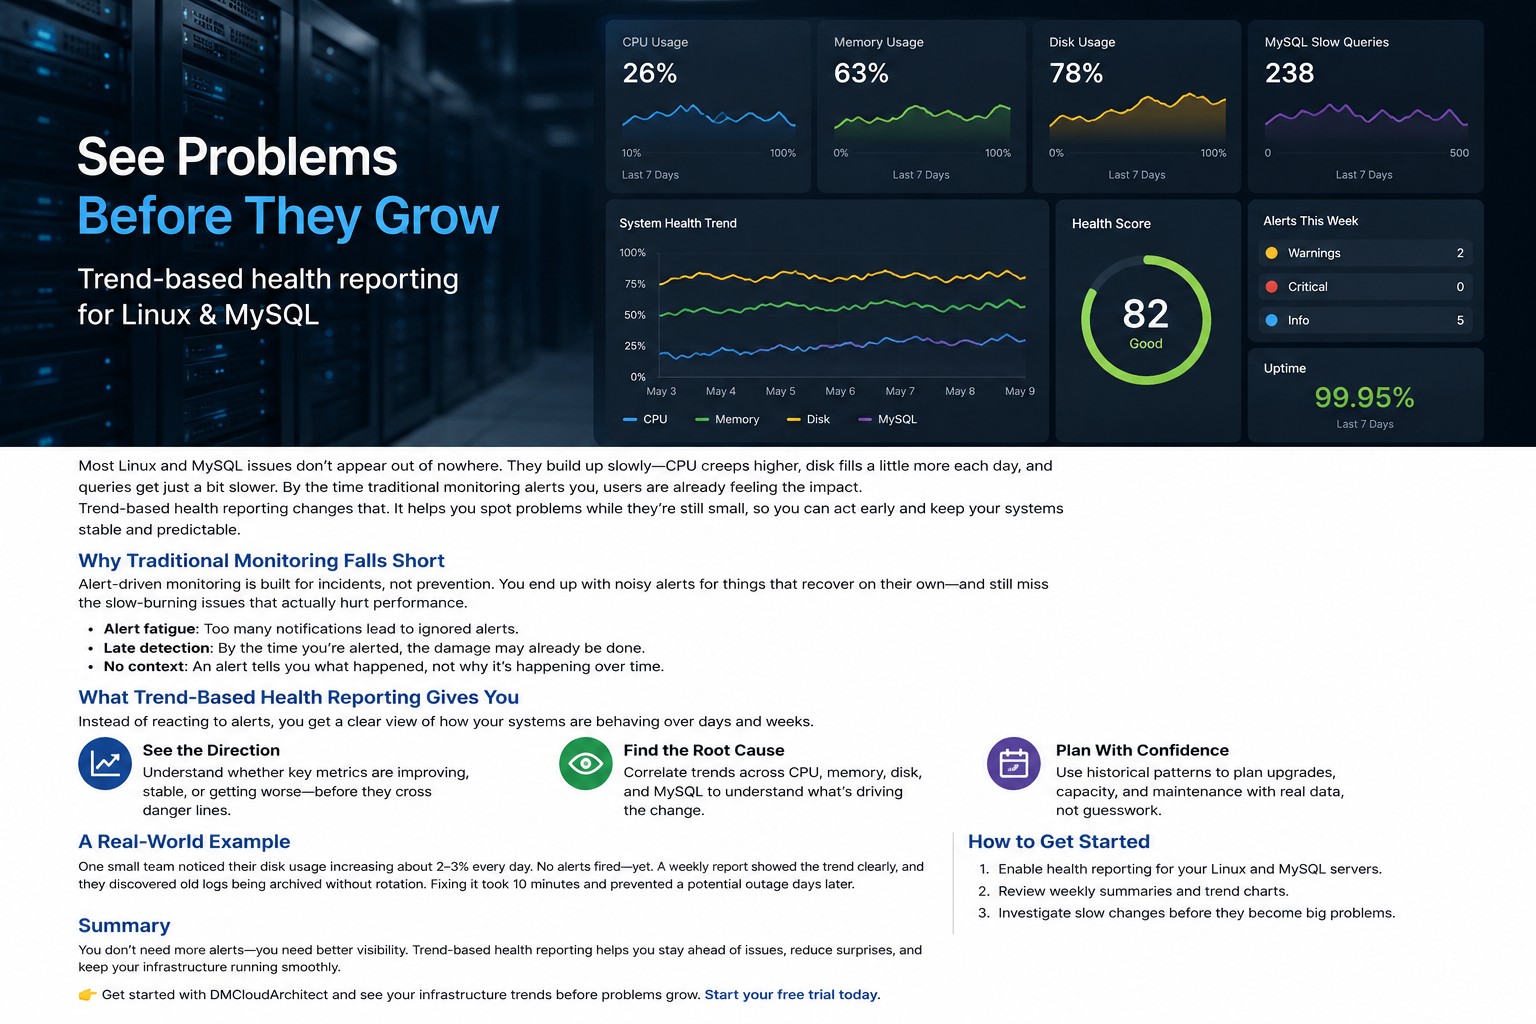
This is exactly why trend-focused infrastructure reporting is valuable. Most storage problems are predictable if you watch the data long enough.
When Cron Monitoring Is Enough — And When It Isn’t
Cron jobs are excellent for lightweight infrastructure monitoring, but they do have limitations.
They work best when you need:
- Simple scheduled reporting
- Long-term visibility
- Basic alerting
- Low-overhead automation
However, larger environments may eventually require:
- Centralized dashboards
- Distributed metric collection
- Real-time anomaly detection
- Multi-server correlation
Even then, cron-based reporting often remains useful alongside more advanced monitoring platforms because it provides simple independent verification.
Best Practices for Cron Disk Monitoring in Linux
- Keep scripts readable and documented
- Store historical usage logs for trend analysis
- Use conservative alert thresholds
- Test cron jobs manually before deployment
- Rotate monitoring logs regularly
- Focus on meaningful patterns instead of constant alerts
Most monitoring tools will alert you when it’s already too late. Scheduled health reporting helps you understand how problems develop before they become outages.
Summary
A cron disk monitoring Linux setup remains one of the simplest and most effective ways to automate storage visibility on Linux servers. With a lightweight bash script, scheduled cron jobs, and historical reporting, you can catch slow-growing disk issues before they affect applications or databases.
For small infrastructure teams especially, this approach provides practical visibility without adding unnecessary complexity. If you want broader long-term trend reporting across your environment, take a look at Infrastructure Health Reporting to see how health-focused monitoring can help identify issues before they turn into outages.