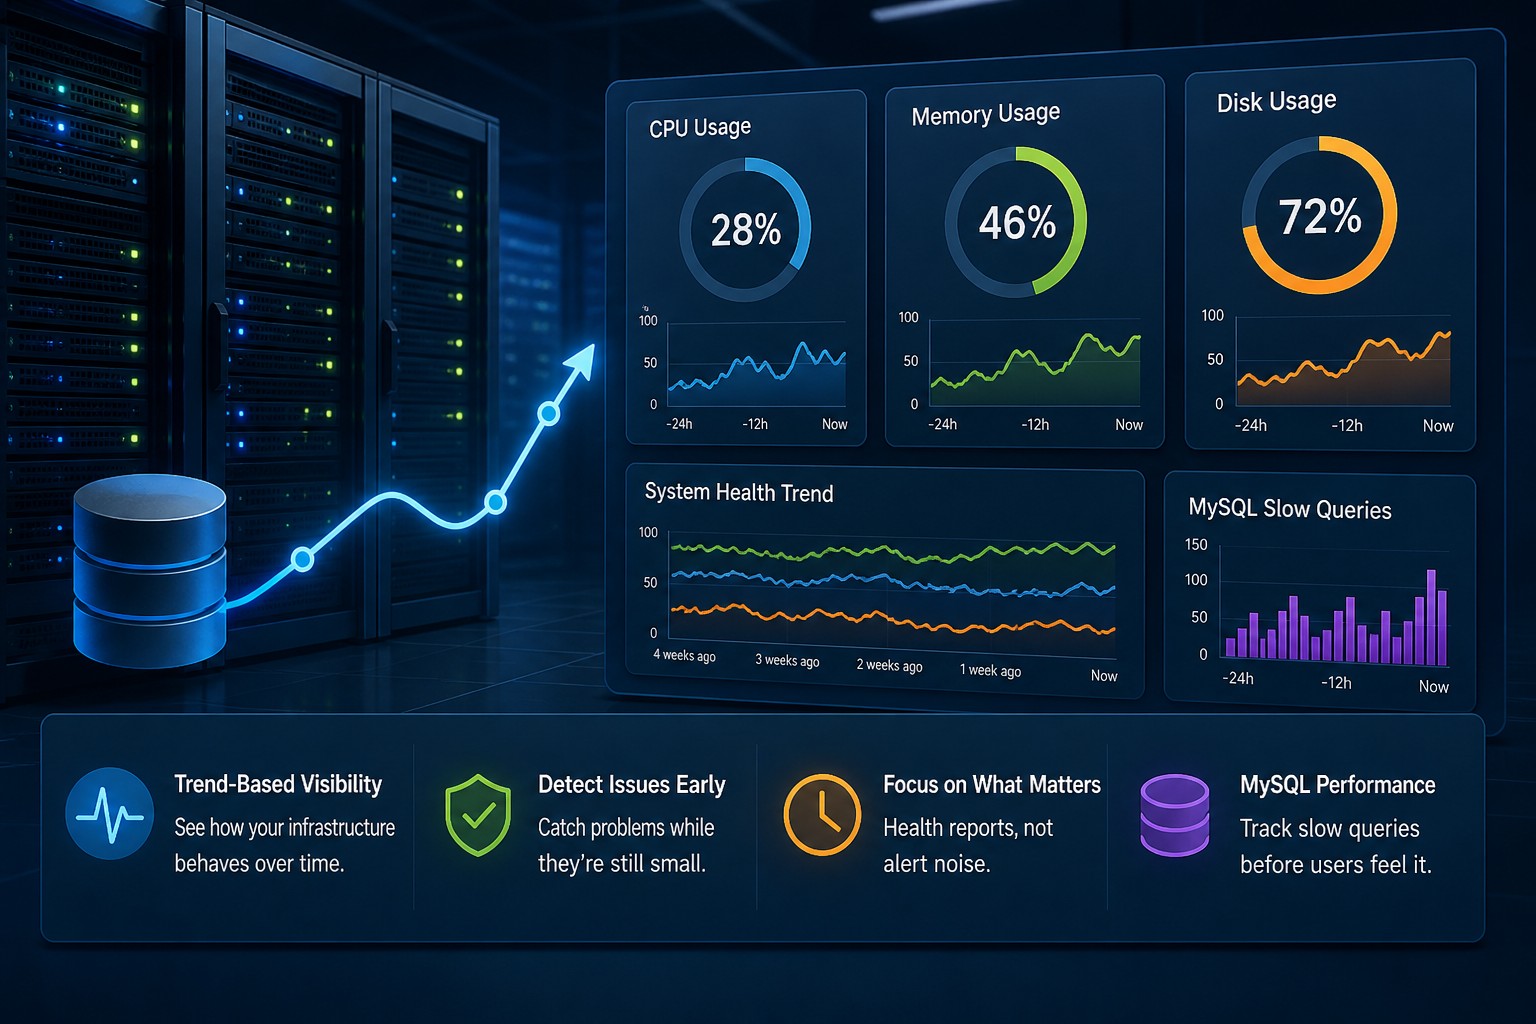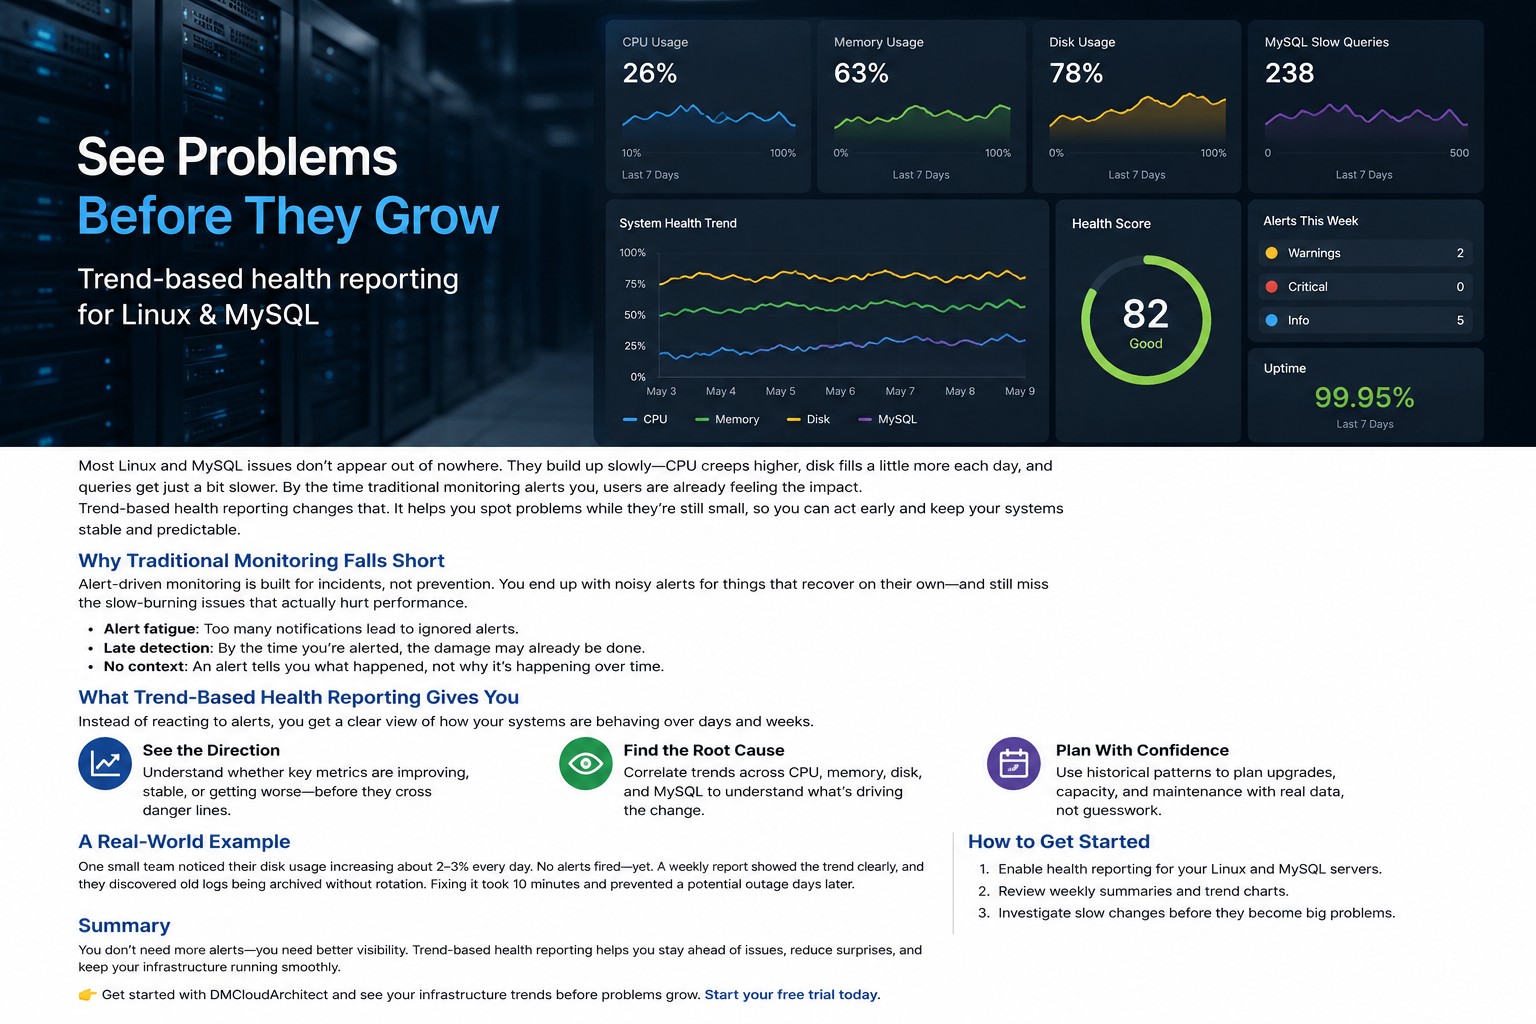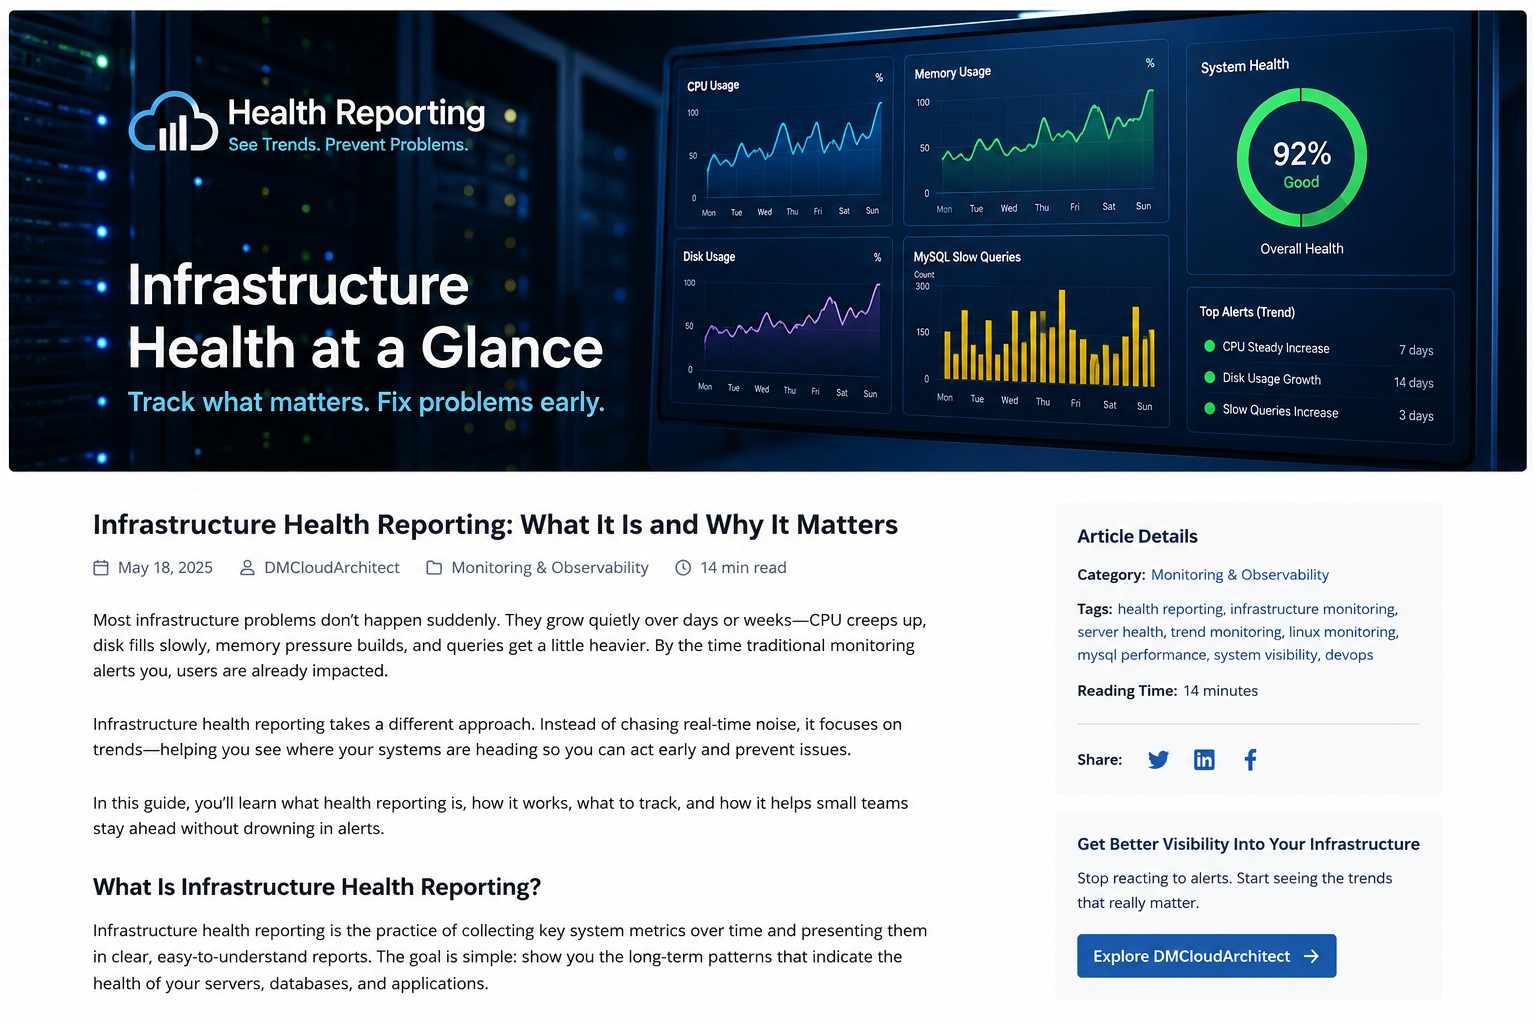
Most infrastructure problems do not appear all at once. CPU usage climbs gradually over several weeks. Disk usage grows little by little until backups start failing. MySQL queries become slightly slower every day until applications feel sluggish. Traditional monitoring tools often react only after these issues cross a hard threshold.
That is where system health reporting becomes valuable. Instead of focusing only on alerts and incidents, it helps you understand long-term patterns across your servers, databases, and infrastructure services. You stop reacting to noise and start seeing where systems are actually heading.
For smaller operations teams especially, this shift matters. You may not have a dedicated observability department or a large engineering team watching dashboards all day. But you still need visibility into system behavior before small issues turn into outages.
What Is System Health Reporting?
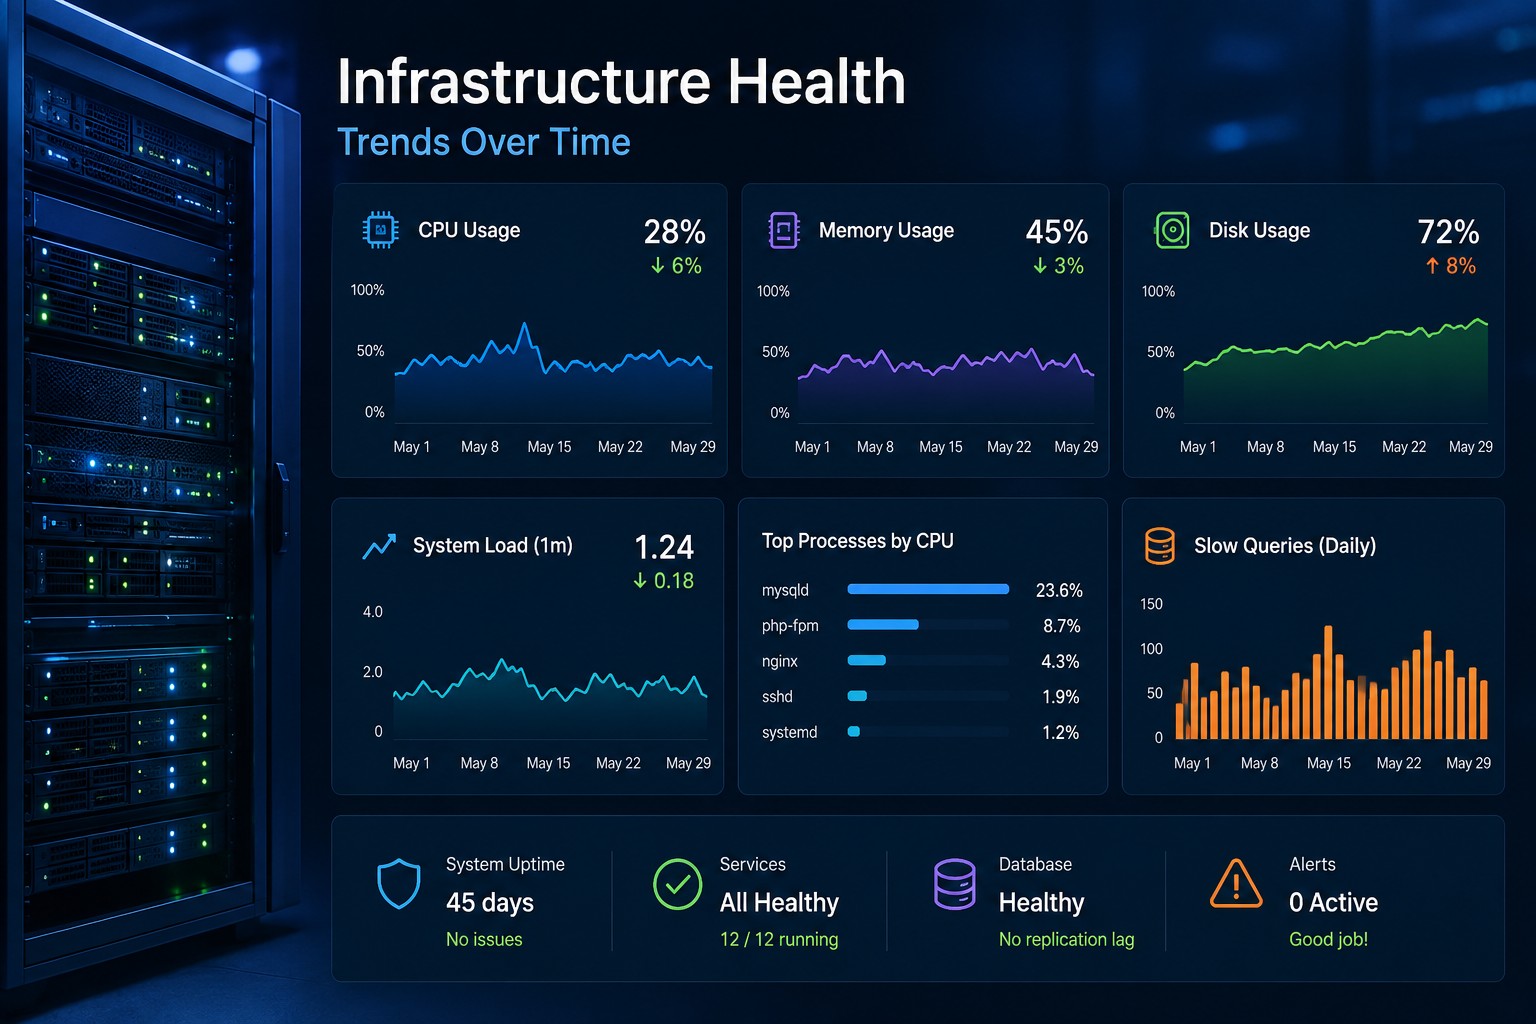
System health reporting is the process of collecting infrastructure metrics over time and organizing them into readable reports that show trends, stability, and operational health. Instead of concentrating only on real-time events, reports focus on historical patterns and gradual change.
A good infrastructure health reporting process typically includes:
- CPU utilization trends
- Memory pressure over time
- Disk growth and filesystem usage
- MySQL query performance
- Network activity patterns
- Service uptime history
- Error rate tracking
- Backup consistency checks
The goal is not to flood teams with more alerts. The goal is to provide context that helps teams make better operational decisions.
Why Real-Time Monitoring Alone Is Not Enough
Real-time monitoring tools are important. They help identify outages, service failures, and sudden spikes. But here’s the thing: many infrastructure problems behave more like slow leaks than explosions.
Imagine a database server where memory usage increases by only 2% every week. No single alert fires because the threshold is never crossed quickly enough. But after several months, the server begins swapping heavily during peak traffic. Performance drops. Users complain. The issue suddenly looks urgent even though the warning signs existed the entire time.
Server health reporting helps expose these gradual changes early.
Weekly or monthly infrastructure monitoring reports can reveal:
- Steady resource consumption growth
- Capacity planning concerns
- Applications generating more load than expected
- Slow increases in query latency
- Storage expansion requirements
- Recurring overnight performance issues
So what does this mean in practice? Teams can schedule fixes before systems become unstable instead of constantly firefighting production problems.
Key Metrics to Include in a Server Health Report
A useful server health weekly report should focus on trends that actually help operations teams make decisions. Too many metrics create noise. Too few create blind spots.
CPU Utilization Trends
CPU graphs become much more valuable when viewed across weeks instead of minutes. A server consistently moving from 25% average utilization to 70% over several months tells a very different story than a temporary spike during deployment.
Long-term CPU reporting can help identify:
- Growing application demand
- Background job scheduling problems
- Inefficient software updates
- Capacity planning timelines
Memory Pressure and Swap Usage
Memory issues are often subtle at first. Applications may slowly consume additional RAM after updates or increased traffic. Over time, systems begin relying more heavily on swap, causing latency problems.
Infrastructure health dashboards that track memory behavior historically make these patterns easier to identify before performance degrades significantly.
Disk Utilization Growth
Disk usage reporting is one of the simplest but most useful forms of system health reporting.
A filesystem growing by 1% every week may not seem dangerous initially. But over six months, that trend becomes a serious operational concern.
Good reporting helps teams answer questions like:
- Which servers are growing fastest?
- Which applications produce the most data?
- How quickly will storage limits be reached?
- Are backup retention policies creating unnecessary growth?
Database Query Performance
MySQL performance often changes gradually. Slow queries increase slightly. Table scans become more frequent. Replication lag appears during traffic peaks.
Without historical reporting, these problems are easy to miss because individual alerts may never trigger.
A practical infrastructure monitoring report should include:
- Average query response time
- Slow query growth trends
- Replication health
- Connection usage
- Table growth statistics
How Infrastructure Health Dashboards Improve Visibility
An infrastructure health dashboard brings all of these trends together into a centralized operational view. But this is where it matters: dashboards should simplify visibility, not overwhelm teams.
Many organizations struggle because their monitoring platforms generate too much information. Engineers spend more time filtering alerts than understanding infrastructure behavior.
A cleaner reporting-focused dashboard typically works better for small and medium-sized teams because it emphasizes:
- Weekly and monthly trends
- Infrastructure stability indicators
- Operational summaries
- Risk areas requiring attention
- Capacity forecasting
Instead of reacting to every temporary spike, teams can focus on meaningful patterns that indicate genuine infrastructure risk.
Real-World Example: The Slow Disk Problem
Consider a Linux application server hosting customer uploads. Daily growth is relatively small, so administrators rarely think about storage usage.
Over several months, however, the upload directory expands steadily because old files are never archived. Backups become slower. Maintenance windows increase. Eventually the server reaches critical disk thresholds during a busy weekend.
A traditional alert may only appear when free space becomes critically low.
But a server health reporting process would have revealed:
- Consistent weekly disk growth
- Backup size increases
- Longer backup execution times
- Filesystem expansion trends
That visibility gives teams time to archive data, expand storage, or adjust retention policies calmly instead of responding during an emergency.
Building a Practical Reporting Routine
You do not need an enormous observability stack to benefit from infrastructure health reporting. Smaller teams can start with a simple reporting process focused on consistency and clarity.
A practical routine often looks like this:
- Collect core infrastructure metrics daily
- Generate weekly trend summaries
- Review growth patterns monthly
- Highlight systems with increasing operational risk
- Track recurring anomalies over time
- Document remediation progress
The most important part is maintaining visibility into long-term system behavior.
Even lightweight reporting can dramatically improve operational awareness when teams review trends consistently.
Common Mistakes in Infrastructure Reporting
Collecting Too Much Data
More metrics do not automatically create better visibility. Teams often collect thousands of data points without identifying which trends actually matter operationally.
Start with practical metrics tied directly to infrastructure health.
Ignoring Historical Context
A single spike rarely tells the full story. Historical comparison is what turns raw metrics into useful operational insight.
Trend-based visibility helps teams understand whether systems are stable, improving, or slowly degrading.
Treating Reports Like Alerts
Health reporting and alerting serve different purposes.
Alerts handle urgent events. Reporting handles visibility, planning, and operational understanding.
When teams try to turn reports into alert streams, they often recreate the same alert fatigue problems they were trying to escape.
Why Trend Visibility Matters for Small Teams
Small infrastructure teams usually operate with limited time and limited staffing. Engineers often manage servers, databases, deployments, backups, and troubleshooting simultaneously.
That makes calm, reliable visibility extremely valuable.
System health reporting creates a clearer operational picture without requiring constant dashboard monitoring. Teams can focus on meaningful infrastructure changes instead of reacting to every temporary fluctuation.
Over time, this approach supports:
- Better capacity planning
- Fewer surprise outages
- Improved system stability
- Reduced alert fatigue
- More predictable infrastructure growth
Summary
System health reporting helps teams move beyond reactive monitoring by focusing on long-term infrastructure behavior and operational trends. Instead of relying only on alerts, you gain visibility into how servers, databases, and applications evolve over time.
For many teams, especially smaller operations groups, that visibility becomes one of the most practical ways to identify issues early and maintain stable infrastructure without overwhelming complexity.
If you want a simpler way to track infrastructure trends and understand long-term server health, explore Infrastructure Health Reporting to see how reporting-focused visibility can help your team stay ahead of problems before outages happen.