Most infrastructure failures don’t happen suddenly. They build up quietly—like a slow leak you don’t notice until the damage is already done.
You might see a CPU spike here, a slightly slower query there. Nothing urgent. No alerts. So it gets ignored. Until one day, performance drops hard or the system goes down.
Here’s the thing… by the time traditional monitoring alerts you, the problem has usually been growing for days or even weeks.
Why Slow Problems Are the Most Dangerous
Fast failures are obvious. A service crashes, alerts fire, and you respond.
But slow issues are different. They don’t cross thresholds immediately. Instead, they creep:
- CPU usage gradually increases over time
- Disk space fills up little by little
- Database queries become slightly slower each day
Individually, these changes don’t look alarming. But together, they create a fragile system.
And this is where it matters—because without visibility into trends, you’re always reacting late.
The Shift from Alerts to Visibility
Traditional monitoring focuses on thresholds:
- CPU > 90%
- Disk usage > 85%
- Memory almost full
But these only tell you when something is already wrong.
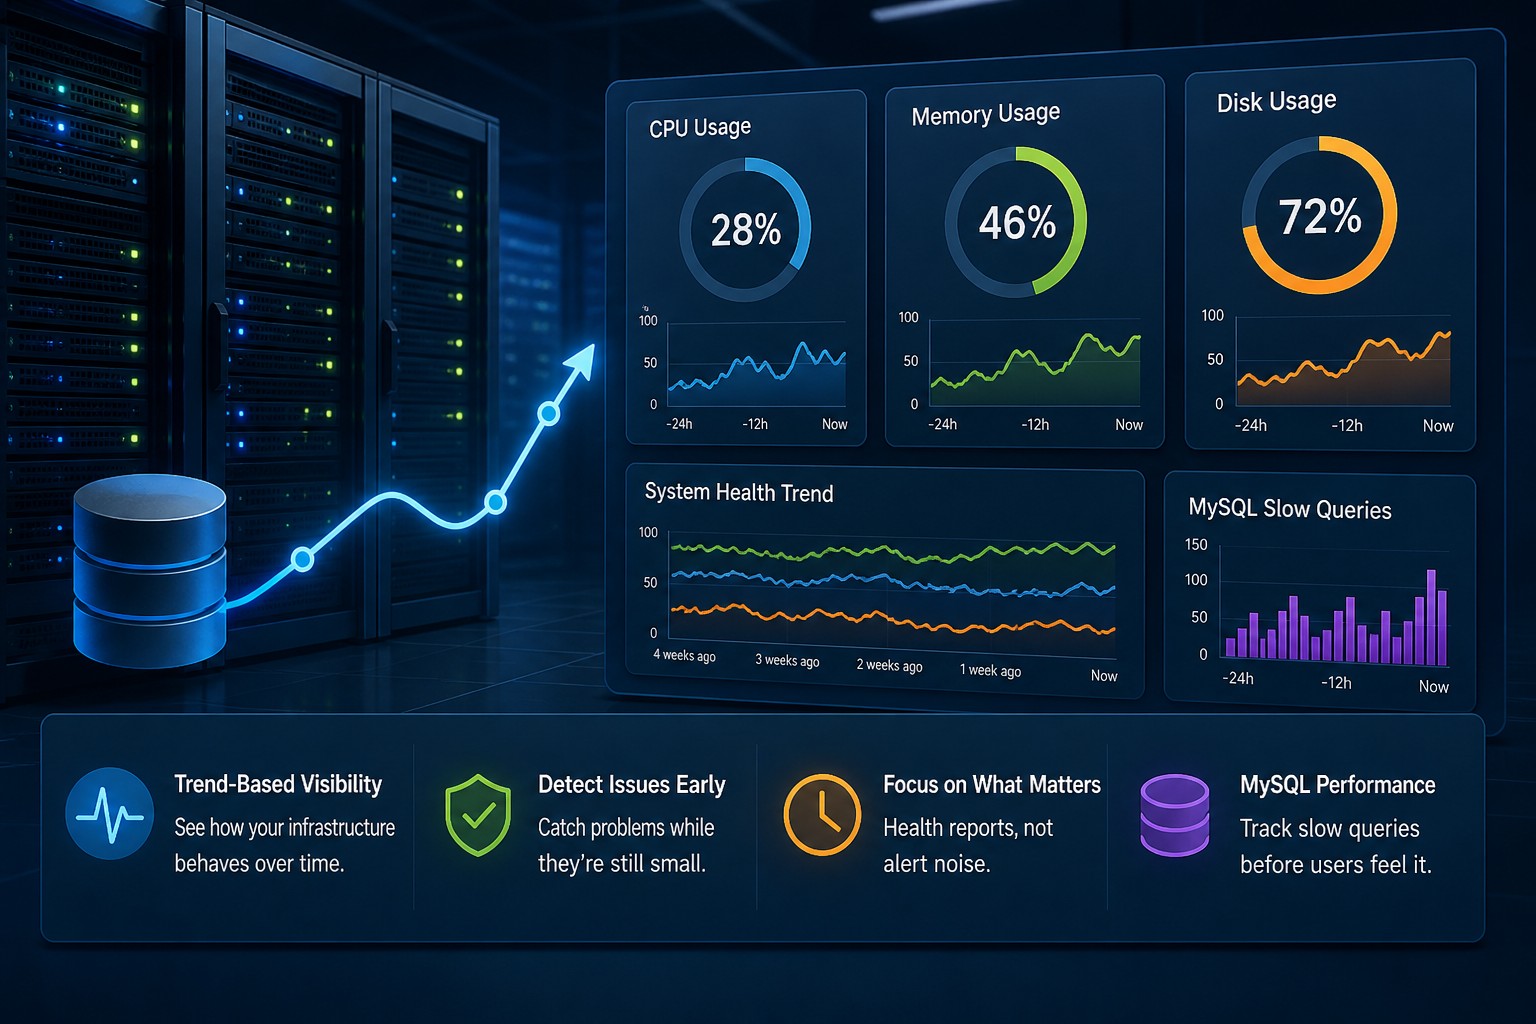
Trend-based visibility flips that approach. Instead of asking “Is something broken right now?”, you start asking:
- Is something getting worse over time?
- Are we trending toward a problem?
- What changed compared to last week?
This gives you time to act before users notice anything.
Common Slow-Build Infrastructure Issues
1. CPU Creep
You start with a comfortable baseline—maybe 30% average CPU usage. Over weeks, it climbs to 50%, then 65%, then 80%.
No alert fires. But your headroom is gone.
This often happens due to:
- New background jobs
- Inefficient code deployments
- Increased traffic without scaling
2. Disk Growth
Disk usage is one of the most predictable failures—and one of the most ignored.
Logs, backups, temp files… they grow slowly.
Without trend tracking, you don’t see the pattern. You just get a “disk full” alert when it’s too late.
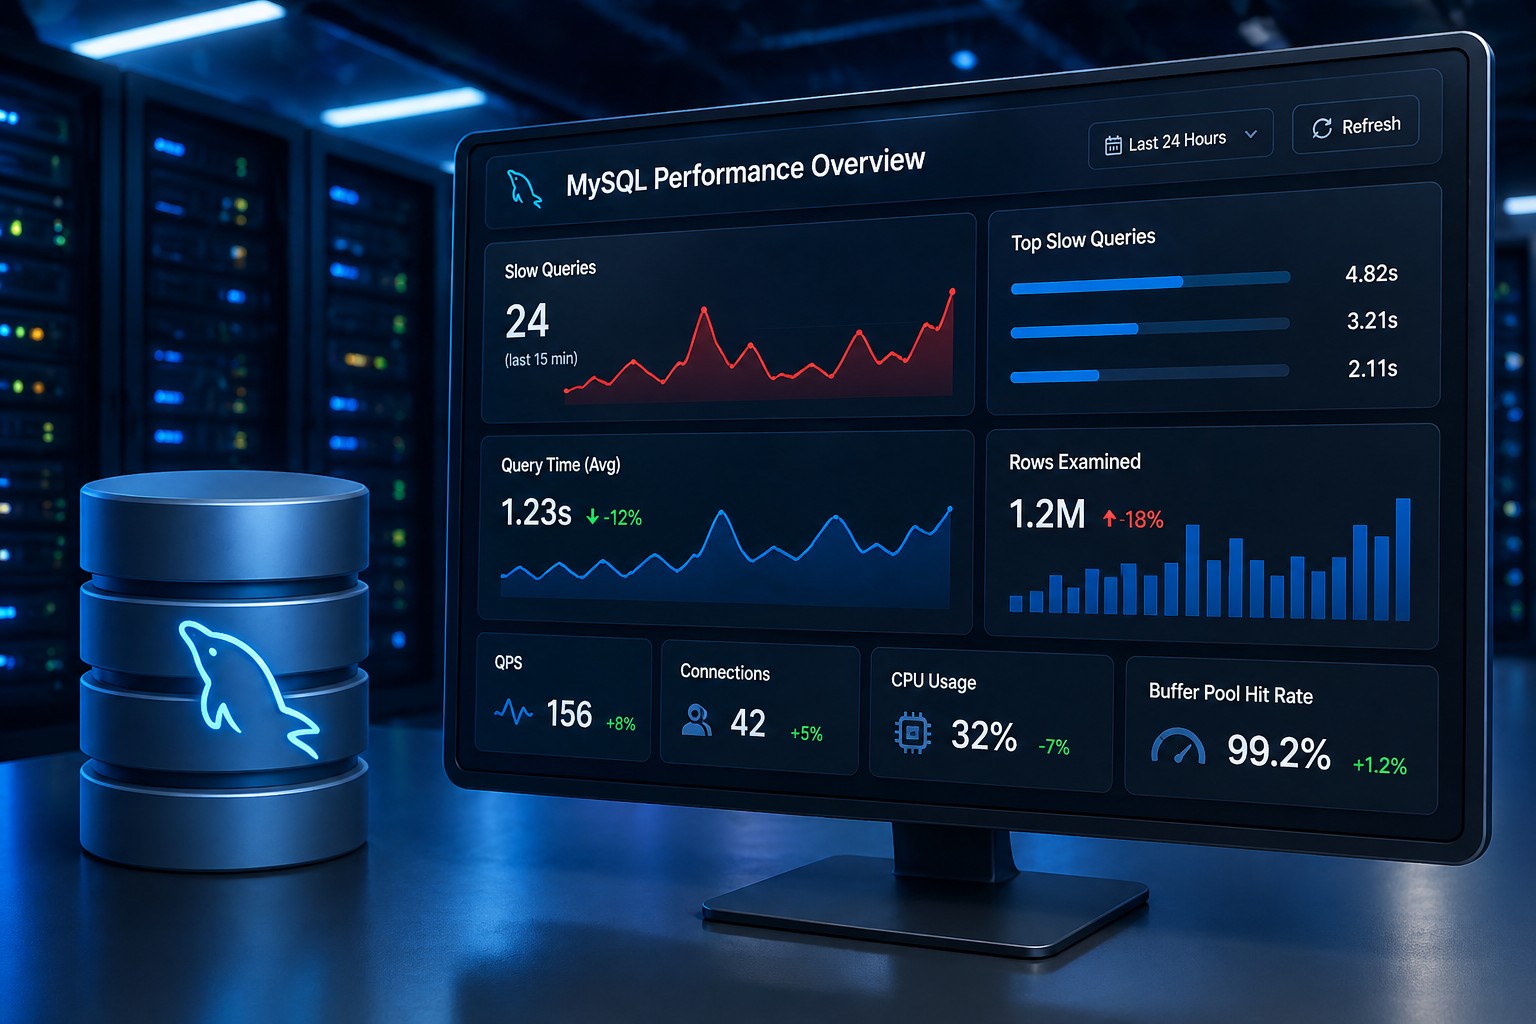
3. Slow Query Accumulation
In MySQL environments, slow queries rarely explode overnight.
Instead:
- Query execution time increases slightly
- More queries fall into the “slow” category
- Load gradually builds on the database
Eventually, this leads to lock contention or timeouts.
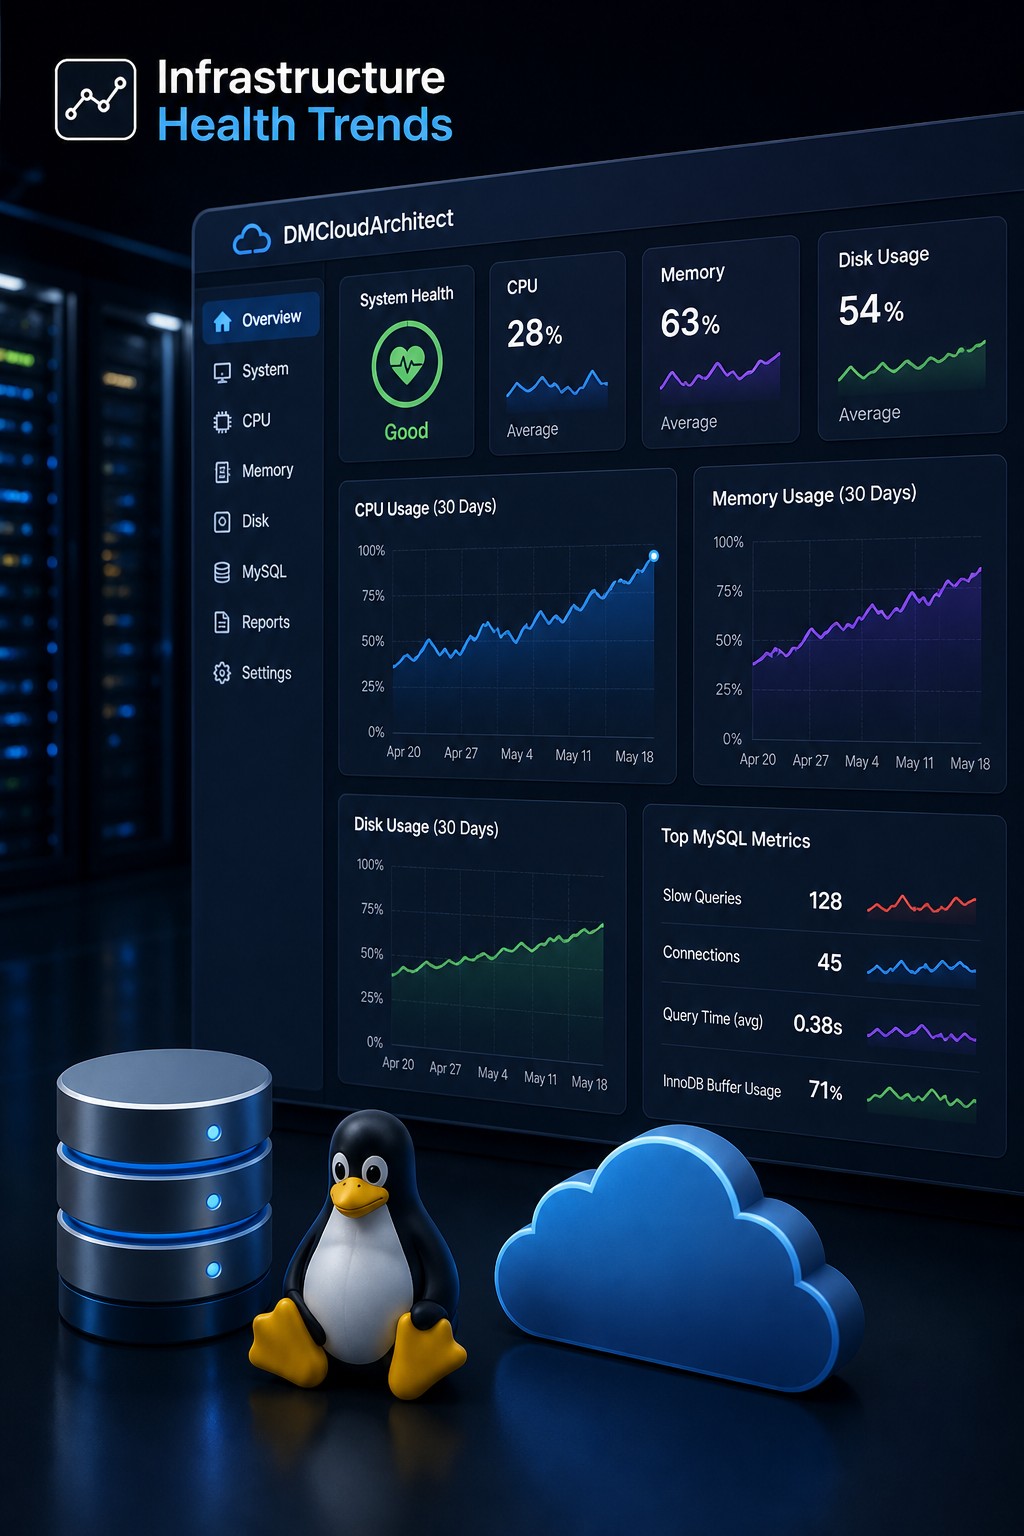
What Trend-Based Monitoring Looks Like in Practice
So what does this mean in practice?
Instead of staring at dashboards all day, you focus on summarized system health over time.
For example:
- Weekly CPU trend reports instead of real-time spikes
- Disk growth rate (GB/day) instead of current usage
- Slow query trend percentages instead of raw counts
This gives you context. Not just data.
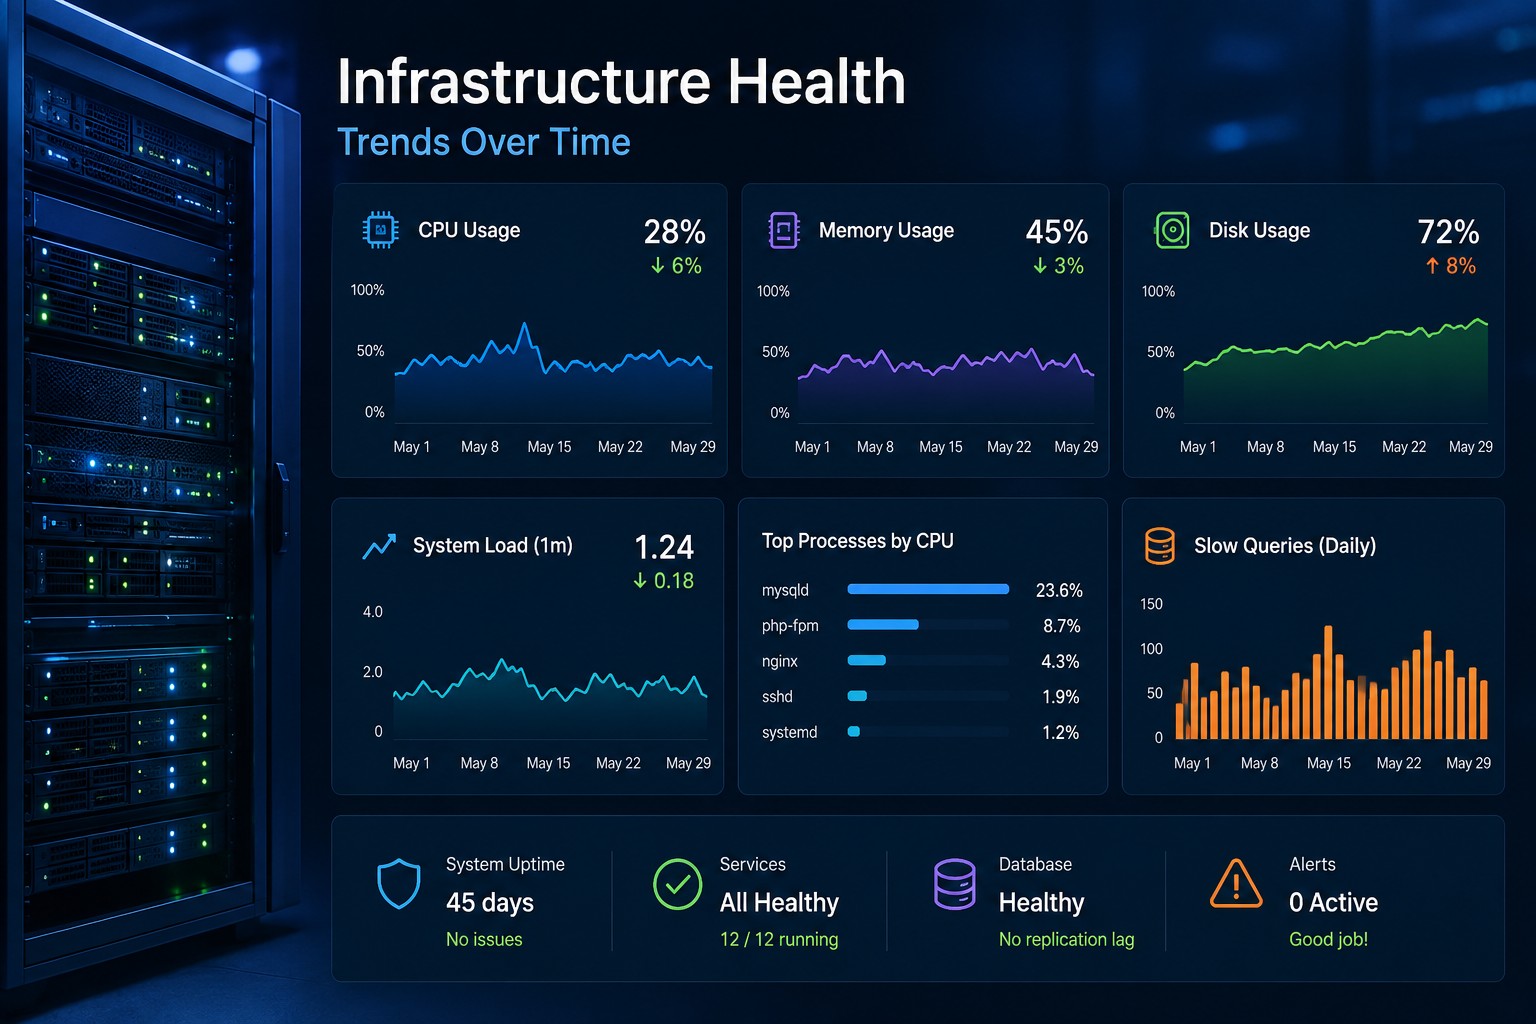
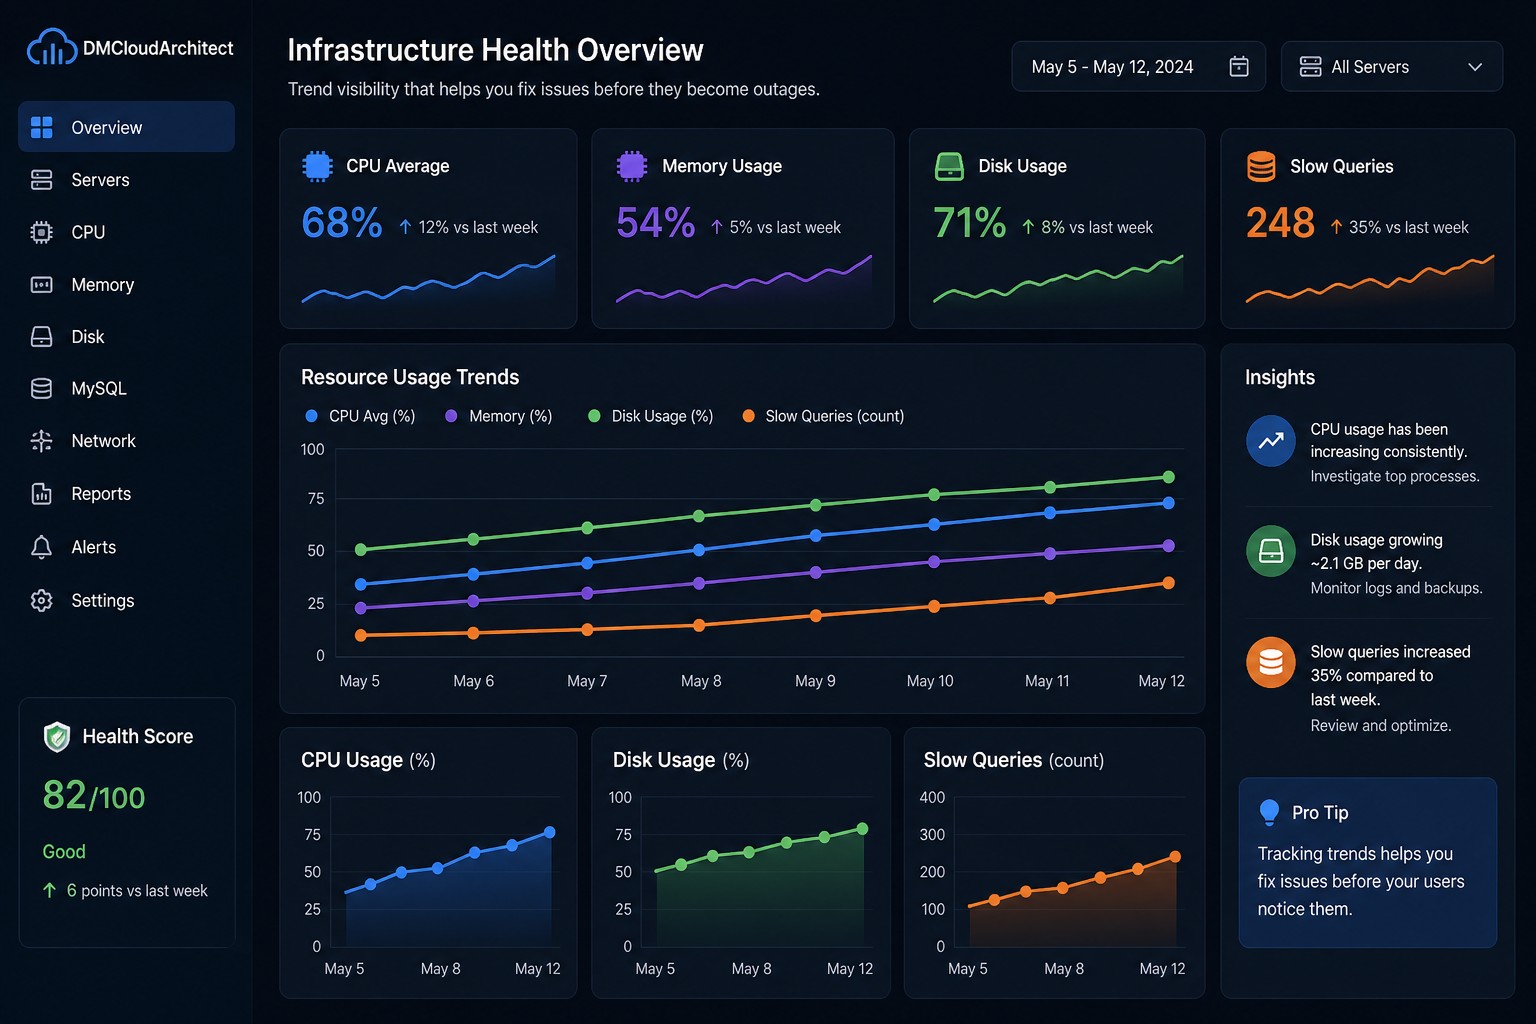
A Real-World Scenario
Let’s say you’re running a small application server.
No alerts are firing. Everything looks “fine.”
But if you looked at trends:
- CPU increased from 40% → 70% over 2 weeks
- Disk is growing at 2GB per day
- Slow queries doubled compared to last week
None of these individually trigger alerts.
But together? They tell a clear story: your system is heading toward failure.
This is the kind of visibility most teams are missing.
How to Start Detecting Issues Earlier
You don’t need a complex observability stack to do this.
Start simple:
- Track weekly averages, not just real-time metrics
- Look for directional changes, not just thresholds
- Compare “this week vs last week” regularly
- Focus on patterns, not isolated spikes
Even basic trend reporting can dramatically improve your awareness.
Why This Approach Works Better for Small Teams
If you’re managing infrastructure with a small team, alert-heavy systems quickly become noise.
You end up ignoring alerts—or constantly firefighting.
Trend-based monitoring changes the dynamic:
- Fewer surprises
- More planning time
- Better system stability
You move from reactive to proactive.
Summary
Most infrastructure problems don’t start as emergencies—they evolve slowly.
If you rely only on alerts, you’ll always be catching issues late.
But by focusing on trends—CPU growth, disk usage patterns, query performance—you can spot problems early and fix them before they impact users.
This is where a health-focused reporting approach makes a real difference. Instead of drowning in alerts, you get a clear view of how your systems are actually behaving over time.
If you want a simpler way to see these trends without building complex dashboards, it’s worth exploring tools designed specifically for infrastructure health visibility.