Disk issues rarely appear suddenly. Most of the time, they build up quietly—like a slow leak—until one day your application crashes, writes fail, or the system becomes unstable. By then, you're already in firefighting mode.
Here’s the thing… if you can detect storage issues early in Linux, you shift from reacting to preventing. And that changes everything for small infrastructure teams.
Why Early Detection of Storage Issues Matters
Most monitoring setups focus on thresholds. Disk hits 90% → alert. Disk hits 95% → panic. But this approach misses the bigger picture.
What actually matters is how your storage behaves over time. Is usage growing steadily? Are writes slowing down? Are I/O wait times creeping up?
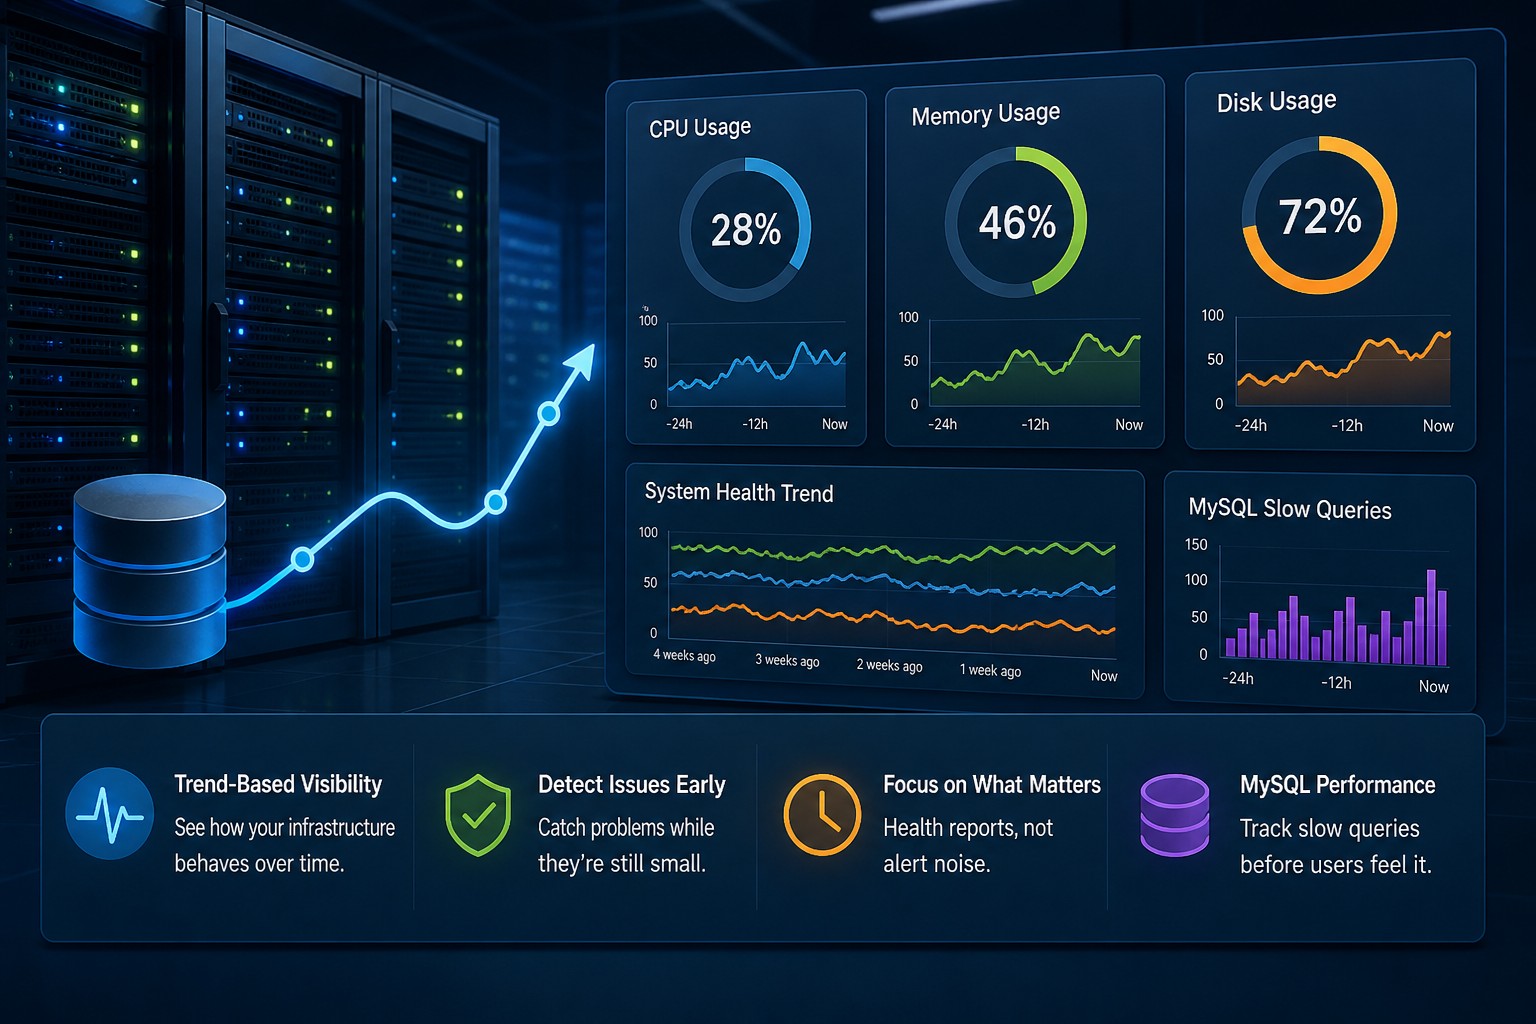
When you focus on trends instead of spikes, you can detect disk full before failure and avoid outages entirely.
Common Early Signs of Disk Problems
Before a disk fills up or fails, it usually leaves signals behind. You just need to know where to look.
1. Gradual Disk Usage Growth
One of the clearest signals is a steady increase in disk usage. This could be logs, backups, or temporary files accumulating over time.
For example, a server might grow from 60% to 75% over two weeks. That doesn’t trigger alerts—but it’s a clear trajectory toward a problem.
2. Increasing I/O Wait
Disk saturation detection in Linux often starts with I/O wait. If your CPU is waiting on disk operations more frequently, something is slowing down.
iostat -x 1
Watch for increasing %iowait or high disk utilization percentages.
3. Slower Write Performance
Applications may start responding slower, especially databases. MySQL, for example, might show growing slow query counts—not because of query complexity, but because disk writes are lagging.
4. Log Growth Patterns
Logs are often the hidden cause of disk issues. If you don’t rotate or monitor them properly, they can quietly consume large portions of your storage.
Practical Ways to Detect Storage Issues Early
So what does this mean in practice? You don’t need a complex observability stack—you need visibility into trends.
Track Disk Usage Over Time
Instead of checking current disk usage, track how it changes daily or weekly.
df -h
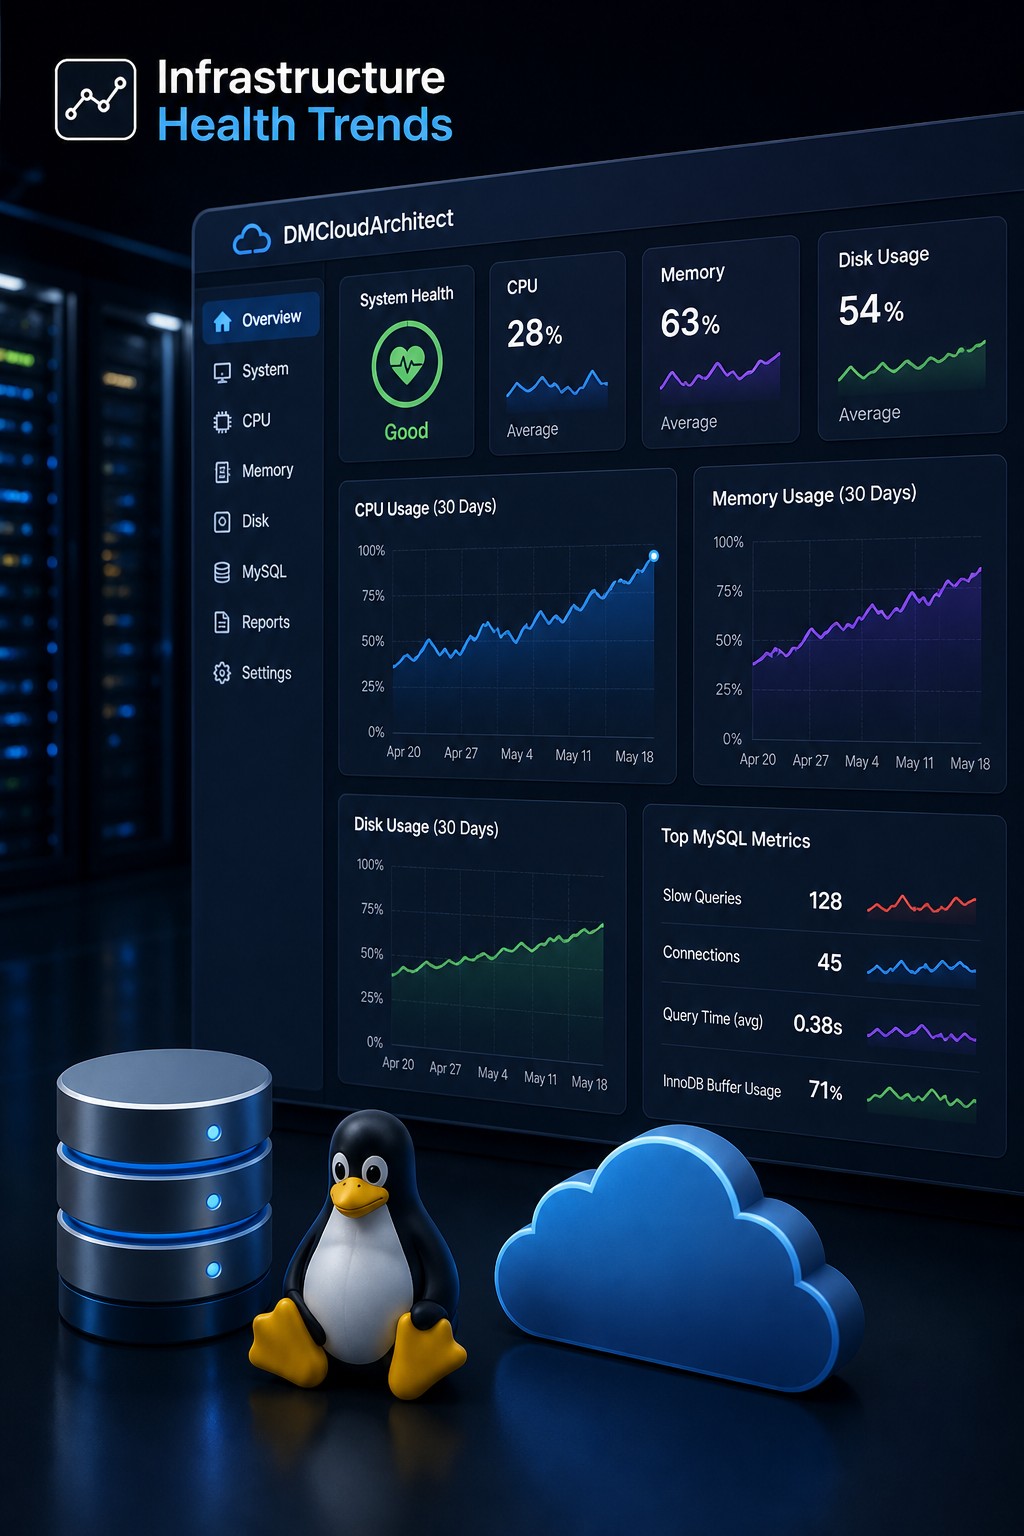
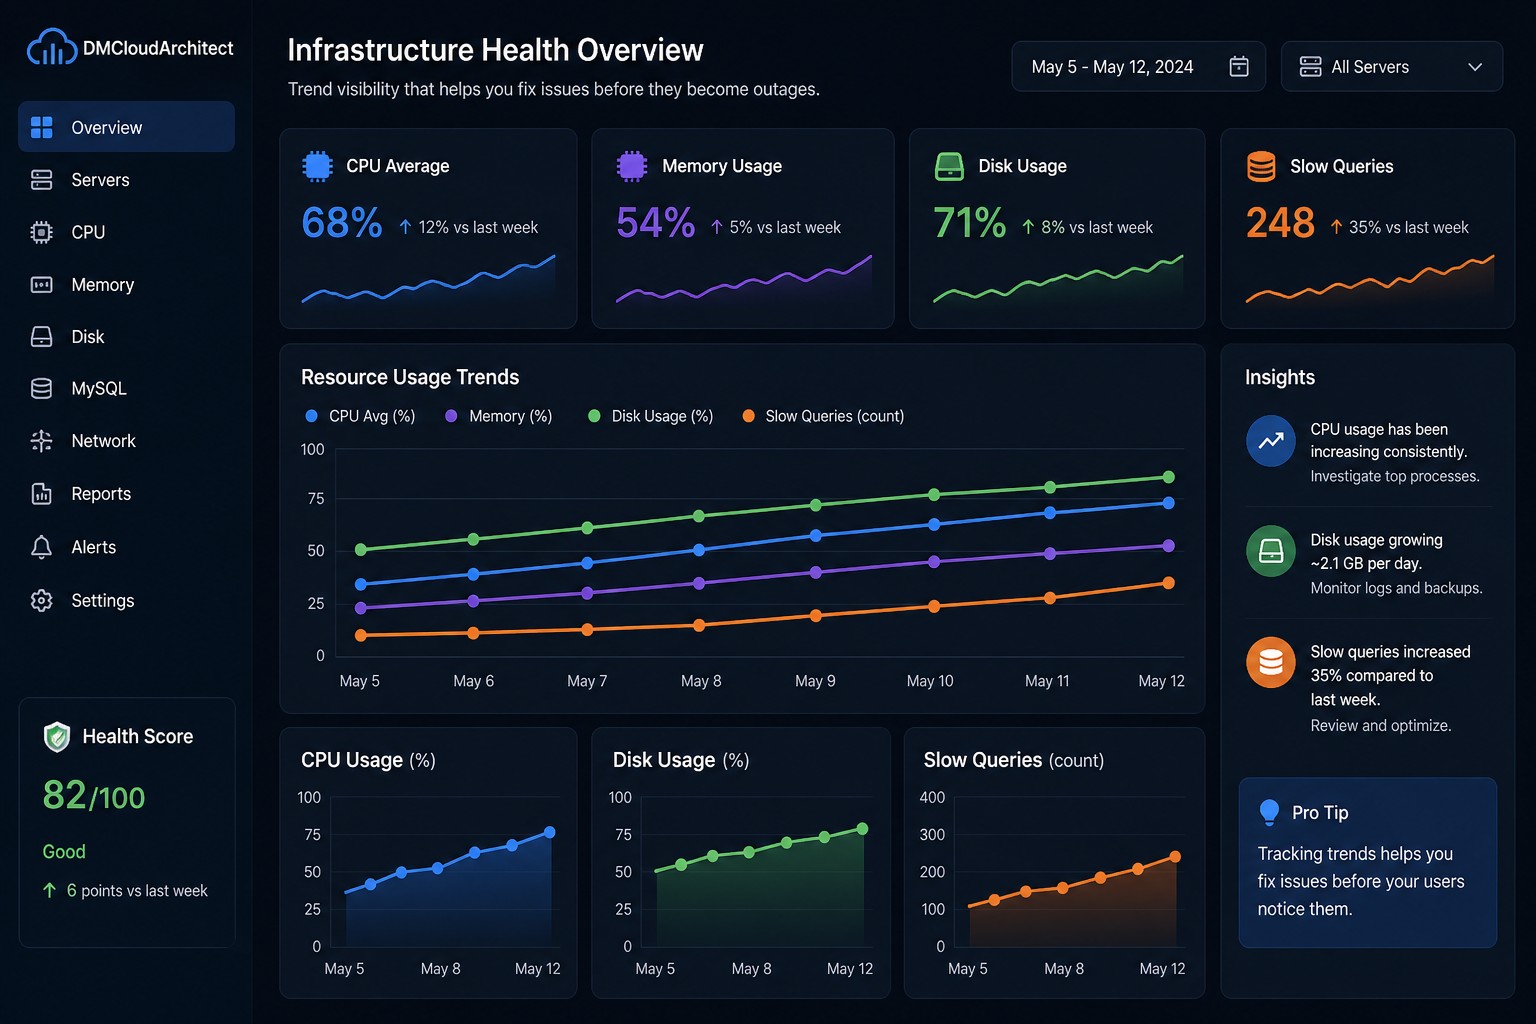
Better yet, store this data and visualize it. A simple graph showing disk usage over time is often more valuable than real-time alerts.
Monitor Top Disk Consumers
Identify which directories are growing.
du -sh /* 2>/dev/null
This helps you quickly spot abnormal growth patterns.
Watch I/O Metrics Consistently
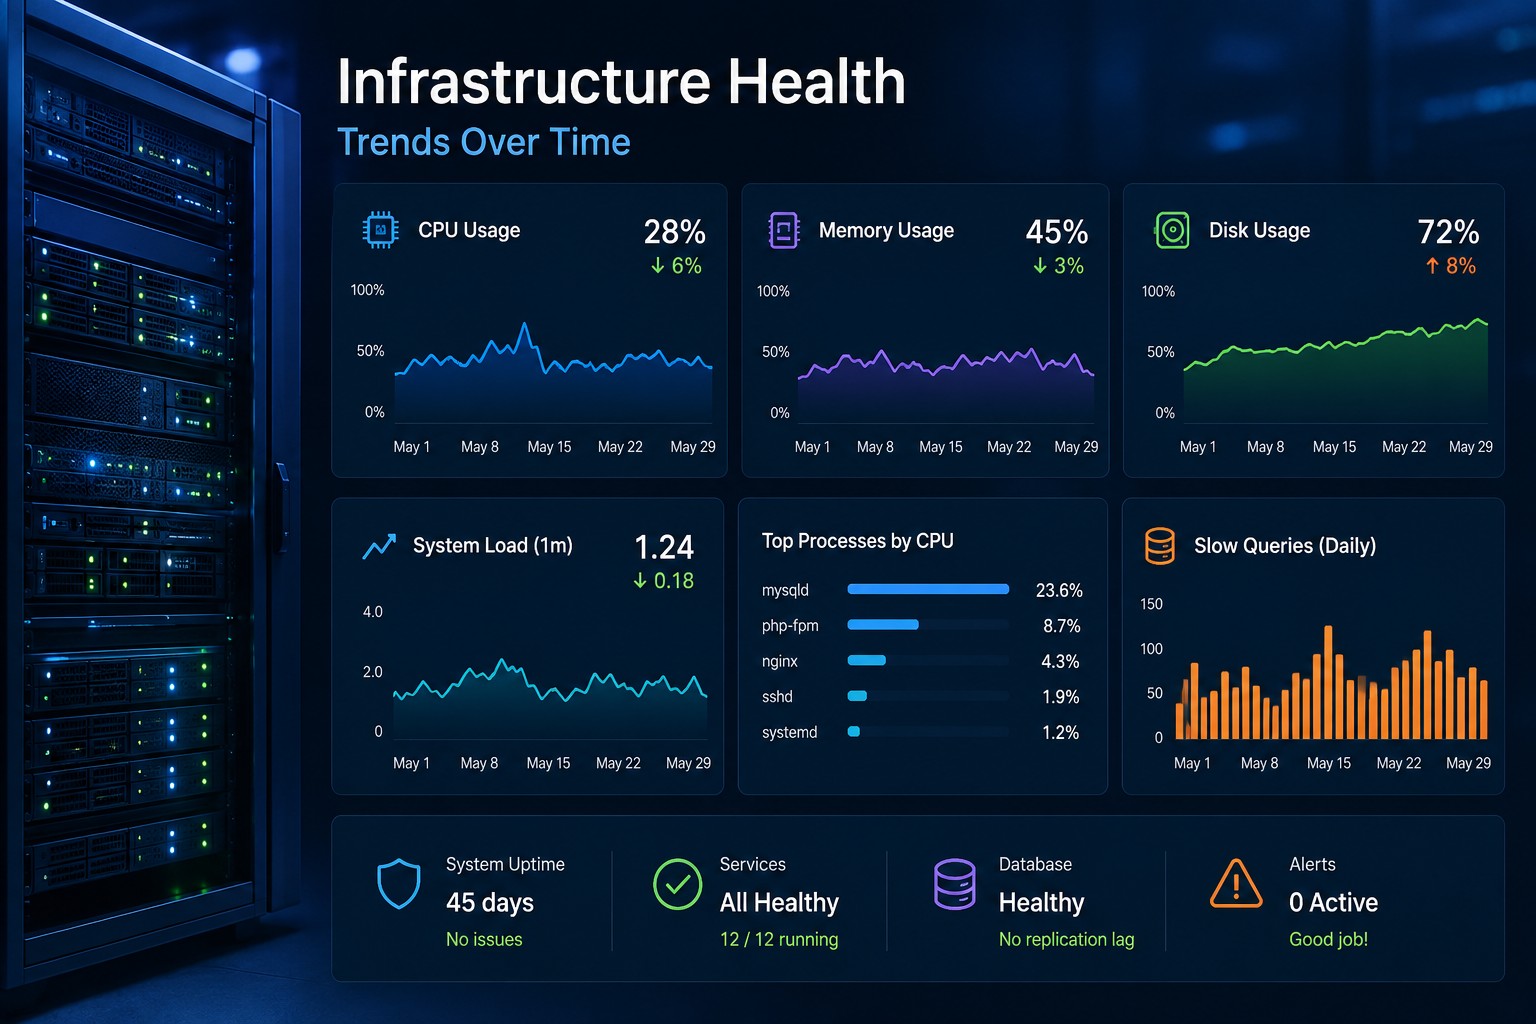
Tools like iostat, vmstat, or sar can reveal early signs of disk saturation. The key is consistency—look at trends, not snapshots.
Set Soft Thresholds, Not Hard Alerts
Instead of alerting at 95%, start observing at 70–80%. Not with noisy alerts, but with reports or dashboards that highlight systems trending toward risk.
Real-World Example: Preventing a Disk Full Outage
Let’s say you’re running a small application server. Everything looks fine—until one day, writes start failing.
After investigation, you find the disk is full due to log accumulation.
But if you had been tracking disk usage trends, you would have seen:
- Disk usage increasing 2–3% daily
- Log directory growing faster than usual
- No cleanup or rotation in place
This is exactly how you prevent disk full outages on a server—by identifying the pattern early, not reacting to the failure.
Shift from Alerts to Visibility
Most monitoring tools will alert you when it's already too late. But early detection is about seeing the story your infrastructure is telling over time.
Instead of chasing alerts, you build a clear picture:
- Which systems are slowly filling up?
- Which disks are under increasing pressure?
- Where are small issues turning into big ones?
This is where lightweight, trend-based reporting becomes far more useful than traditional alerting.
Summary
Detecting storage issues early in Linux isn’t about adding more alerts. It’s about understanding how your disks behave over time and catching small problems before they grow.
When you focus on trends—usage growth, I/O patterns, and disk pressure—you can prevent outages instead of reacting to them.
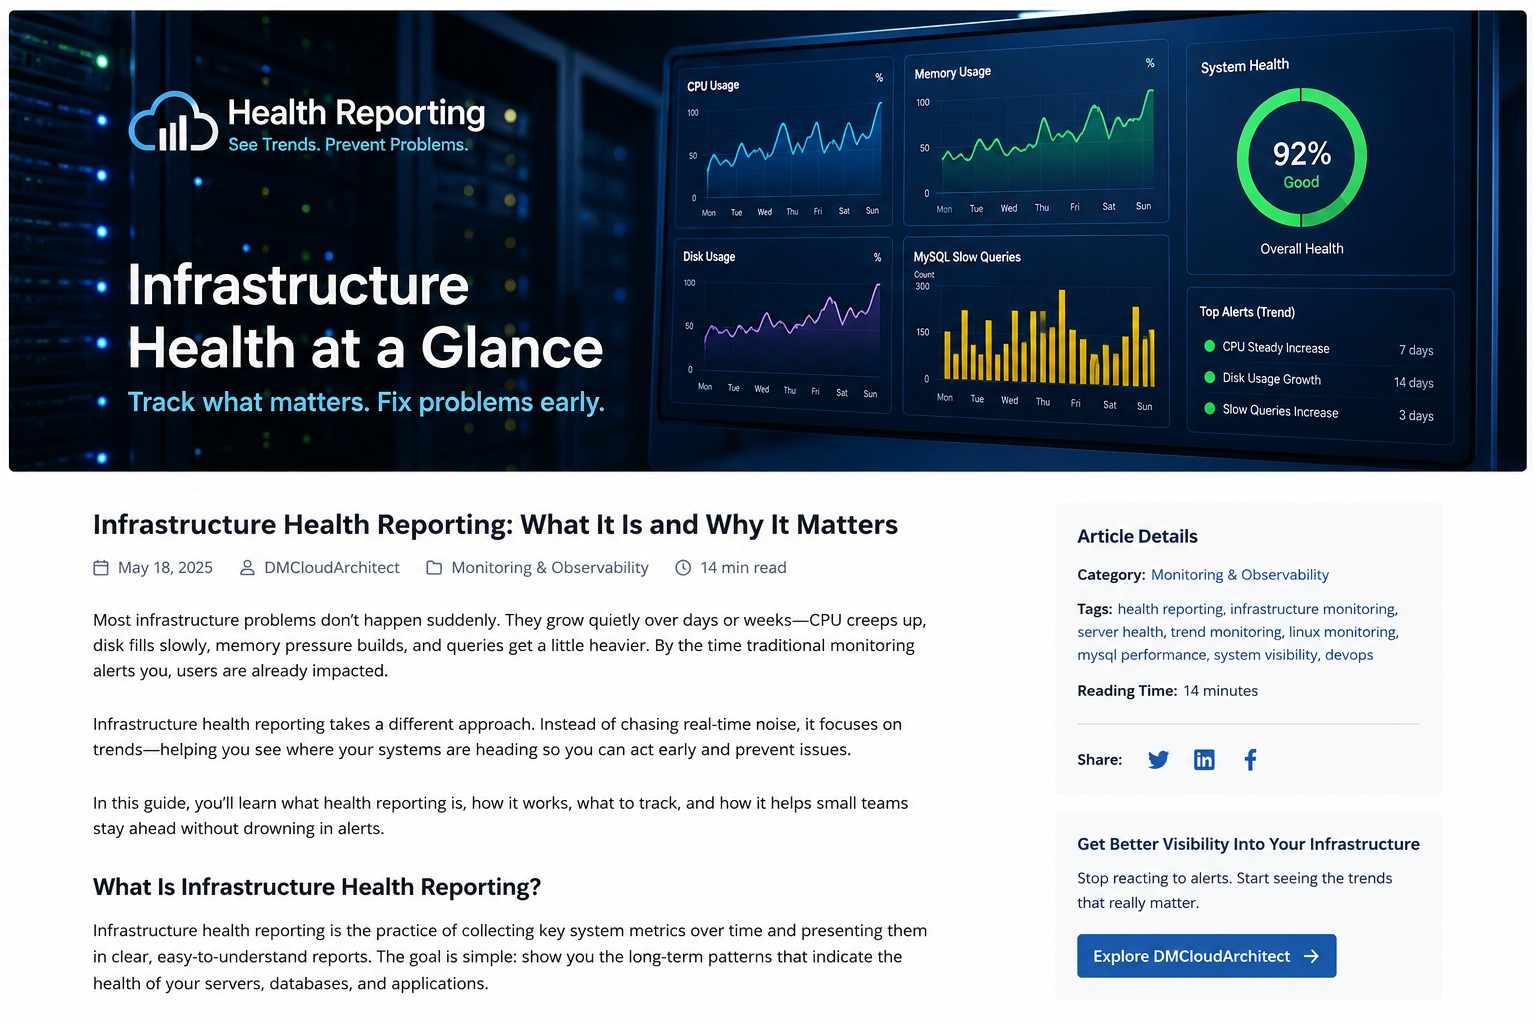
If you want a simpler way to see these patterns across your systems, take a look at Infrastructure Health Reporting. It helps you spot slow-moving issues before they turn into real problems.