Most Linux monitoring setups start simple—and then slowly turn into something noisy, heavy, and difficult to maintain. You add one tool for CPU, another for disk, maybe something for MySQL, and before long you’re dealing with dashboards you barely check and alerts you start ignoring.
Here’s the thing: you don’t need more monitoring. You need better visibility. And that’s exactly where lightweight linux monitoring comes in.
Why Lightweight Monitoring Matters
Traditional linux server monitoring tools are built for scale and complexity. They assume large teams, constant tuning, and a tolerance for alert fatigue. But if you're managing a handful of servers—or even a growing infrastructure—you probably need something different.
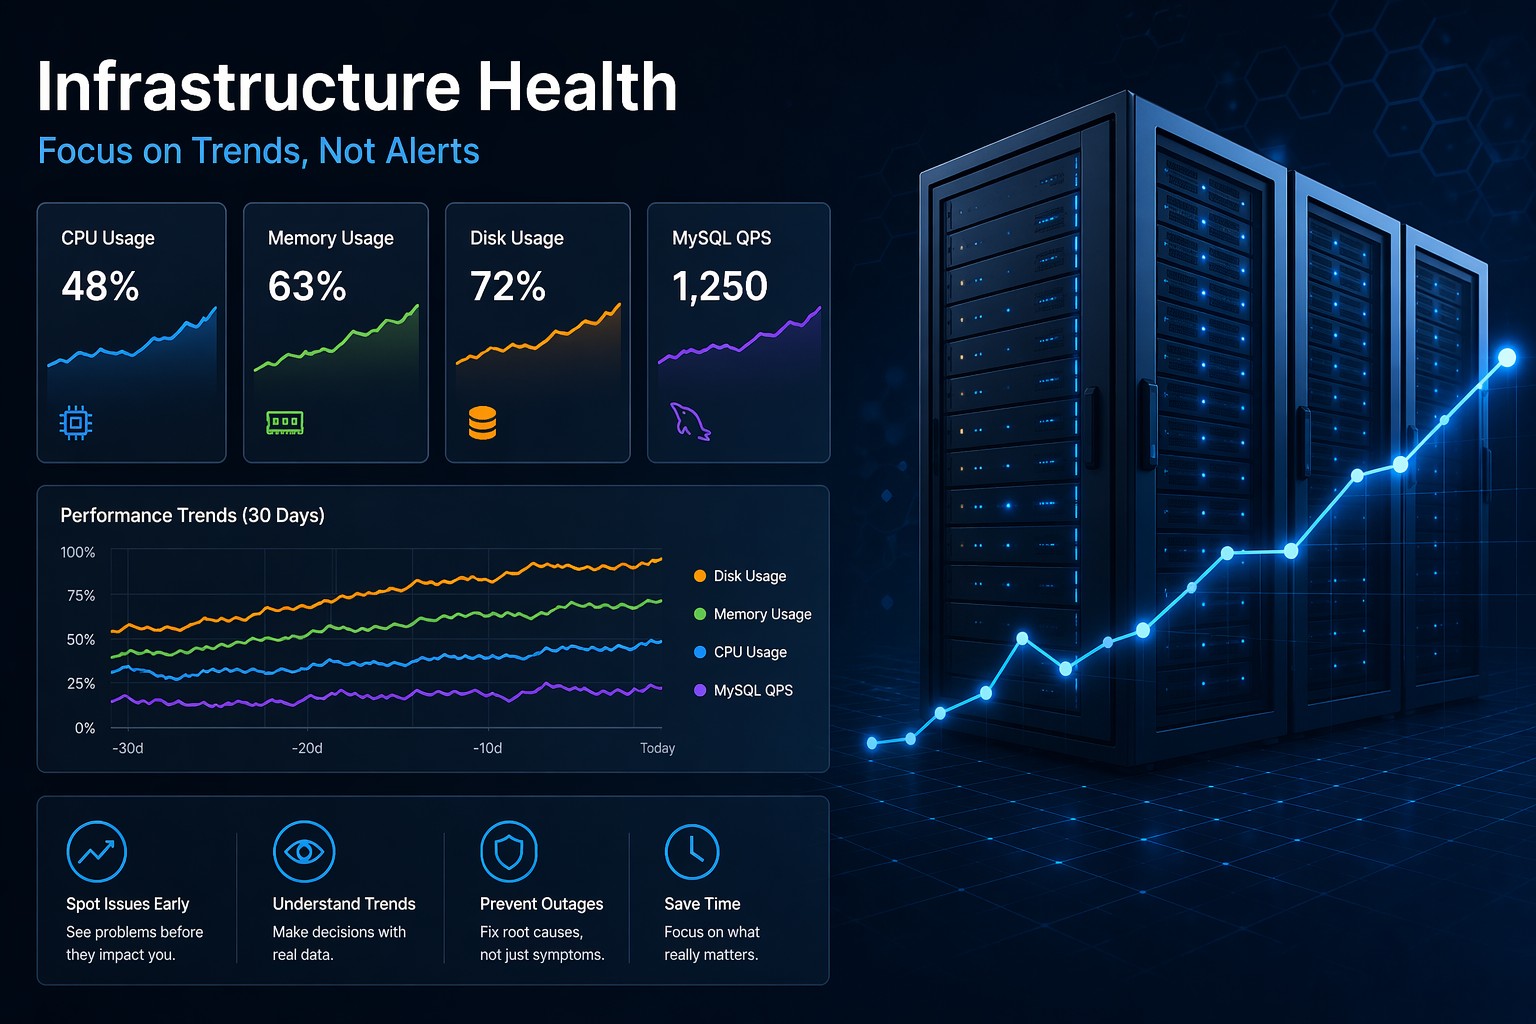
A lightweight approach focuses on trends instead of constant alerts. Instead of reacting to spikes, you start seeing patterns. And those patterns are what actually prevent outages.
What “Lightweight” Really Means
Lightweight doesn’t mean limited. It means focused.
- Minimal resource usage
- Simple deployment and maintenance
- Clear, readable metrics
- Trend-based visibility over time
So instead of monitoring everything in real time, you monitor what matters—and how it changes.
Core Metrics You Should Track
A simple linux monitoring setup should still cover the essentials. The difference is how you interpret them.
CPU Usage Over Time
A spike isn’t always a problem. But a steady upward trend? That’s where things get interesting.
For example, if your CPU baseline slowly rises week over week, it could indicate background jobs growing, inefficient queries, or scaling issues.
Memory Consumption
Memory issues rarely appear suddenly. They build up—like a slow leak. Watching trends helps you catch processes that gradually consume more RAM.
Disk Usage
Disk space is one of the easiest failures to predict. If you track daily growth, you can estimate when you’ll run out—well before it becomes critical.
MySQL and Application Behavior
Instead of focusing only on query speed, look at how query volume and slow queries evolve over time. A gradual increase is often a signal before performance drops.
How to Build a Simple Monitoring Setup
You don’t need a full observability stack to get started. In fact, keeping things simple often gives you better clarity.
- Collect basic metrics
Use lightweight linux monitoring tools or scripts to capture CPU, memory, disk, and key service stats. - Store data over time
Even basic logging or time-series storage is enough. The goal is historical visibility. - Visualize trends
Focus on simple graphs. You don’t need dozens of panels—just a few that clearly show direction. - Review weekly
This is where most setups fail. Monitoring only works if you actually look at it.
Real-World Example
Imagine a small production server running a web app.
Everything looks fine day-to-day. CPU spikes occasionally, but nothing alarming. Then over a few weeks, CPU usage starts creeping up—from 20% baseline to 40%, then 60%.
No alerts are triggered because nothing crosses a hard threshold.
But if you were tracking trends, you’d immediately see something changing. Maybe a new feature introduced inefficient queries. Maybe traffic increased slowly.
This is the difference between reactive monitoring and proactive visibility.
Common Mistakes to Avoid
- Overcomplicating the stack – More tools don’t equal better insight
- Relying only on alerts – Alerts tell you when it’s already too late
- Ignoring historical data – Trends are where the real signals live
- Not reviewing metrics regularly – Visibility without action is useless
So What Does This Mean in Practice?
Simple linux monitoring isn’t about doing less—it’s about focusing on what actually helps you make decisions.
You want to know:
- Is CPU usage growing over time?
- Is disk filling faster than expected?
- Are slow queries increasing week by week?
Those are the signals that matter.
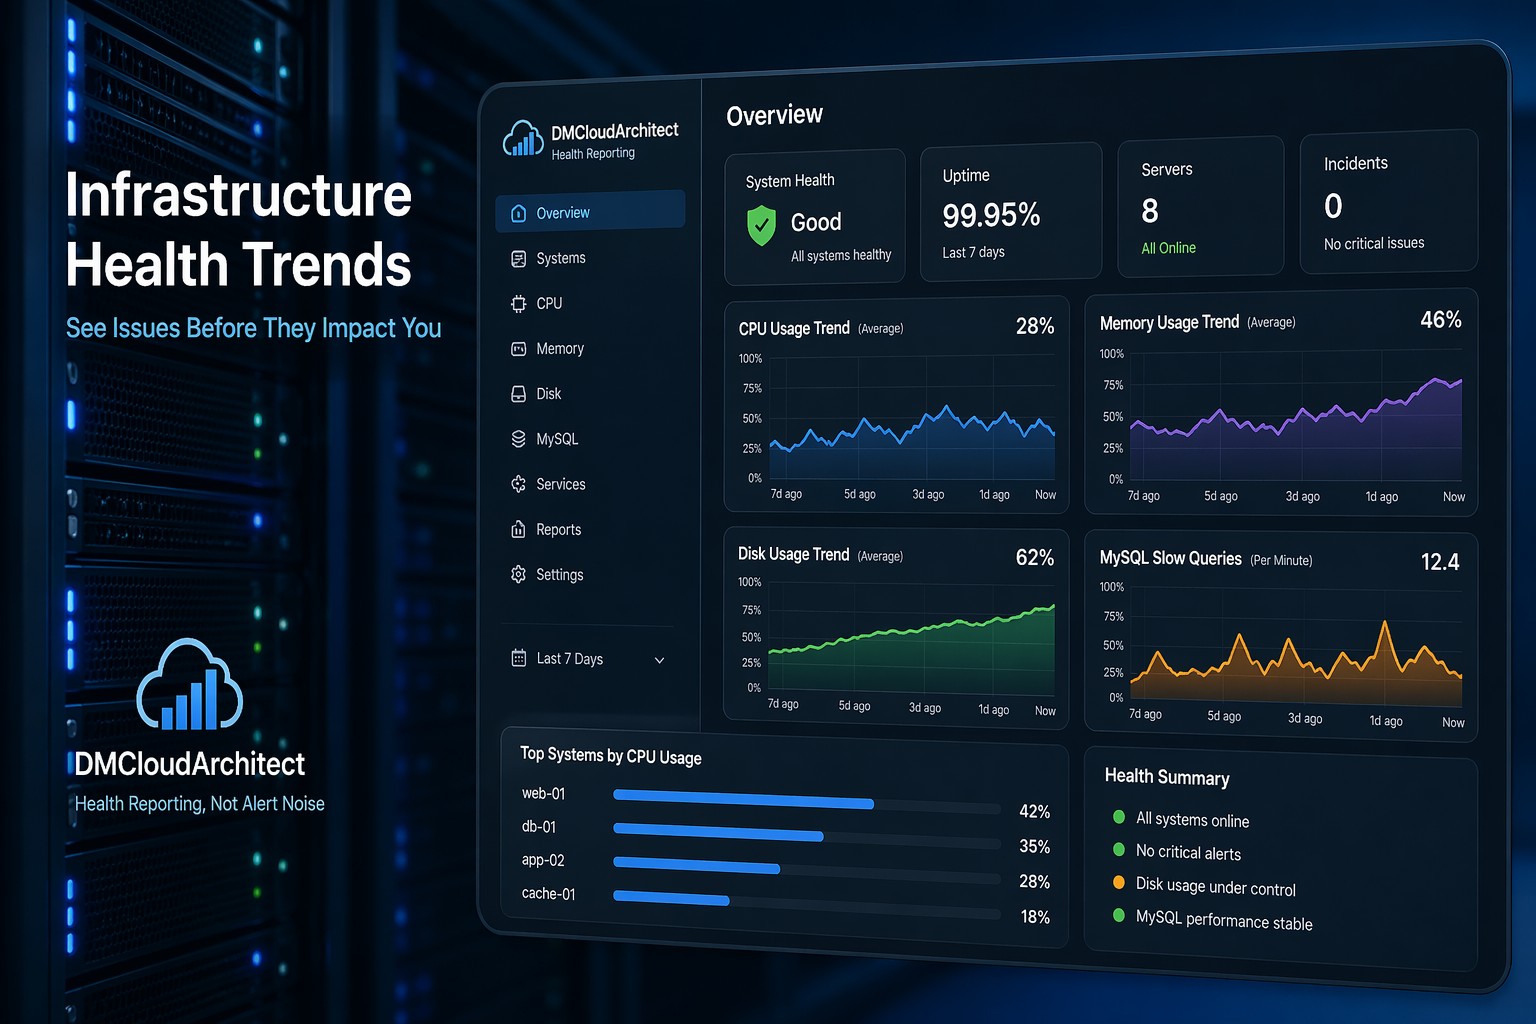
Summary
Lightweight linux monitoring gives you clarity without complexity. Instead of chasing alerts, you start understanding how your systems behave over time—and that’s what helps you stay ahead of problems.
If you want a clearer way to monitor linux server health without building a heavy stack, take a look at Infrastructure Health Reporting. It’s designed to show you trends that actually matter—so you can make better decisions before issues turn into outages.