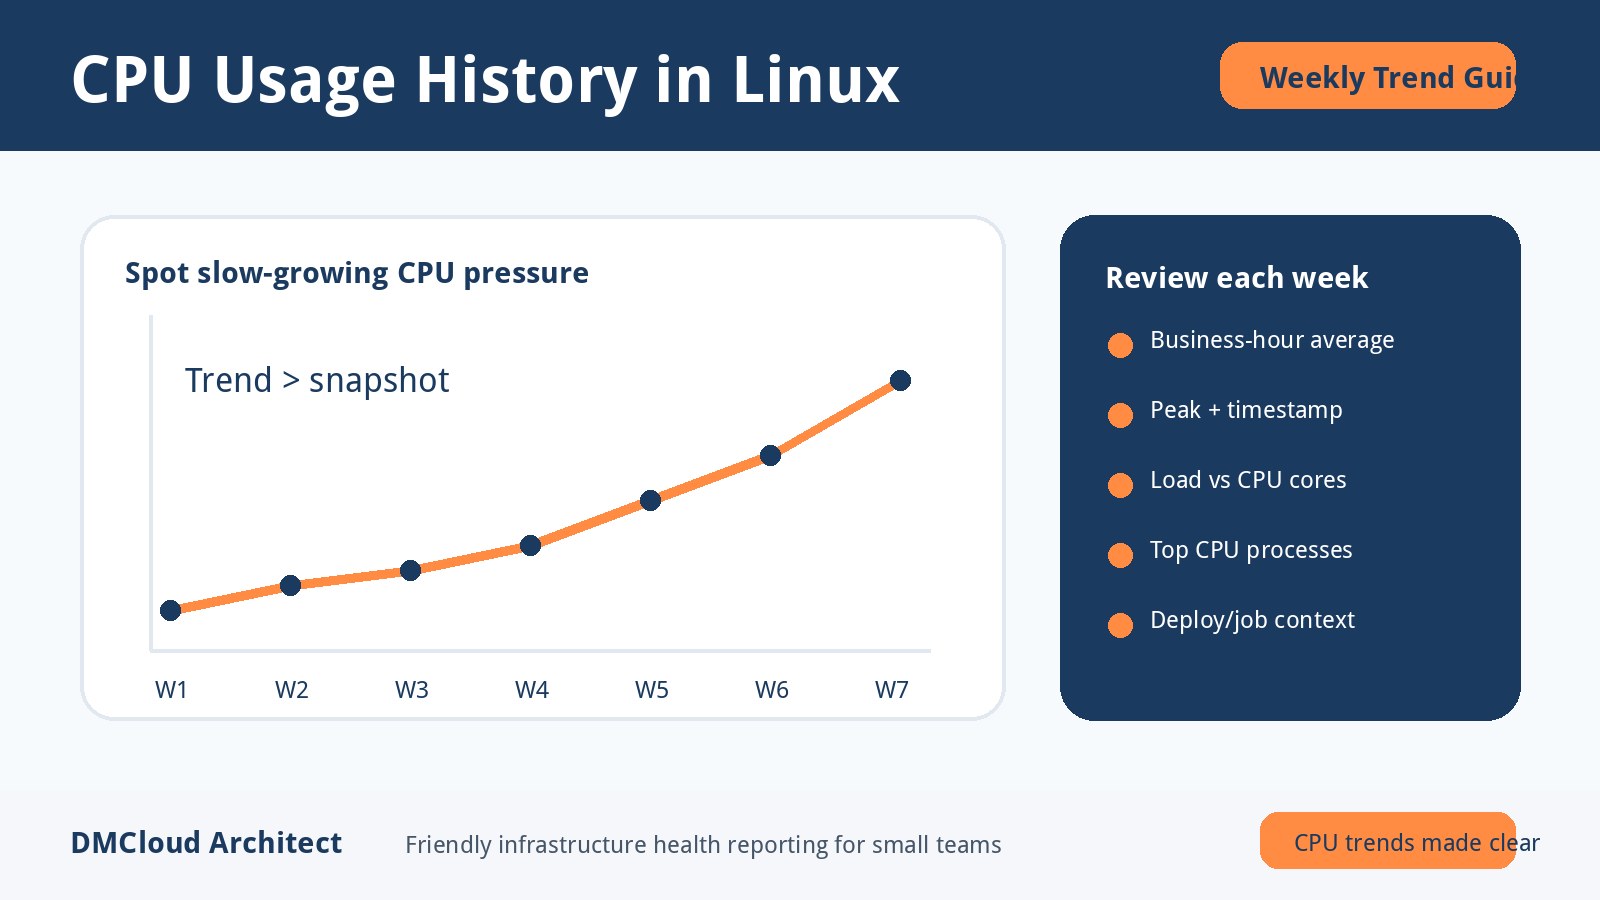
CPU usage history in Linux is one of the simplest ways to catch a server that is quietly getting busier every week. A single high CPU spike may be harmless, but a steady rise in baseline utilization often points to slower queries, growing traffic, batch jobs that overlap, or background services that need attention. For small teams, the goal is not to stare at charts all day; it is to keep enough history that the weekly review tells a clear story.
Why CPU history matters more than a one-time snapshot
Commands like top and htop are great when you are already logged in and investigating a live problem. The weakness is that they show what is happening right now, not whether the server has been drifting toward trouble for the last month. CPU usage history helps answer better operational questions: is Monday morning busier than it used to be, did a deployment increase idle load, and are recurring jobs competing with customer traffic?
That historical view also helps you avoid overreacting. A short burst to 95% CPU during a backup, report export, or package update is usually less concerning than a web server that now sits at 70% all afternoon. Trends give context, and context turns noisy metrics into useful decisions.
Start with the CPU signals Linux already gives you
You do not need a large monitoring stack to begin. A practical baseline can come from a few built-in or commonly available tools:
uptimefor load averages over 1, 5, and 15 minutes.toporhtopfor live process-level CPU usage.psfor scriptable process snapshots.sarfrom thesysstatpackage for historical CPU, load, and run queue data.- application logs for matching CPU changes to deployments, cron jobs, imports, or traffic spikes.
If sysstat is available in your environment, sar is usually the easiest place to start because it was built for this kind of lightweight history. On many distributions you can enable collection, then review daily CPU patterns with commands such as sar -u and sar -q.
A simple weekly CPU trend workflow
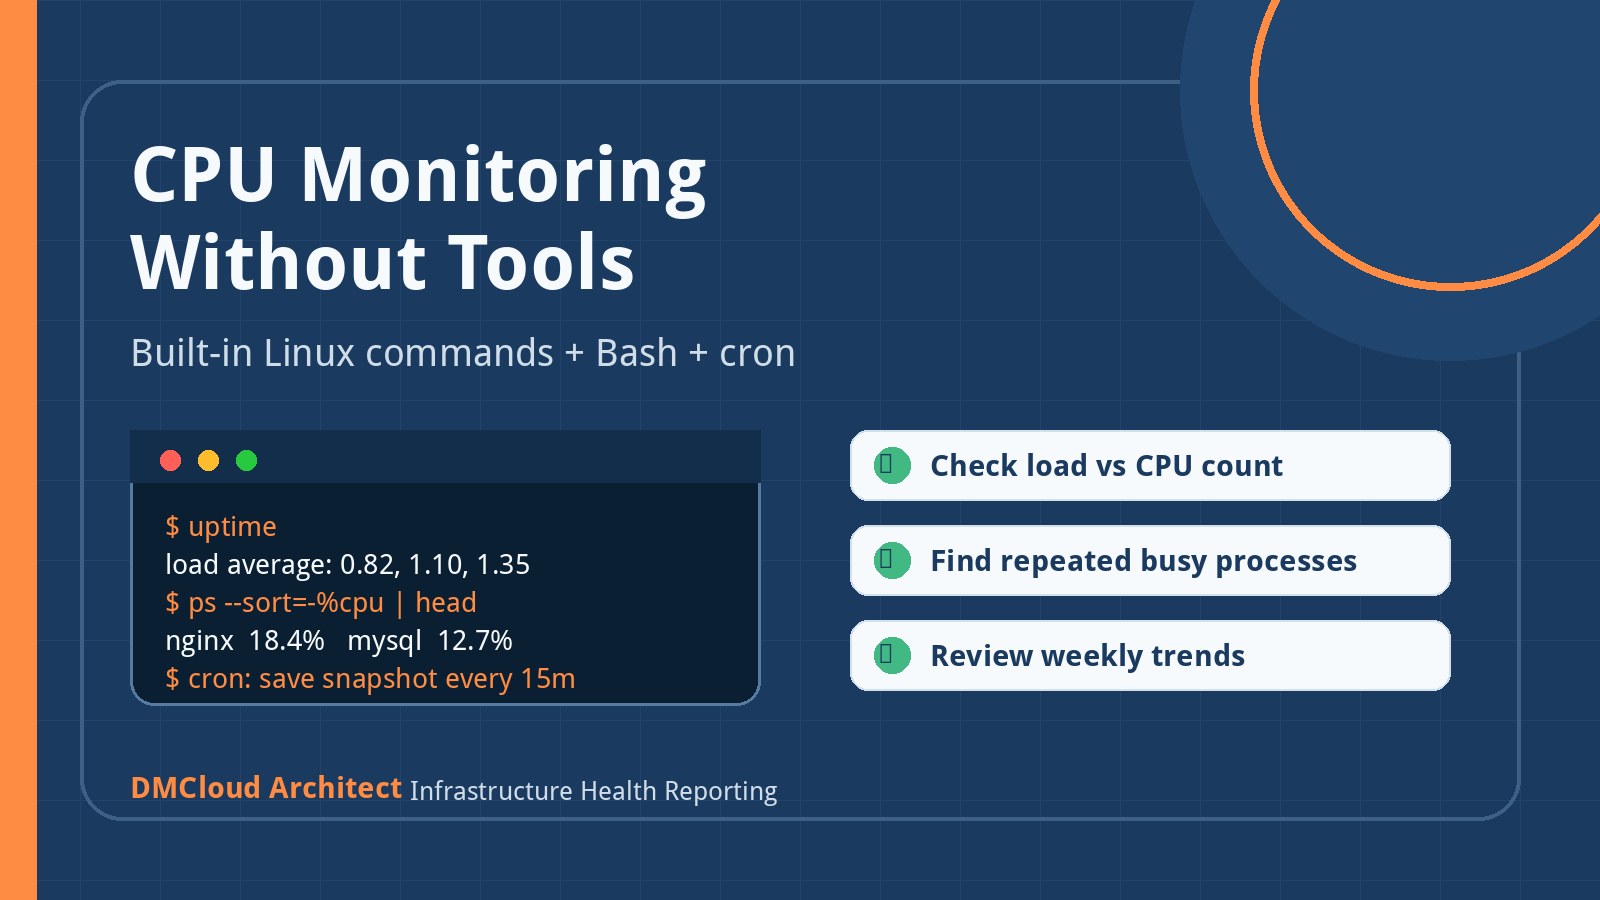
For a small Linux fleet, keep the workflow boring and repeatable. Once per week, capture a short summary for each production server:
- Average CPU utilization during business hours.
- Peak CPU utilization and when it happened.
- Load average compared with the number of CPU cores.
- Top recurring CPU-heavy processes.
- Any deployment, import, backup, or batch job that explains the movement.
This review is intentionally simple. The value comes from comparing this week with the last several weeks. If the database server moved from a calm 20% average to 55% every weekday afternoon, that deserves investigation even if no alert has fired yet.
Example cron-friendly CPU snapshot
The following lightweight pattern creates a basic trail you can inspect later. It is not a replacement for full monitoring, but it is enough to start building CPU usage history in Linux when you need something practical today.
#!/usr/bin/env bash
set -euo pipefail

log_dir="/var/log/server-health"
mkdir -p "$log_dir"
log_file="$log_dir/cpu-snapshot-$(date +%F).log"

{
  echo "timestamp=$(date -Is)"
  echo "uptime=$(uptime)"
  echo "top_processes="
  ps -eo pid,comm,pcpu,pmem --sort=-pcpu | head -n 8
  echo "---"
} >> "$log_file"
Run it from cron every 15 or 30 minutes, then roll the results into a weekly review. If you already use sar, use the script only as a friendly supplement for process context.
How to read CPU trends without chasing false alarms
CPU trend monitoring works best when you separate normal patterns from meaningful changes. Ask these questions before making infrastructure changes:
- Is the load sustained? A five-minute spike is different from four hours of elevated CPU.
- Is the run queue growing? High CPU plus a rising run queue can mean work is waiting for CPU time.
- Did response time change too? CPU is more important when users or jobs are getting slower.
- Is one process responsible? A single runaway process needs a different fix than broad traffic growth.
- Did the pattern start after a known change? Compare CPU history against deploys, imports, and scheduled tasks.
This keeps the conversation practical. Sometimes the answer is tuning a query, moving a batch job, or limiting a worker pool. Other times it is time to resize the server. The history helps you choose with confidence.
When CPU history should trigger action
Consider creating a follow-up task when one of these patterns appears:
- Business-hour CPU baseline increases for two or more weeks in a row.
- Load average regularly exceeds available CPU cores during normal traffic.
- The same process appears at the top of CPU snapshots every day.
- CPU peaks line up with customer complaints, slow dashboards, or delayed jobs.
- Backup, reporting, or import jobs overlap with peak customer usage.
None of these automatically means the server is failing. They are early warning signs that deserve a small, focused investigation before they become an incident.
Turn CPU history into a weekly operating habit
The best CPU usage history Linux workflow is the one your team will actually review. Keep the collection lightweight, summarize the trend in plain language, and connect it to business impact: slower pages, delayed jobs, missed reports, or a server that may need more capacity soon. Over time, those weekly notes become a useful record of why infrastructure decisions were made.
If you want this kind of trend review without building and maintaining the reporting process yourself, DMCloud Architect can help. Get the free starter plan for weekly infrastructure health reports and start seeing CPU, disk, memory, and availability patterns before they turn into urgent problems.