When a server runs out of disk space, the first visible symptom is often the worst possible one: failed deployments, stopped databases, broken backups, or a website that suddenly cannot write sessions and cache files. The good news is that Linux already includes the commands needed to spot most disk pressure early. The practical trick is knowing which command to run, what the output means, and how to turn one-off checks into a repeatable weekly habit.
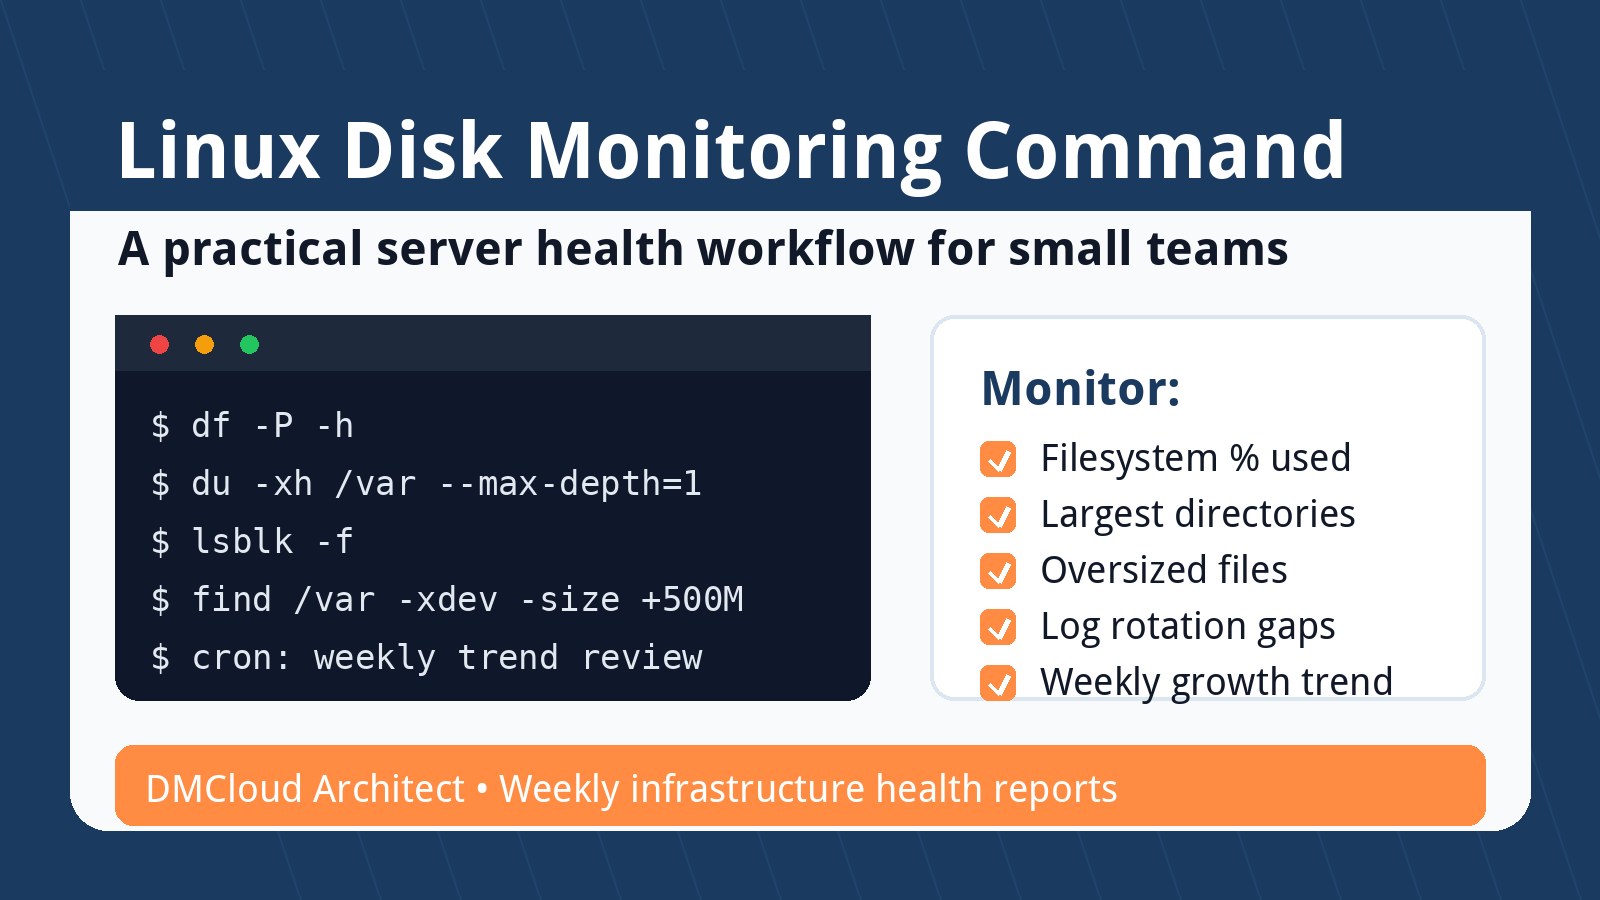
This guide explains a friendly, production-ready linux disk monitoring command workflow for developers, small business owners, and lean operations teams. Instead of chasing a single magic command, use a small toolkit: df for filesystem capacity, du for directory growth, lsblk for mount layout, find for oversized files, and a simple Bash script that can run from cron. Together, these checks help you catch disk risk before it becomes a late-night emergency.
Start with df for filesystem capacity
The fastest first check is:
df -h
The -h flag prints human-readable sizes, which makes it easy to scan usage across mounted filesystems. For most operational reviews, pay close attention to the Use% column and the mount points that matter to your application, such as /, /var, /home, database volumes, backup volumes, and any application-specific data mount.
A useful production threshold is not one-size-fits-all, but many small teams start with a warning around 80% and an urgent review around 90%. The real question is growth rate. A filesystem at 78% that grows 1% per month is very different from one at 78% that grows 5% per day after a logging bug.
Use df with stable output for scripts
For scripts, avoid parsing the pretty table by hand when possible. This command keeps the output easier to read and compare:
df -P -h
The -P option uses POSIX output format, which reduces line-wrapping surprises. If you want machine-readable byte counts instead of human-readable values, use:
df -P --output=source,fstype,size,used,avail,pcent,target
This gives a consistent view of the device, filesystem type, size, used space, available space, percentage used, and mount point. It is a strong baseline for a weekly server health report because it answers the most important question quickly: which filesystems are getting close to capacity?
Use du to find what is growing
Once df shows a filesystem is under pressure, du helps you find the directories responsible. A practical starting point for the root filesystem is:
sudo du -xh / --max-depth=1 2>/dev/null | sort -h
The -x flag keeps the scan on one filesystem, which prevents accidentally walking into mounted backups, network shares, or application data volumes. The --max-depth=1 option keeps the first pass readable. From there, drill into the largest directory:
sudo du -xh /var --max-depth=1 2>/dev/null | sort -h
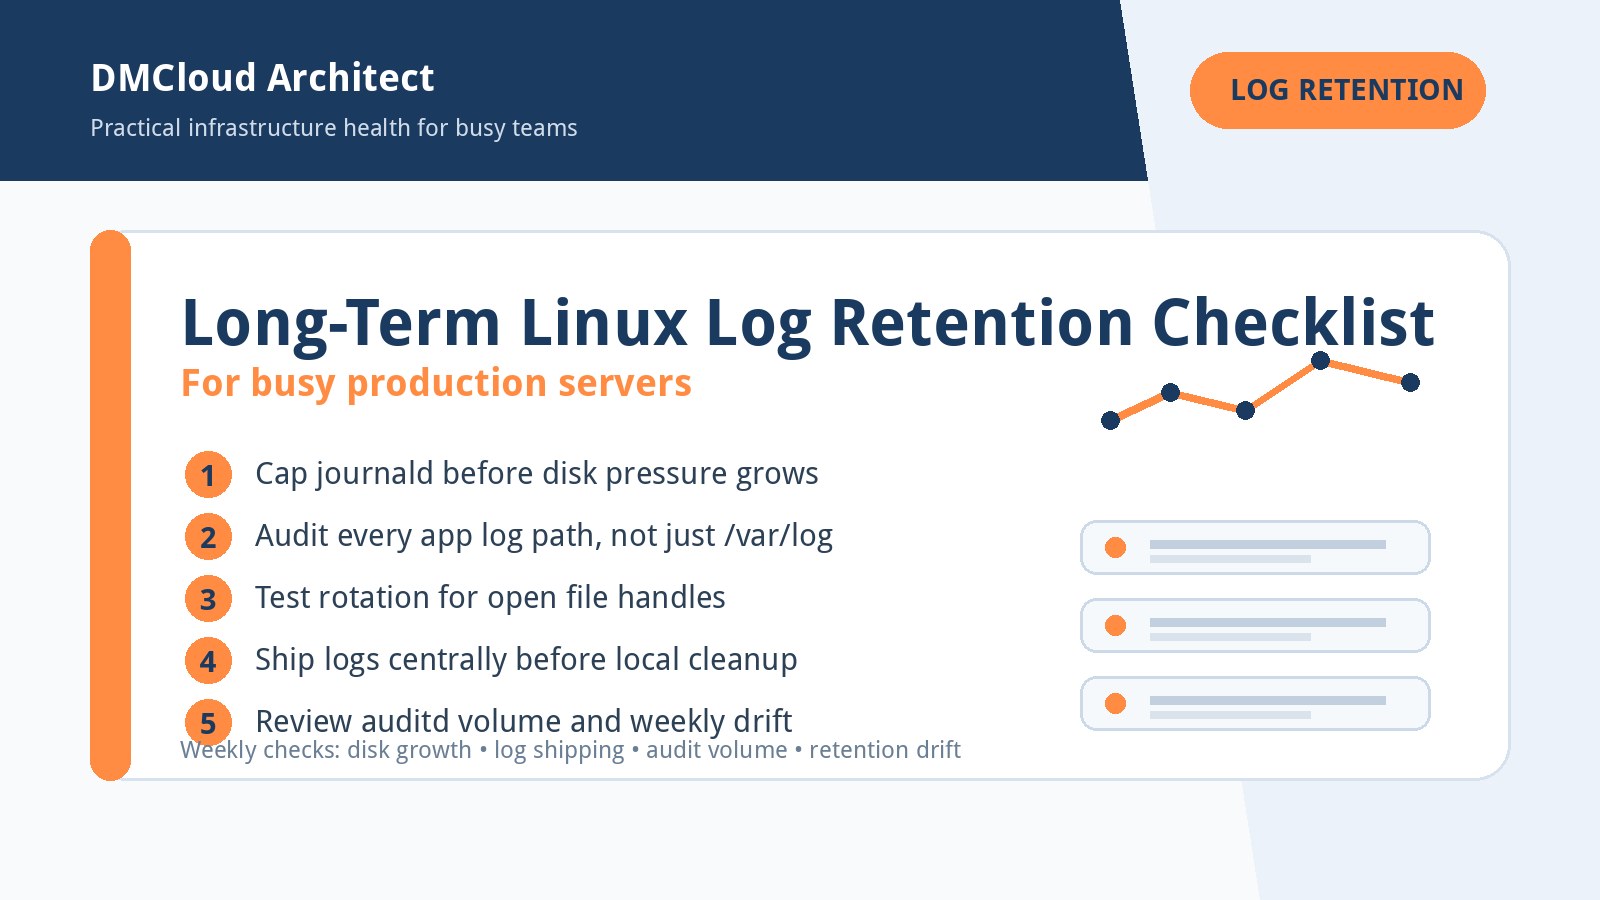
sudo du -xh /var/log --max-depth=1 2>/dev/null | sort -h
This is often where real problems appear: logs that are not rotating, package caches that were never cleaned, old release directories, temporary exports, failed backup files, or database dumps left behind after maintenance.
Confirm the disk layout with lsblk
Before changing anything, confirm what is mounted where:
lsblk -f
This command shows block devices, filesystem types, labels, UUIDs, and mount points. It helps prevent a common mistake: cleaning the wrong volume because the team assumed /var/lib/mysql, /var/www, or a backup directory lived on the root filesystem when it actually used a separate mount.
For small teams, this is also a helpful documentation command. Save the output during onboarding, migration planning, or quarterly reviews so the team understands which disks support which services.
Find oversized files without scanning forever
Sometimes one file causes most of the problem. Use find to locate unusually large files in the directories that matter:
sudo find /var -xdev -type f -size +500M -printf '%s %p\n' 2>/dev/null | sort -n
Adjust +500M for your environment. On a small virtual machine, 500 MB may be a lot. On a database or media server, you may start at several gigabytes. The goal is not to delete files blindly; it is to identify candidates for review: runaway logs, forgotten archives, core dumps, old backups, or generated reports that were never expired.
When you find a large file, check the owner and service before removing it. Deleting an open log file may not release space until the process restarts or reopens the file. For logs, it is usually safer to fix rotation, truncate intentionally, or restart the relevant service during a controlled window.
A simple Bash disk monitoring script
Here is a small script that checks mounted filesystems and prints a warning when usage reaches a threshold. It is intentionally simple enough to read during an incident:
#!/usr/bin/env bash
set -euo pipefail

THRESHOLD="80"

while read -r filesystem size used avail percent mountpoint; do
  usage="${percent%%%}"
  if [[ "$usage" =~ ^[0-9]+$ ]] && (( usage >= THRESHOLD )); then
    printf 'WARNING: %s is %s full (%s used, %s available) on %s\n' \
      "$mountpoint" "$percent" "$used" "$avail" "$filesystem"
  fi
done < <(df -P -h | awk 'NR > 1 {print $1, $2, $3, $4, $5, $6}')
Save it as something like /usr/local/sbin/check-disk-usage.sh, make it executable, and run it manually first:
sudo chmod +x /usr/local/sbin/check-disk-usage.sh
sudo /usr/local/sbin/check-disk-usage.sh
If the output is empty, no filesystem crossed the threshold. If a warning appears, treat it as a review signal, not an automatic delete instruction.
Run the check from cron
For basic cron disk monitoring on Linux, run the script once or twice a day and send output to the local mail system, a log file, or your monitoring collector. A simple root cron entry might look like this:
15 7 * * * /usr/local/sbin/check-disk-usage.sh
If your environment does not use local mail, redirect the output somewhere your team actually reviews:
15 7 * * * /usr/local/sbin/check-disk-usage.sh >> /var/log/disk-usage-check.log 2>&1
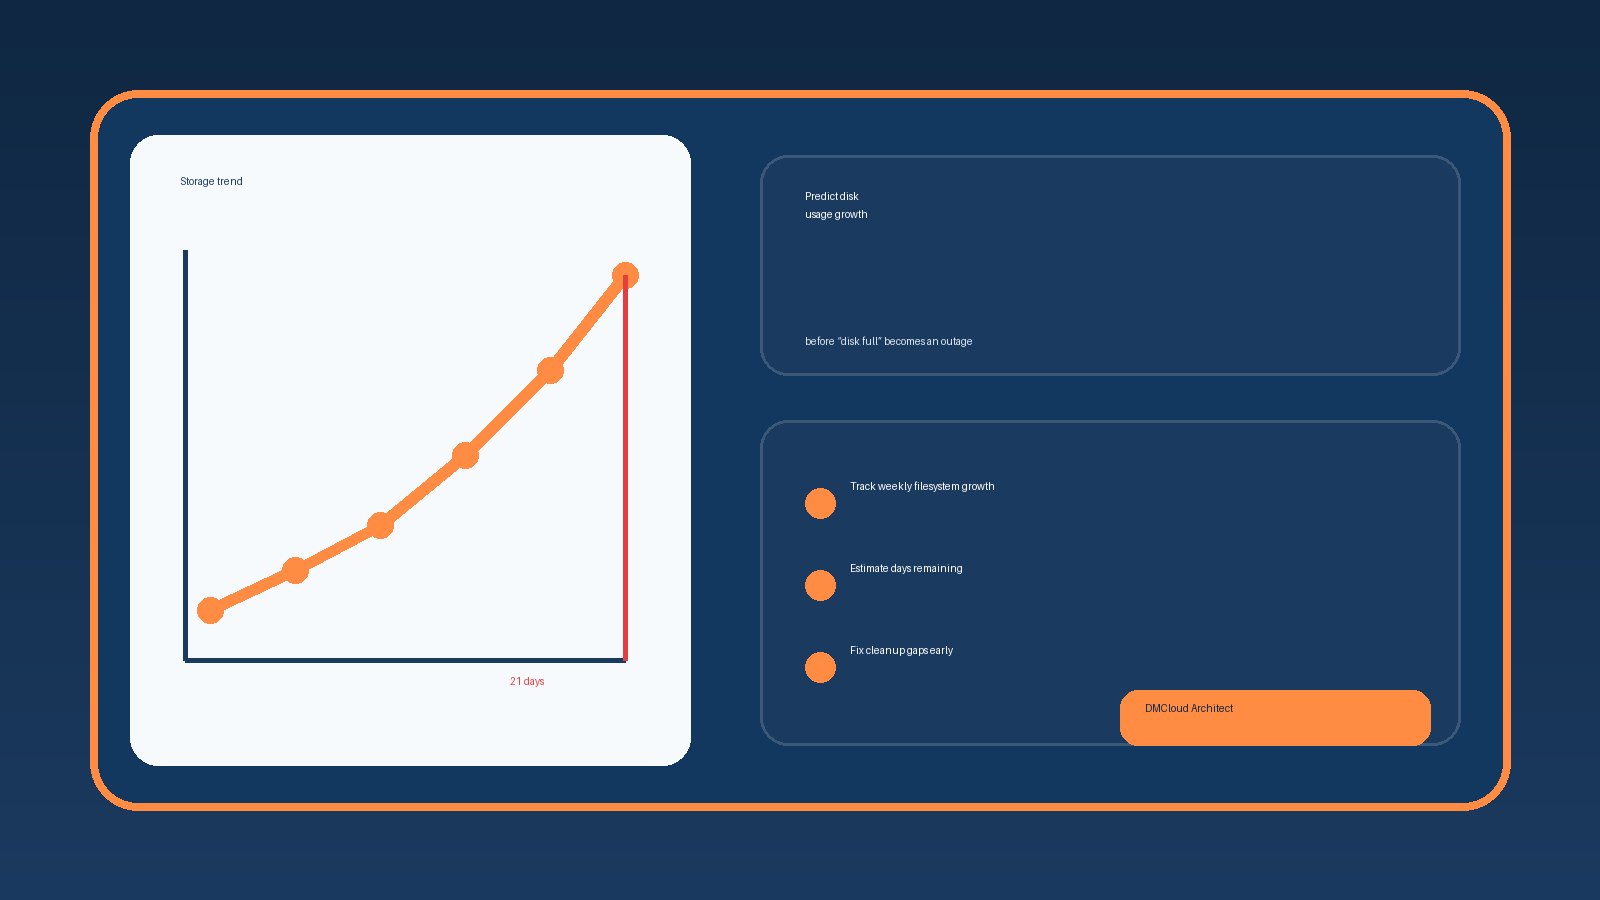
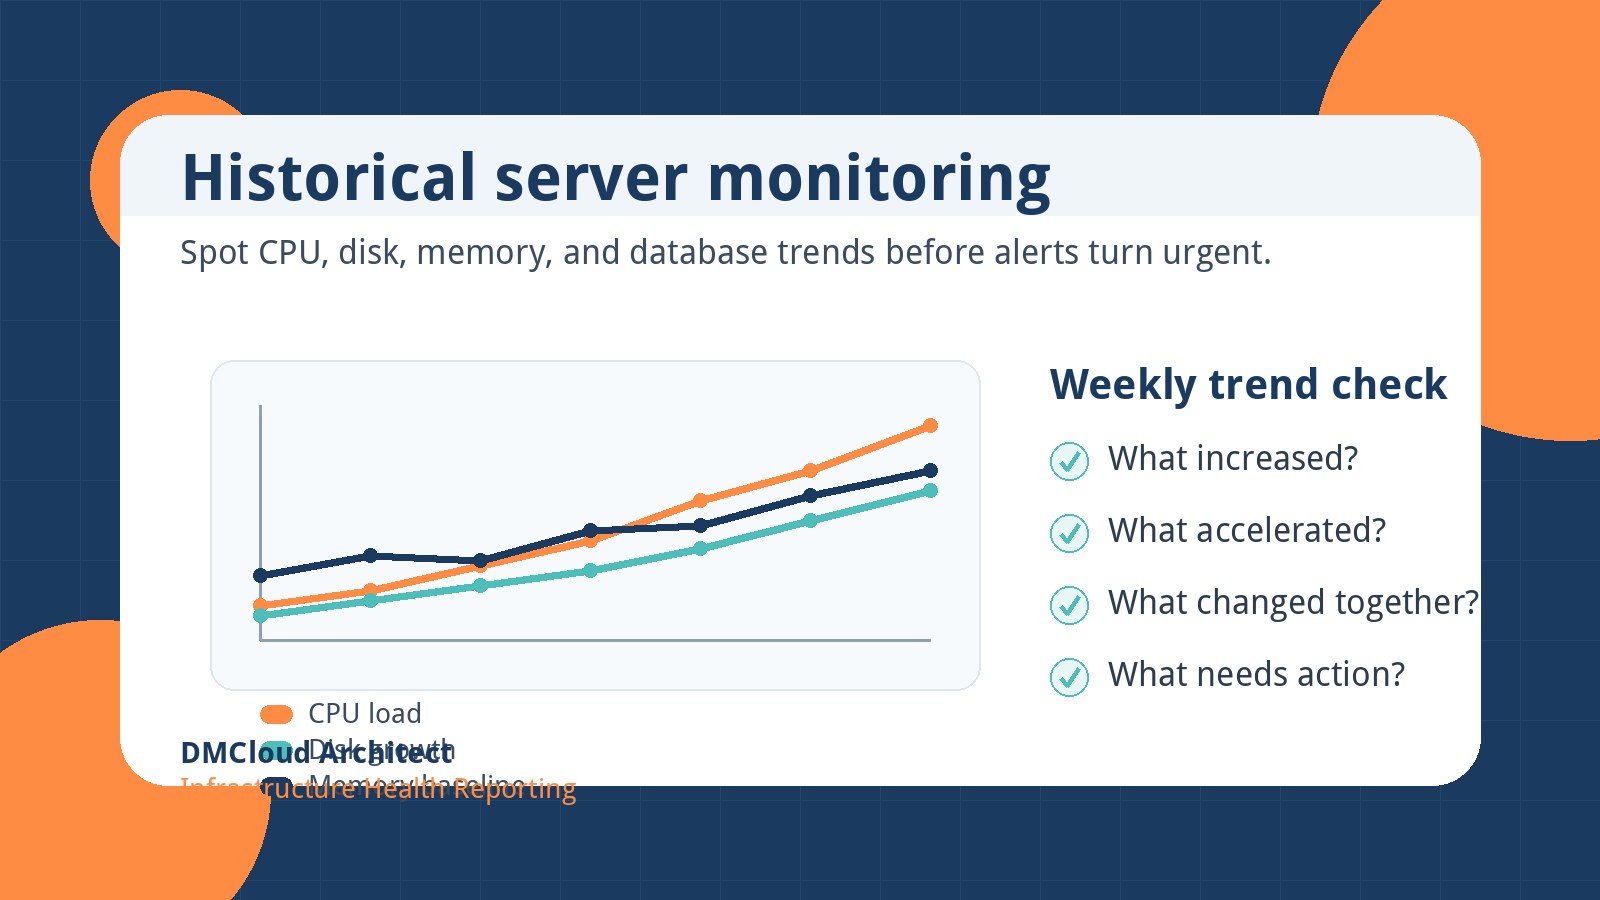
For better operations, pair this with a weekly review that captures both current usage and the change since last week. Disk usage is most useful when viewed as a trend. A filesystem that grows consistently deserves capacity planning; a filesystem that jumps overnight deserves investigation.
What to review when a disk warning appears
When the check reports high usage, use a calm sequence instead of jumping straight to deletion:
- Confirm the affected mount: Run
df -hand identify the exact filesystem under pressure. - Find the largest directories: Use
du -xhwith--max-depth=1and drill down gradually. - Look for recent growth: Check logs, deploy artifacts, cache directories, backup jobs, and database export locations.
- Check rotation: Review
/etc/logrotate.d/, journald limits, and application-specific log settings. - Plan cleanup safely: Confirm ownership, open file handles, service impact, and backup requirements before removing files.
This approach turns a warning into an actionable checklist. It also creates better notes for the next review, which is especially useful when one person manages infrastructure alongside development or client work.
Common disk monitoring mistakes to avoid
The first mistake is monitoring only the root filesystem. Many applications store critical data on separate mounts, and those mounts may fill while / looks healthy. Always review every production mount point that supports the service.
The second mistake is checking percentage without context. A 95% full archive volume may be acceptable if it is capped, immutable, and designed that way. A 75% full database volume may be risky if it grew from 50% in one week. Trend matters.
The third mistake is treating cleanup as the fix. Cleanup buys time, but the root cause may be missing log rotation, a runaway job, failed backup pruning, unexpected traffic, or an application bug. The best disk monitoring workflow points you toward the cause, not just the symptom.
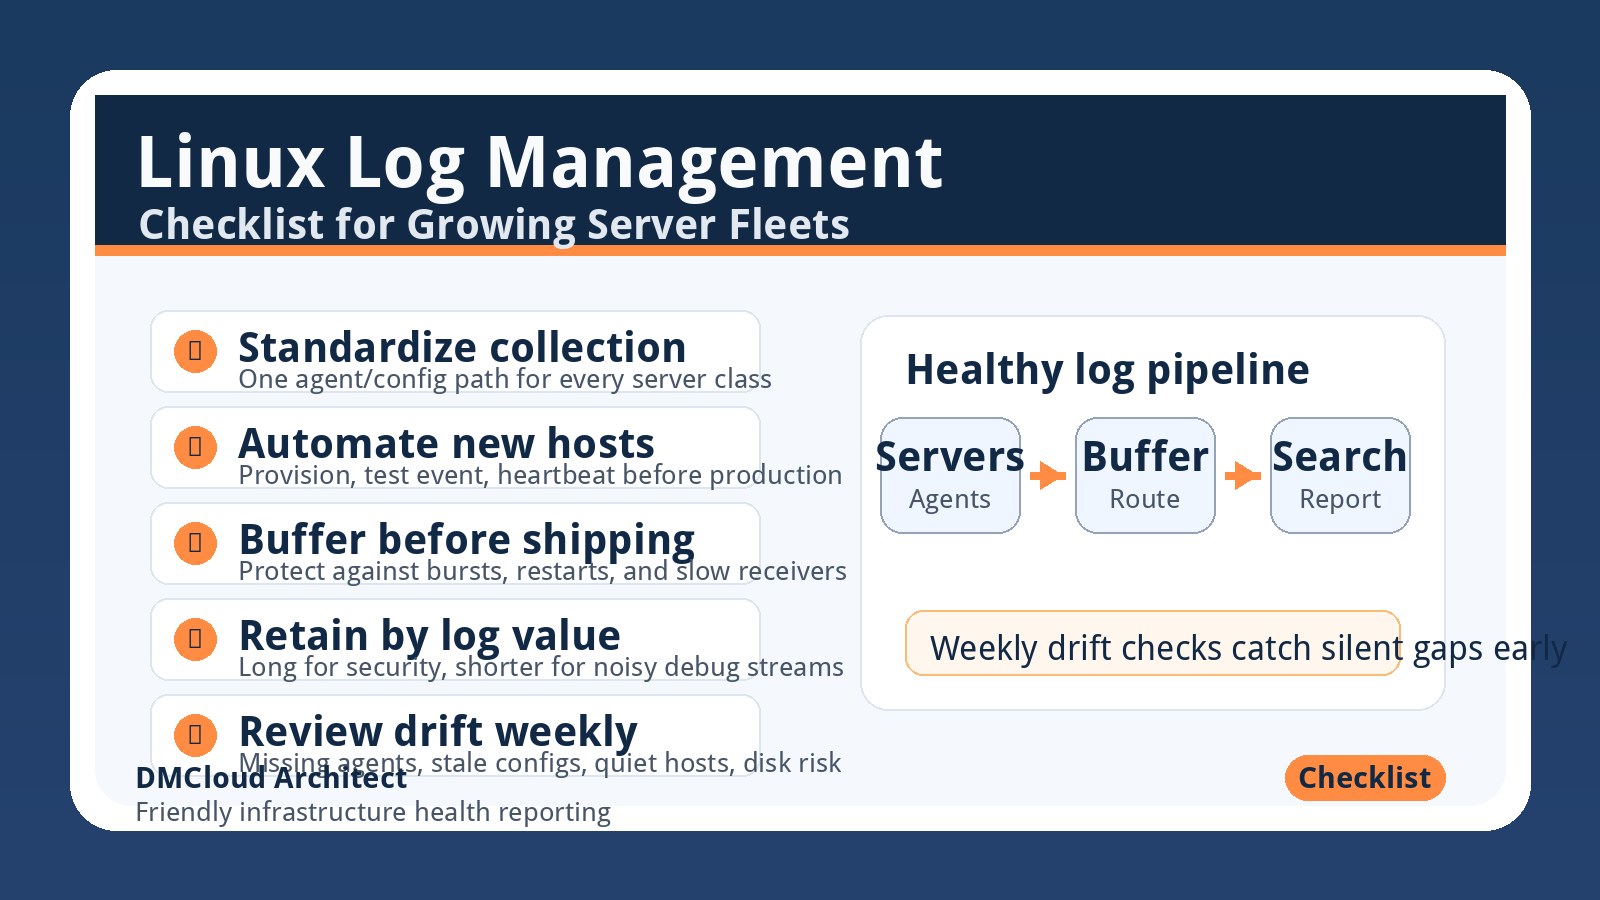
Turn commands into a weekly health habit
A good disk review does not need to be complicated. For each important server, capture filesystem usage, largest growth areas, any threshold warnings, and whether cleanup or capacity planning is needed. Over a month, those notes reveal patterns that one-off commands miss.
For small teams, this habit is often more valuable than adding another noisy alert. Alerts tell you something crossed a line. A weekly health review tells you which systems are drifting toward that line and why.
Want weekly infrastructure health checks without dashboard fatigue?
DMCloud Architect turns Linux and MySQL health signals into friendly weekly reports, including disk usage trends, capacity risks, service drift, and practical next steps for busy teams.
Get the free starter plan for weekly infrastructure health reports.