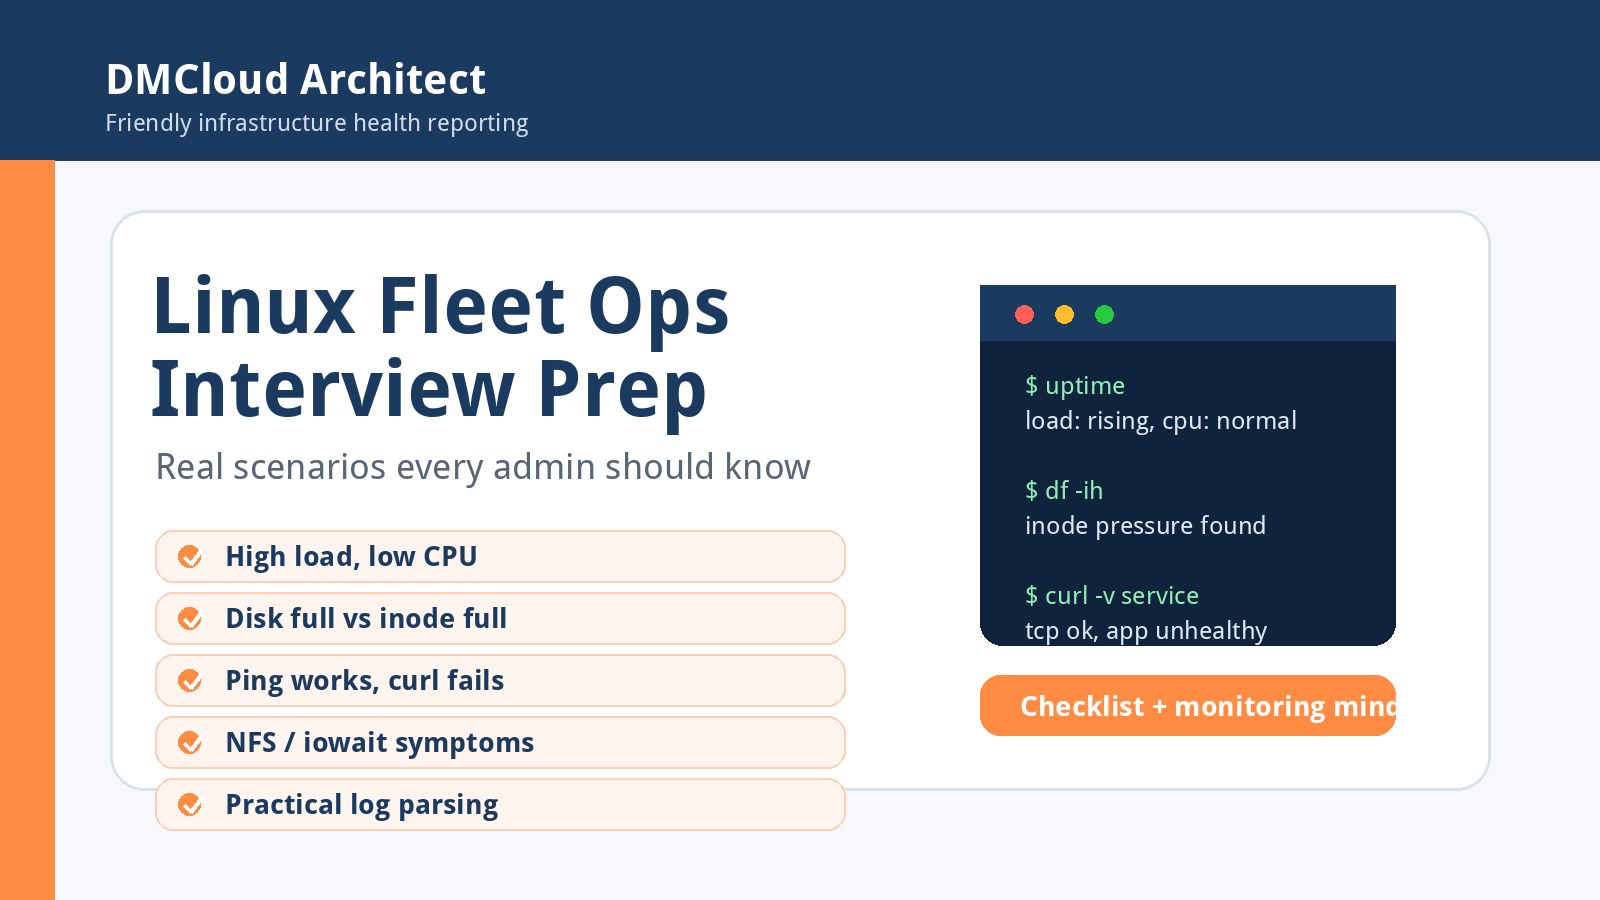
Early-career Linux and fleet operations interviews are usually less about reciting every flag for every command and more about showing that you can reason through a real system under pressure. The strongest preparation is scenario practice: what you check first, how you separate symptoms from causes, and how you communicate risk while you investigate.
This checklist is built for 0–18 month Linux systems, fleet operations, platform, and infrastructure roles. It focuses on practical linux server monitoring, troubleshooting, networking, storage, and scripting scenarios that come up in day-to-day operations. You do not need to sound like a senior SRE; you do need to show calm, structured thinking.
1. Practice a repeatable troubleshooting loop
Before memorizing individual scenarios, build a simple loop you can apply to any incident question:
- Clarify the symptom: who is affected, when it started, and whether the issue is intermittent or constant.
- Check recent change: deployments, config edits, package updates, reboots, cron jobs, storage changes, or firewall updates.
- Measure the system: CPU, load average, memory, swap, disk usage, inodes, network errors, service state, and logs.
- Narrow the blast radius: one host, one service, one subnet, one disk, one region, or the whole fleet.
- Take the safest next step: gather evidence before restarting things, and explain what you would avoid if customer impact is high.
In an interview, this structure matters as much as the exact command. A candidate who says “I would compare load, runnable processes, disk wait, and recent deploys before restarting the service” sounds more production-ready than someone who jumps straight to a random fix.
2. Linux scenarios with the highest return on practice
For early-career roles, prioritize scenarios that connect server health signals to user-facing symptoms. These are common, practical, and easy for interviewers to expand into follow-up questions.
Slow server or high load
Know the difference between high CPU usage and high load average. A high load with modest CPU can point to disk I/O wait, blocked processes, network filesystems, or uninterruptible sleep. Practice explaining how you would inspect process states, CPU wait, memory pressure, disk latency, and recent workload changes.
Disk full, inode exhaustion, and df vs du mismatch
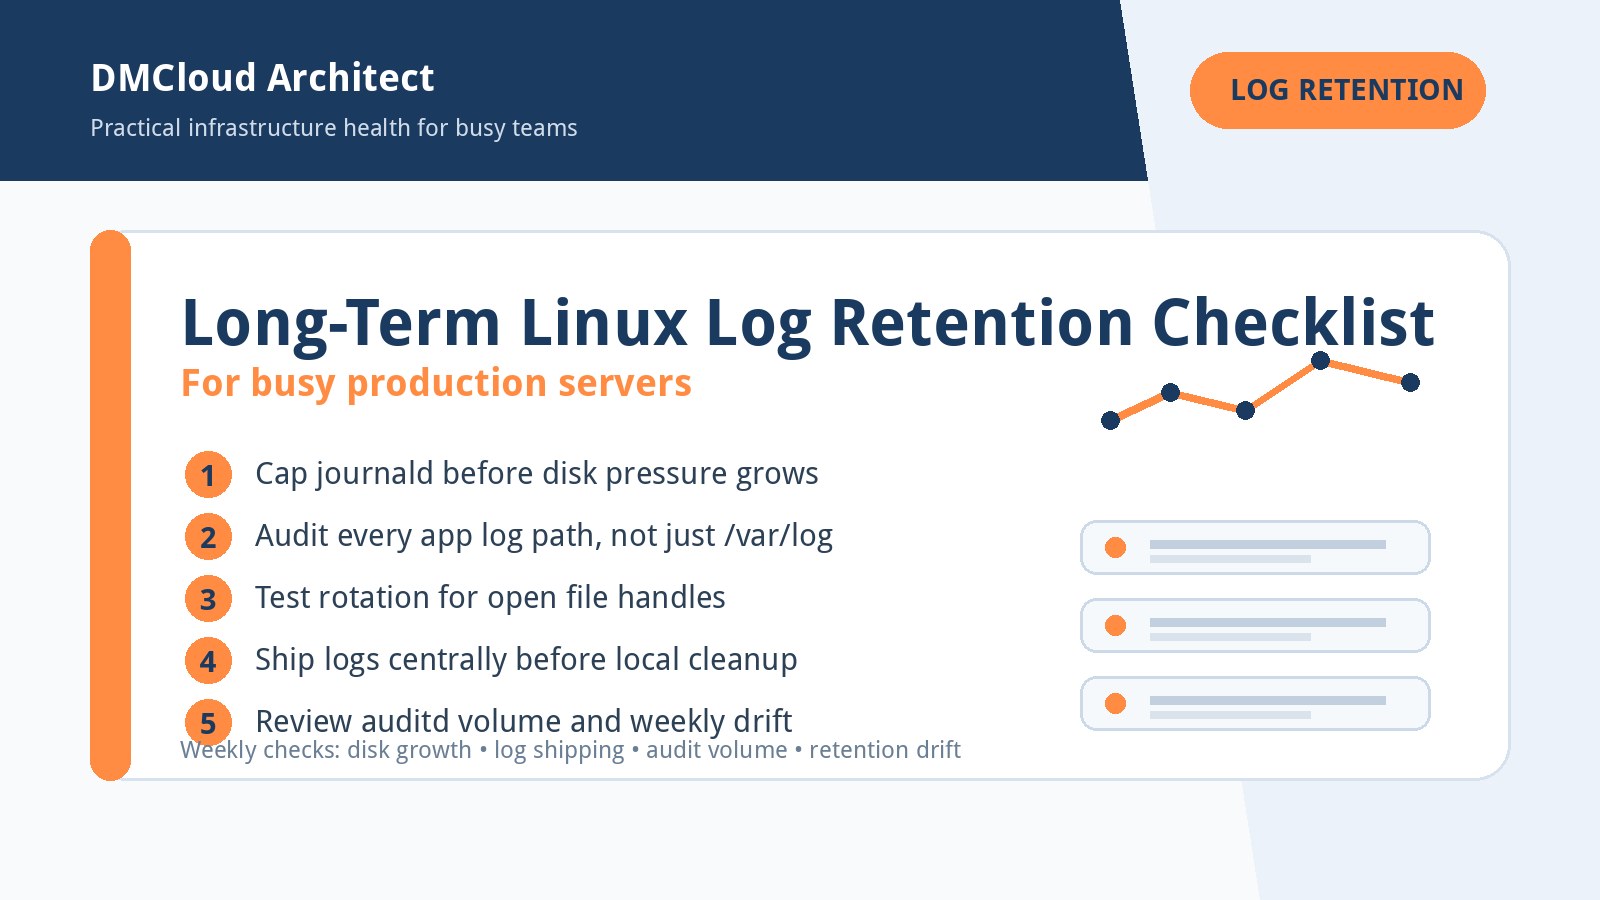
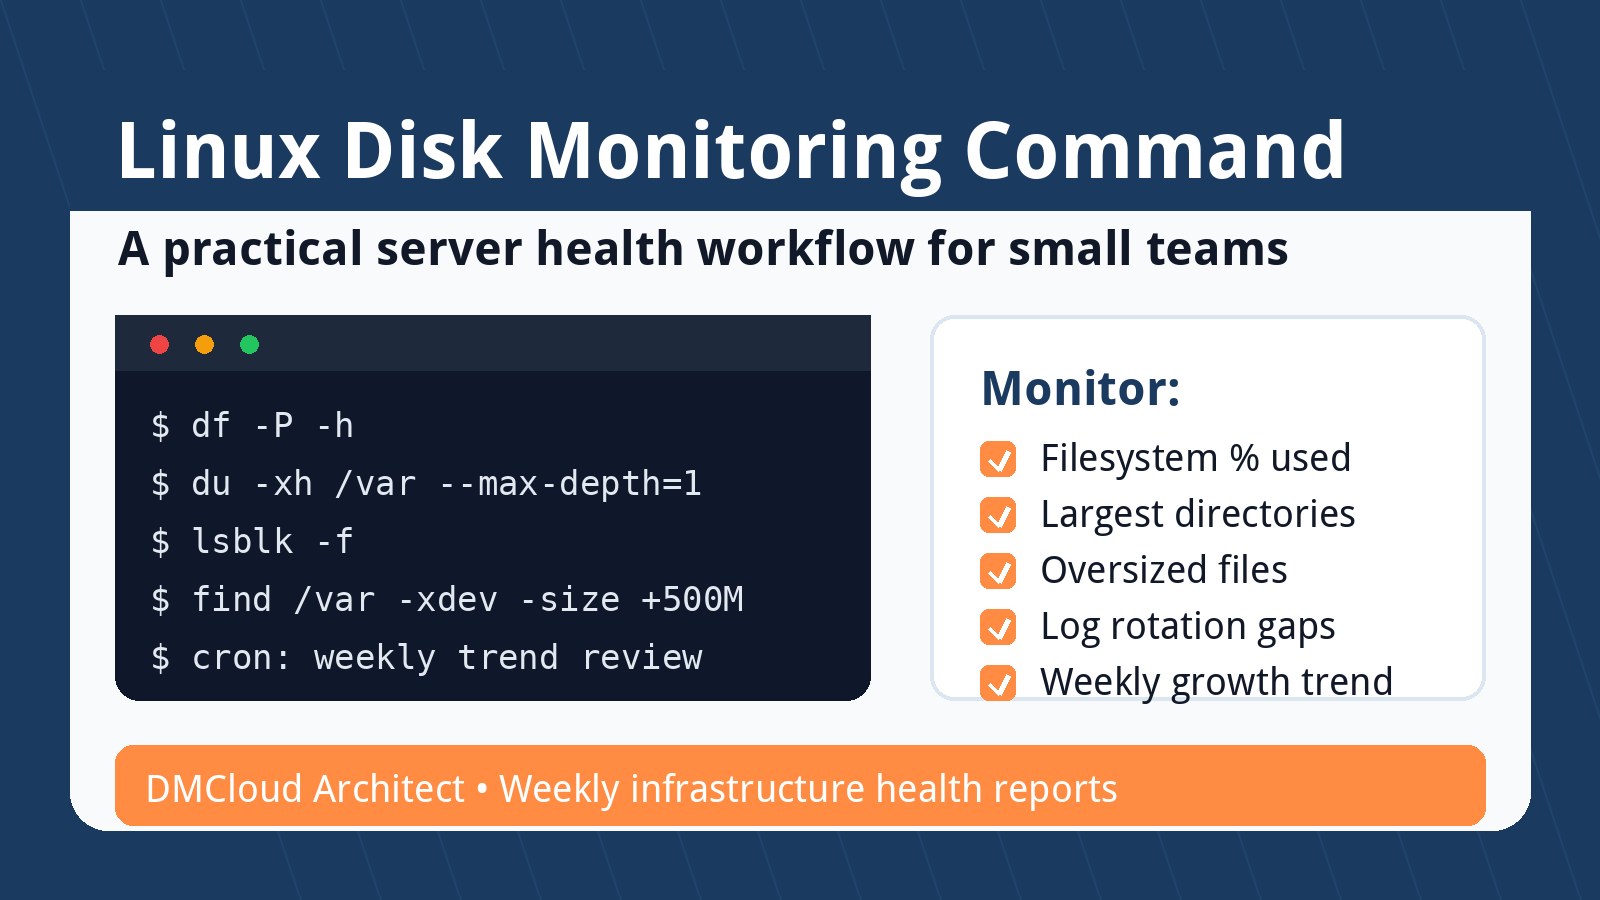
Disk issues are classic operations problems because they affect logs, databases, package managers, and application writes. Be ready to explain the difference between block usage and inode usage, why deleted-but-open files can make df and du disagree, and why clearing random files without understanding the owning process can make things worse.
Service will not start
Practice walking through service state, logs, config validation, permissions, ports, dependencies, and recent changes. If the service starts locally but is unreachable, widen the check to listening sockets, firewall rules, DNS, routing, reverse proxies, and health-check paths.
OOM killer and memory pressure
You do not need kernel-developer depth, but you should understand how to identify memory exhaustion, review OOM logs, check whether swap is involved, and separate a one-time spike from a recurring leak. Mentioning alert thresholds and trend reports is useful here because memory failures are often visible before the final kill event.
3. Networking scenarios to practice out loud
Networking interview questions often test whether you can isolate layers instead of guessing. A good answer moves from local configuration to name resolution, connectivity, transport, and application behavior.
- IP works but hostname fails: focus on DNS configuration, resolver order, search domains, caching, and split-horizon DNS.
- Ping works but curl fails: ICMP reachability does not prove TCP port access, TLS success, proxy behavior, or application health.
- Service listens but clients cannot connect: check bind address, security groups, host firewall, route tables, and whether the service is listening on IPv4, IPv6, or localhost only.
- Intermittent connectivity: consider packet loss, MTU problems, overloaded proxies, DNS timeouts, connection limits, or a single unhealthy backend.
For early roles, it is okay to say where you would use tools like ss, ip route, dig, curl -v, and logs. The goal is not to list tools endlessly; the goal is to show why each check reduces uncertainty.
4. Storage depth: enough to be useful, not encyclopedic
Storage can feel intimidating because topics like SAN, multipath, and NFS can get deep quickly. For a junior-to-early infrastructure role, reasonable depth means understanding symptoms and safe first checks.
For NFS, know that a hang can affect process states and load average even when CPU is not high. For iostat, understand that high wait or service time can explain slow applications. For fstab, know how a bad mount entry can break boot or delay startup. For LVM, understand basic relationships between physical volumes, volume groups, logical volumes, and filesystems.
You do not need to design a full enterprise storage fabric in the interview unless the job description says so. You should be able to identify storage as a likely cause, collect evidence, and escalate with clear data.
5. Practical scripting beats abstract algorithms for many fleet roles
Most early Linux fleet operations coding tasks lean toward practical automation. Expect log parsing, counting, filtering, string handling, basic data structures, simple API calls, or Bash/Python scripts that transform operational data.
It is still useful to practice arrays, dictionaries, sorting, and top-N counts because those show up in log and metrics problems. But if your time is limited, prioritize scripts that look like real work: summarize error codes from a log, find the noisiest IPs, parse timestamps, check a list of hosts, or compare expected services against running services.
6. Where linux server monitoring fits into interview answers
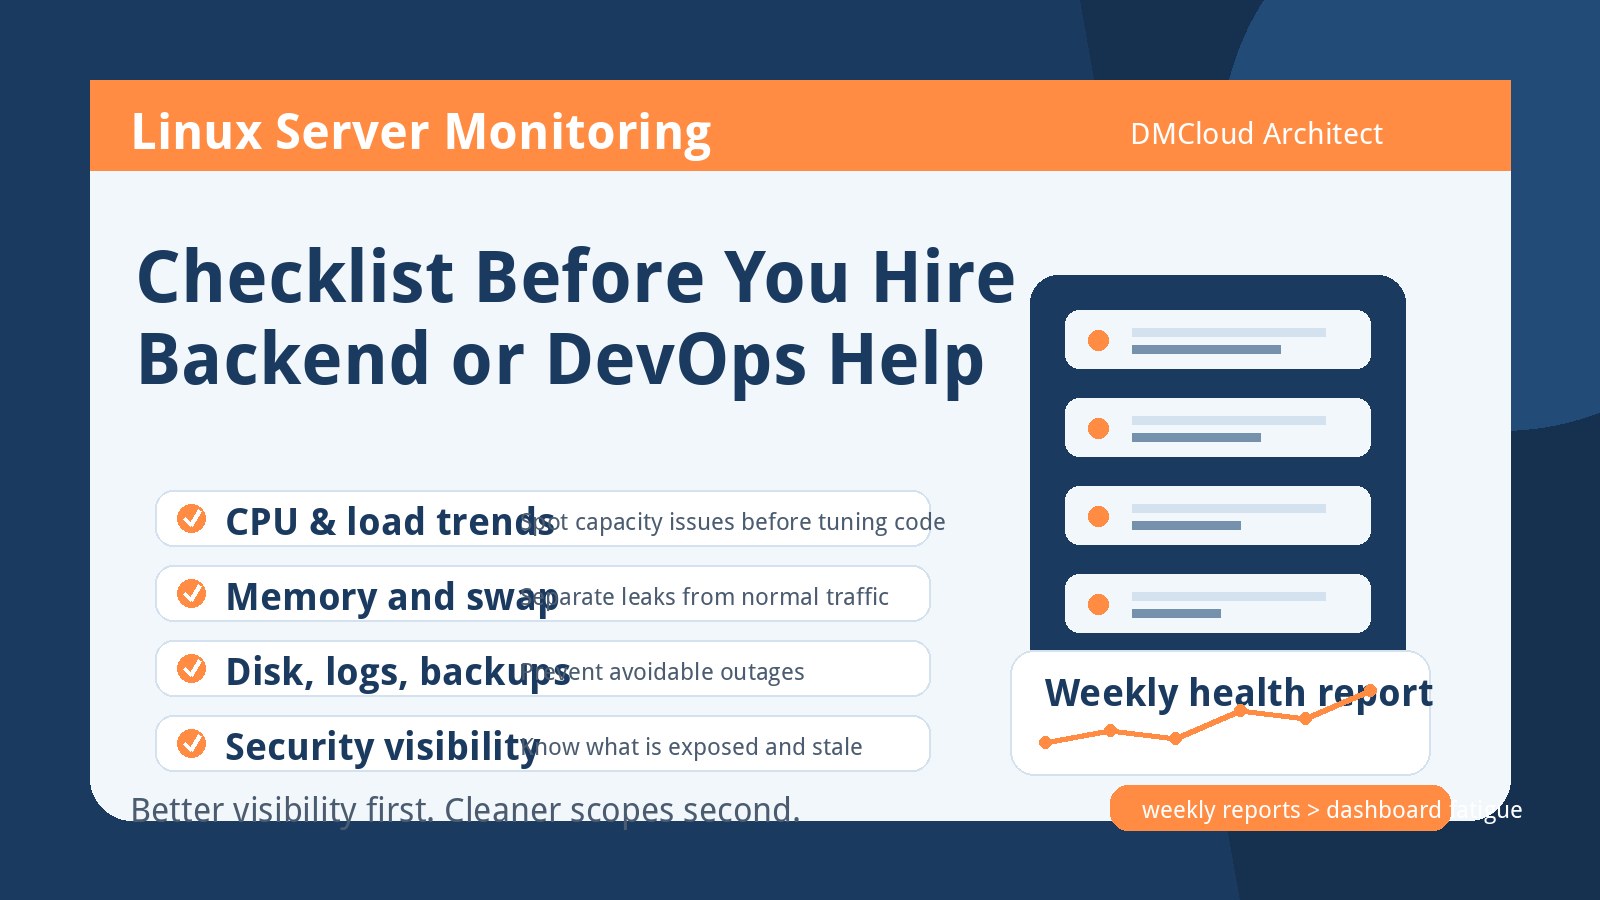
Monitoring is not just a tool category; it is part of your operational judgment. When an interviewer asks about a slow server, it is strong to mention both live checks and historical trends. Live commands tell you what is happening now. Dashboards and weekly reports tell you whether today is unusual.
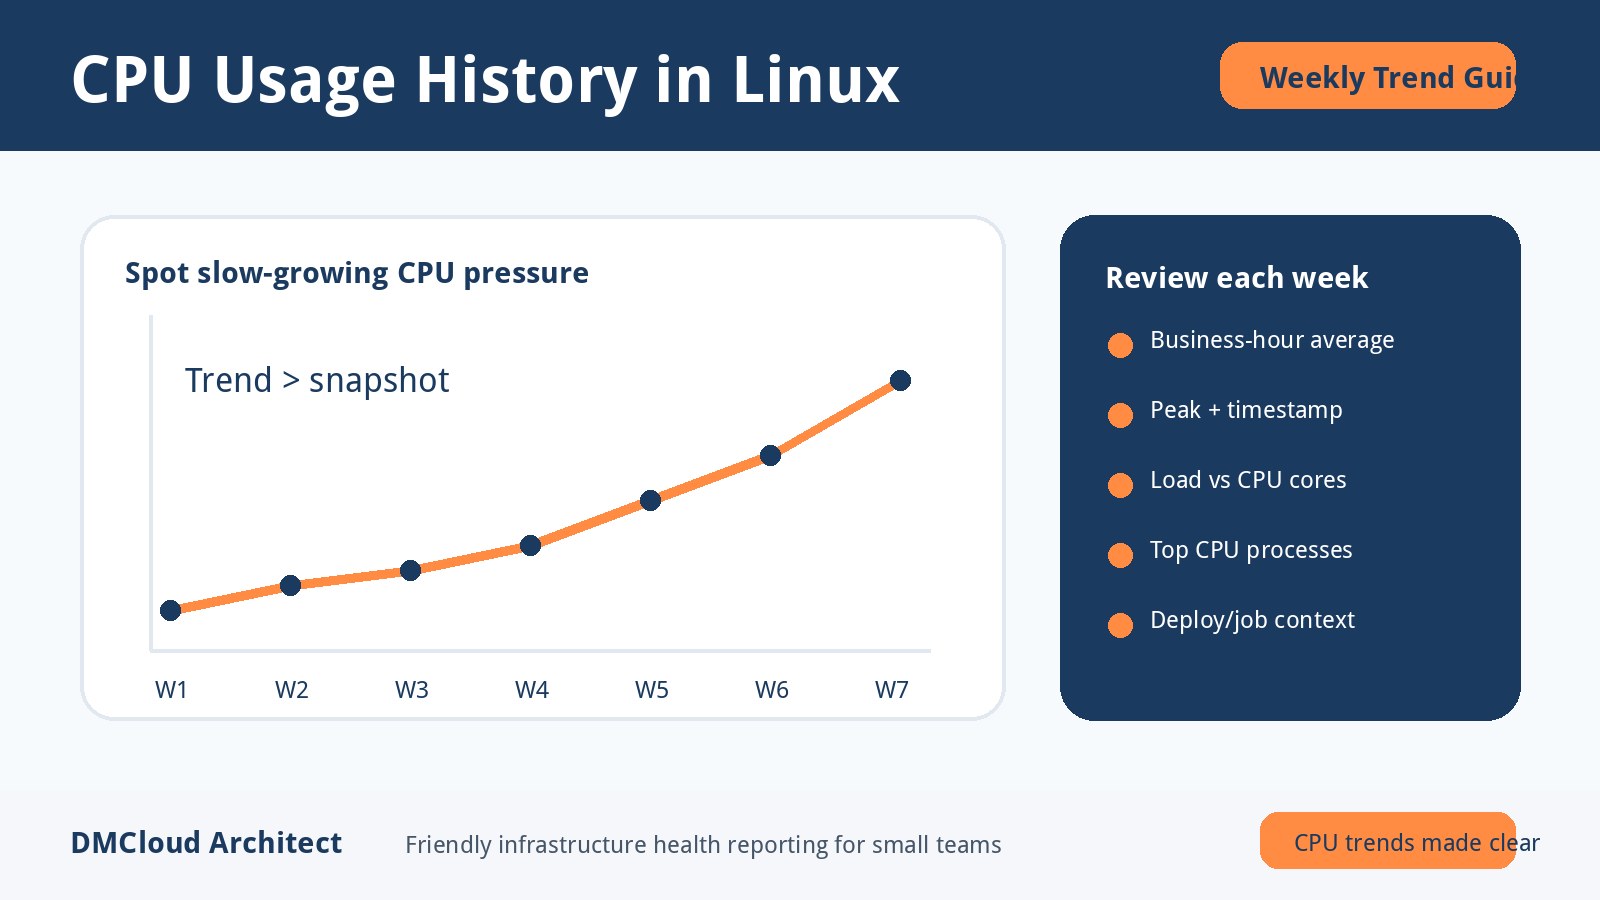
For example, a server with steadily rising load average, slowly shrinking free disk, and increasing MySQL connections may not be “down” yet, but it is becoming risky. A weekly infrastructure health report can highlight those trends before they turn into incidents. That is especially valuable for small teams that do not have someone watching dashboards all day.
7. A simple mock scenario checklist
Use these prompts for practice. For each one, answer with the first three checks you would make, the evidence you expect, and the safest next action.
- A web server is slow, but CPU usage is only 25%.
- The application cannot write logs after a deploy.
dfsays the disk is full, butdudoes not show enough files to explain it.- SSH works from one network but not another.
- A service is running, but the load balancer marks it unhealthy.
- A database host has rising iowait and slower queries.
- A cron job worked yesterday but silently failed today.
- A fleet has five servers, and only one shows rising memory usage every afternoon.
8. What candidates often over-prepare and under-prepare
Candidates often over-prepare command trivia and advanced storage terminology. Those are useful, but they do not replace clear incident reasoning. It is better to know five common commands well and explain your decision process than to list twenty commands without connecting them to the symptom.
Candidates often under-prepare communication. In fleet operations, you need to tell teammates what you know, what you do not know yet, what risk remains, and what you are doing next. Practice saying things like: “I would not restart all nodes yet because we have not confirmed whether this is a dependency issue. I would test one host, compare logs, and check whether the issue started after the last config change.”
Final prep plan
If you have one week to prepare, split your time into four blocks: Linux troubleshooting scenarios, networking isolation, storage symptoms, and practical scripting. End each practice session by writing a short incident note: symptom, evidence, likely cause, next action, and prevention idea. That habit maps directly to real operations work.
The best interview answers sound like safe production behavior. Stay structured, use monitoring evidence, explain tradeoffs, and show that you can learn from the incident after the fire is out.
Want weekly infrastructure health checks without dashboard fatigue?
DMCloud Architect sends Linux and MySQL infrastructure health reports directly to your inbox, so you can spot risks early without adding another monitoring dashboard to watch.
Get the free starter plan for weekly infrastructure health reports.