Disk forecasting on Linux is not about predicting the future perfectly. It is about noticing when a filesystem is growing faster than expected, estimating when it will become risky, and making a calm plan before users see errors, backups fail, or databases stop accepting writes.
For many developers and small business owners, disk capacity planning gets attention only after an alert says a partition is already 90% full. That is understandable: storage feels boring until it is urgent. A simple weekly forecasting habit turns disk usage from a surprise into a trend you can manage.
Why disk forecasting matters before the alert fires
Most Linux servers do not run out of disk space all at once. Log files accumulate, application uploads grow, database tables expand, backups linger, and package caches quietly take up space. The final failure may look sudden, but the pattern usually started weeks earlier.
Good Linux disk capacity planning helps you answer three practical questions:
- How much space is available right now? This is the current risk snapshot.
- How quickly is disk usage growing? This is the trend that tells you whether the snapshot is stable or worsening.
- What should we do before the next busy period? This turns monitoring into a maintenance decision.
The goal is not to create a complex storage model. The goal is to avoid last-minute cleanup during a deploy, a billing run, or a customer-facing incident.
Start with the filesystems that can hurt you
A server may have several mounted filesystems, but not all of them deserve the same attention. Start with the places where growth can break the application or the operating system. Common examples include root, application data directories, database volumes, log volumes, backup mount points, and any shared upload storage.
The basic command is familiar:
df -h
For forecasting, the important part is consistency. Record the same filesystems on the same schedule, preferably daily or weekly. If you only check when something feels wrong, you will not have enough history to separate a normal increase from a real capacity problem.
Track growth rate, not just percent used
A filesystem at 72% used may be perfectly healthy if it has been stable for months. A filesystem at 58% used may be risky if it gained 12 percentage points in a week. Disk forecasting on Linux becomes useful when you track the slope of the line, not just the latest value.
A simple approach is to record used gigabytes and available gigabytes each week. Then compare this week to last week:
- If a volume grew by 2 GB in a week and has 80 GB free, you may have roughly 40 weeks of room at the current pace.
- If it grew by 20 GB in a week and has 80 GB free, the same volume may need action within a month.
- If growth is uneven, use the busiest recent period as your planning baseline instead of the average.
This does not need to be mathematically perfect. A rough trend reviewed every week is more useful than a precise number nobody checks.
Separate normal growth from abnormal growth
When storage usage jumps, investigate the source before buying more disk. Sometimes the right fix is capacity; other times the right fix is cleanup or retention.
Useful Linux checks include:
du -xh /var --max-depth=1 2>/dev/null | sort -h
journalctl --disk-usage
find /var/log -type f -size +100M -print
For database servers, look at data directories, binary logs, temporary files, and backups. For web applications, check uploads, generated reports, cache directories, and old release folders. For automation servers, inspect job artifacts and logs that may not rotate correctly.
The forecasting habit should lead to a clear conclusion: expected growth, unexpected growth, or unknown growth that needs investigation.
Use warning thresholds that leave decision time
Many teams set disk alerts at 80% or 90% and stop there. That is better than nothing, but it can still be too late if the filesystem grows quickly. A better disk capacity planning server routine combines percentage thresholds with time-to-full estimates.
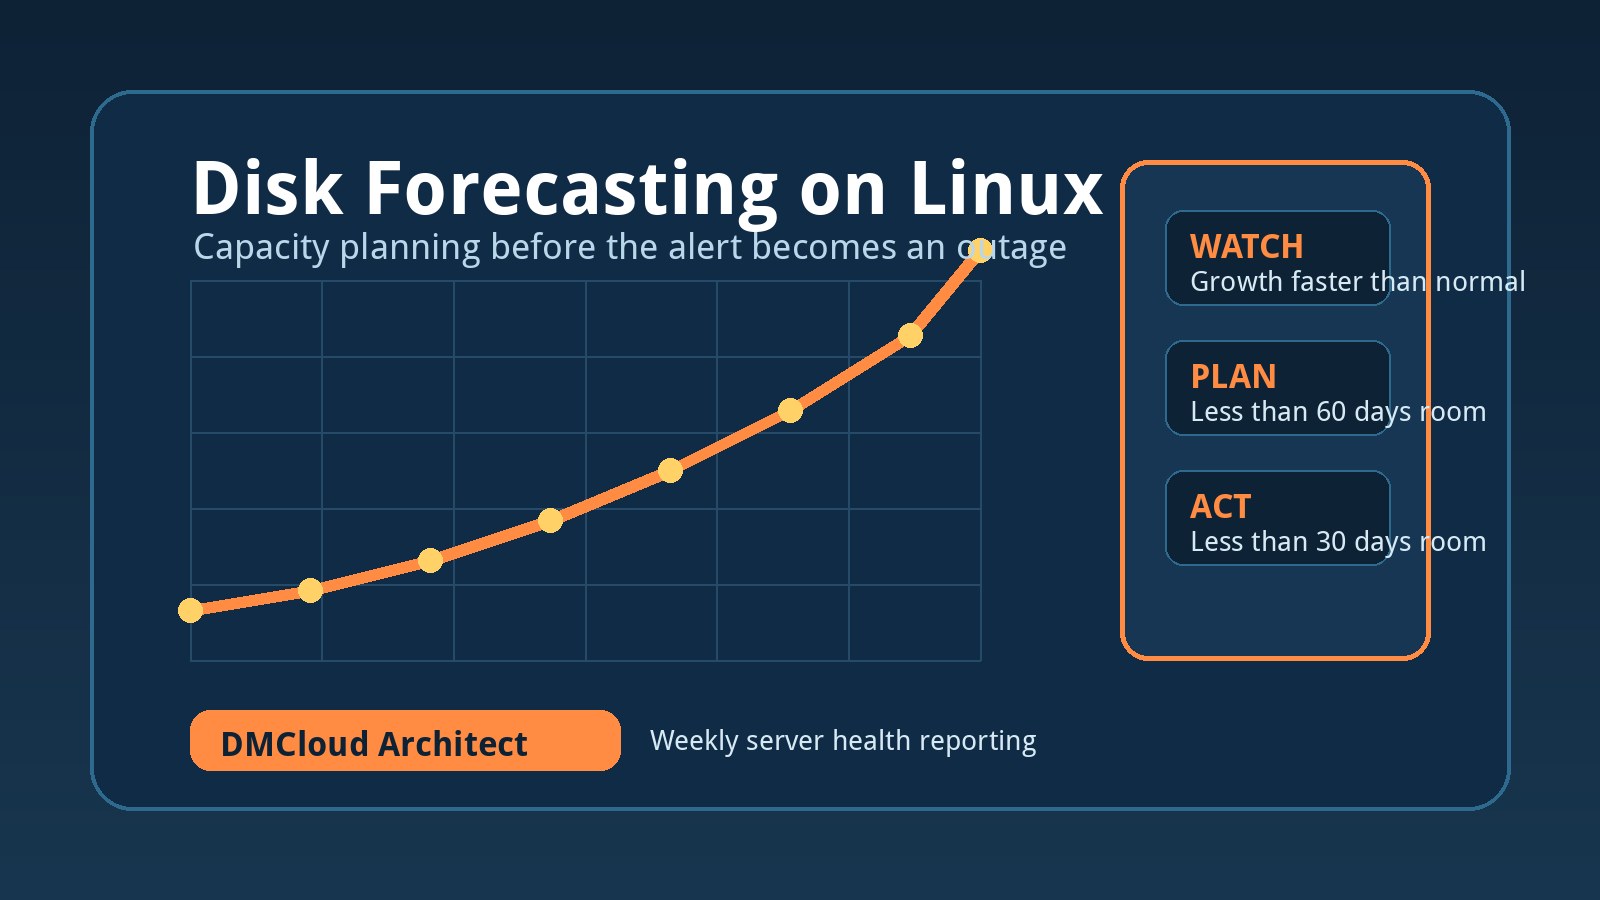
- Watch: above 70% used or growth faster than normal.
- Plan: less than 60 days of room at the current growth rate.
- Act: less than 30 days of room, unexplained growth, or any production volume above 85%.
These thresholds are intentionally conservative. Small teams often need time to schedule downtime, resize volumes, confirm backups, clean data safely, or coordinate with a hosting provider.
Make the weekly review operational
Disk forecasting only helps if it changes behavior. Add a short weekly review to your maintenance routine. Look for volumes with shrinking free space, unusual jumps, old backups, log retention problems, and data directories that are growing faster than the business expects.
A useful weekly note might include:
- Current usage for critical filesystems.
- Change since the previous report.
- Estimated weeks remaining at the recent growth rate.
- Recommended action, owner, and due date.
This makes storage capacity planning Linux-friendly and management-friendly at the same time. Developers see the technical signal, while owners see the operational decision.
Do not forget backups and restore points
Backups are one of the easiest ways to accidentally fill a server. A backup process that worked fine at 20 GB may become dangerous at 200 GB, especially if old snapshots are retained locally. Forecast backup growth separately from application growth so retention changes do not hide real application trends.
Also verify that cleanup policies are safe. Deleting old files is not a capacity plan unless you know what they are, whether they are still needed, and whether they are recoverable. The best time to answer those questions is before the filesystem is under pressure.
A practical first-week checklist
- List critical Linux filesystems and mount points.
- Record current used, available, and percent-used values.
- Identify the top growth directories with
du. - Check log rotation and backup retention.
- Set watch, plan, and act thresholds.
- Review the numbers again next week and calculate the change.
After a few weeks, you will have enough history to predict disk usage growth with useful confidence. You will also know which volumes are stable, which are seasonal, and which ones need a real capacity plan.
Bottom line
Disk forecasting on Linux gives small teams a practical early-warning system. By tracking growth rate, reviewing critical filesystems, and acting before storage gets tight, you can avoid urgent cleanup and keep routine maintenance predictable.
Want weekly infrastructure health checks without dashboard fatigue?
DMCloud Architect sends Linux and MySQL infrastructure health reports directly to your inbox, so you can spot disk, CPU, memory, and backup risks early without adding another monitoring dashboard to watch.
Get the free starter plan for weekly infrastructure health reports.