A lightweight monitoring solution should help you notice server trouble early without creating a second job for your team. For developers and small business owners, the best monitoring setup is often not the biggest platform. It is the one that watches the right signals, explains what changed, and makes the next maintenance decision obvious.
If you run a small production server, a client portal, a WordPress site, an internal application, or a MySQL-backed service, you probably need more than “the site is up.” You also may not need a full observability stack with dozens of dashboards, agents, and alert rules. A practical middle ground is simple monitoring small business teams can actually review every week.
What lightweight monitoring should mean
Lightweight does not mean careless. It means the monitoring footprint is small, the alert list is focused, and the reporting is easy to understand. The goal is to answer a few operational questions before they turn into outages:
- Is the server reachable and responding?
- Are CPU, memory, and disk trends moving in the wrong direction?
- Are backups, certificates, and scheduled jobs still healthy?
- Is there a clear action to take this week?
That last point matters. A dashboard full of charts is not the same as an operational decision. A lightweight monitoring solution should reduce uncertainty, not add another screen nobody has time to watch.
Start with the risks that cause real incidents
Small infrastructure monitoring works best when it starts with common failure modes. You do not need to measure everything on day one. Start with the signals most likely to hurt customers, revenue, or your own ability to recover.
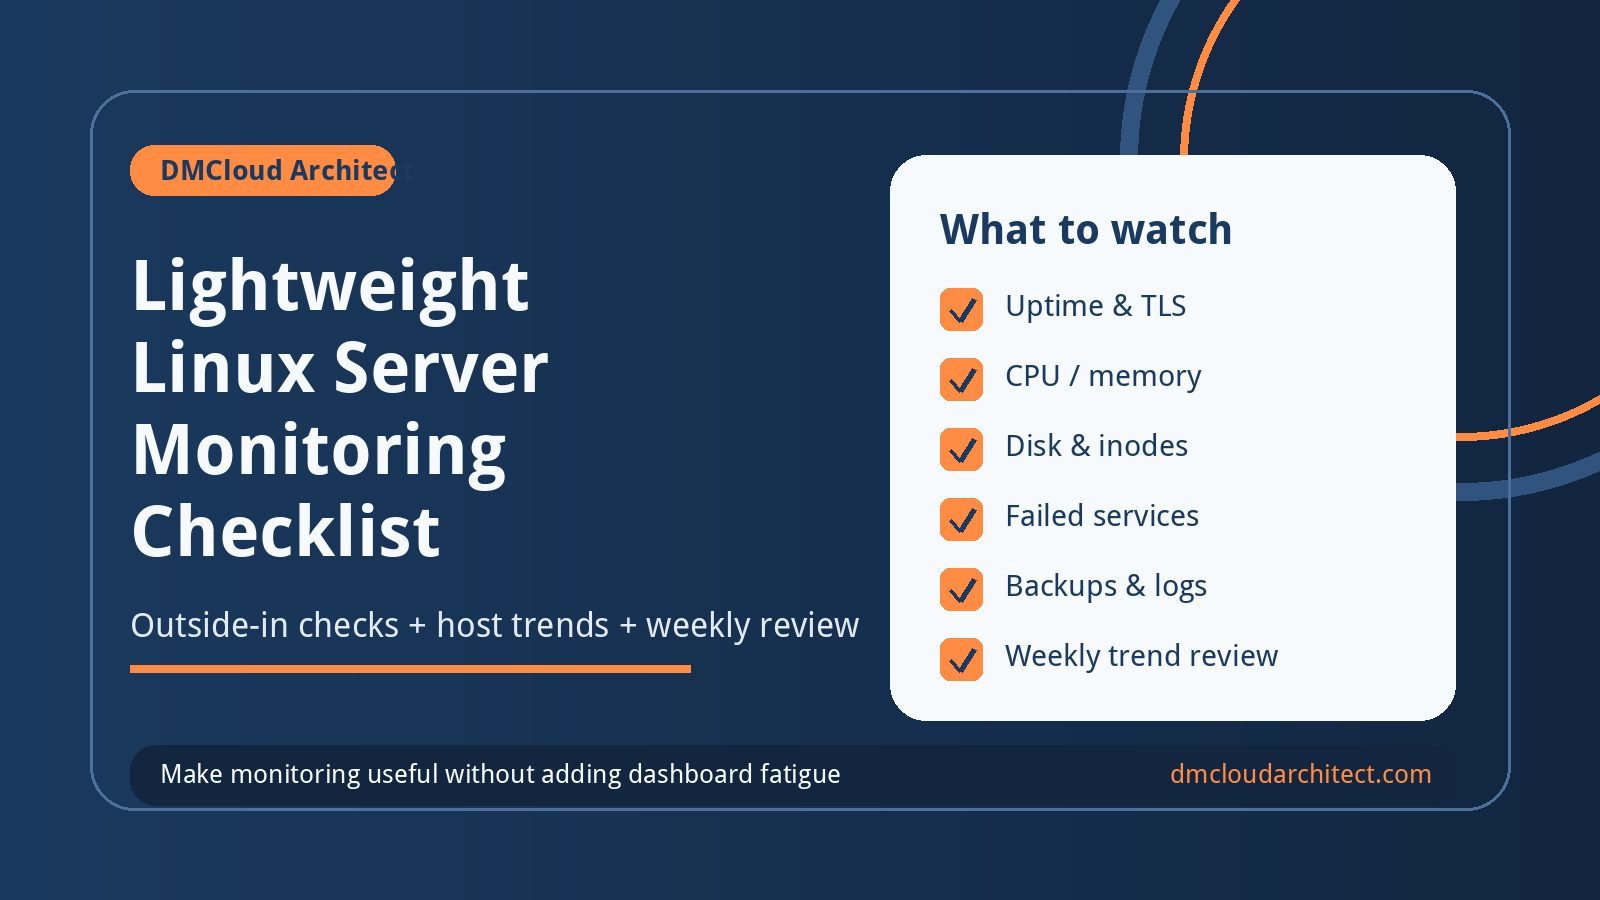
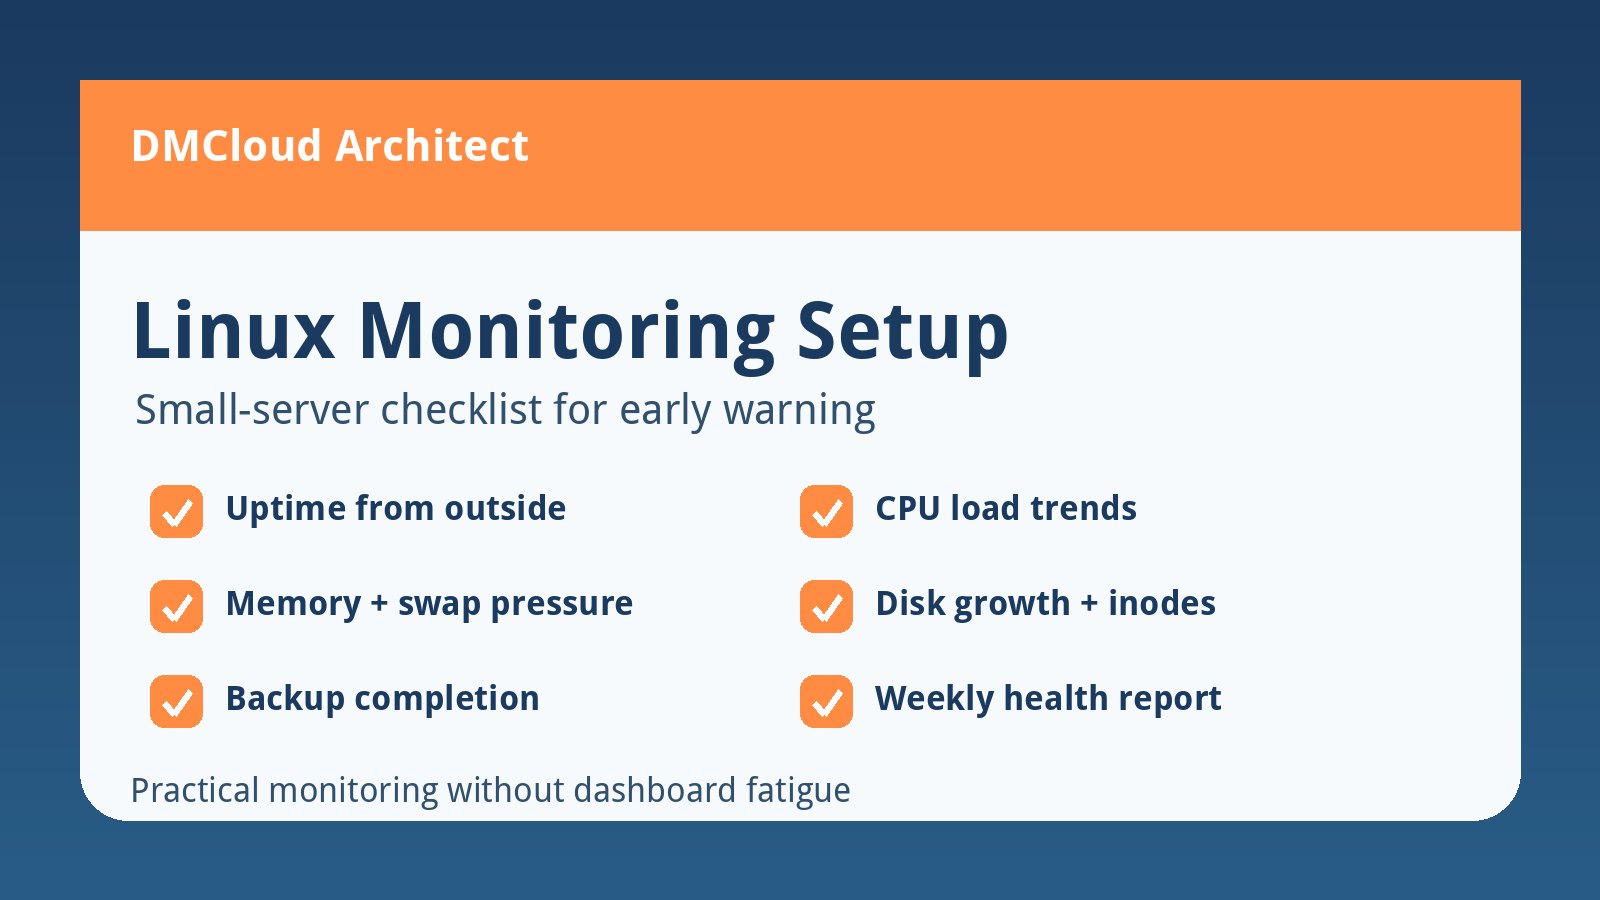
- Uptime and HTTP response: Can users reach the site or application?
- Disk usage and growth: Is a filesystem filling up, especially logs, uploads, database storage, or backups?
- CPU load: Is the server spending more time under pressure than usual?
- Memory and swap: Is the application drifting toward slowdowns or out-of-memory failures?
- Backup freshness: Did the backup job run, and is there a recent restore point?
- Certificate expiration: Is HTTPS going to fail soon?
- Cron and scheduled work: Are recurring jobs still completing on time?
This list is intentionally boring. Boring checks prevent very expensive surprises. A small team that reviews these items consistently is often in better shape than a team with a large toolset and no review habit.
Use trends instead of one-time snapshots
A snapshot tells you what is happening right now. A trend tells you whether the server is becoming riskier. For small server monitoring, trends are where the practical value appears.
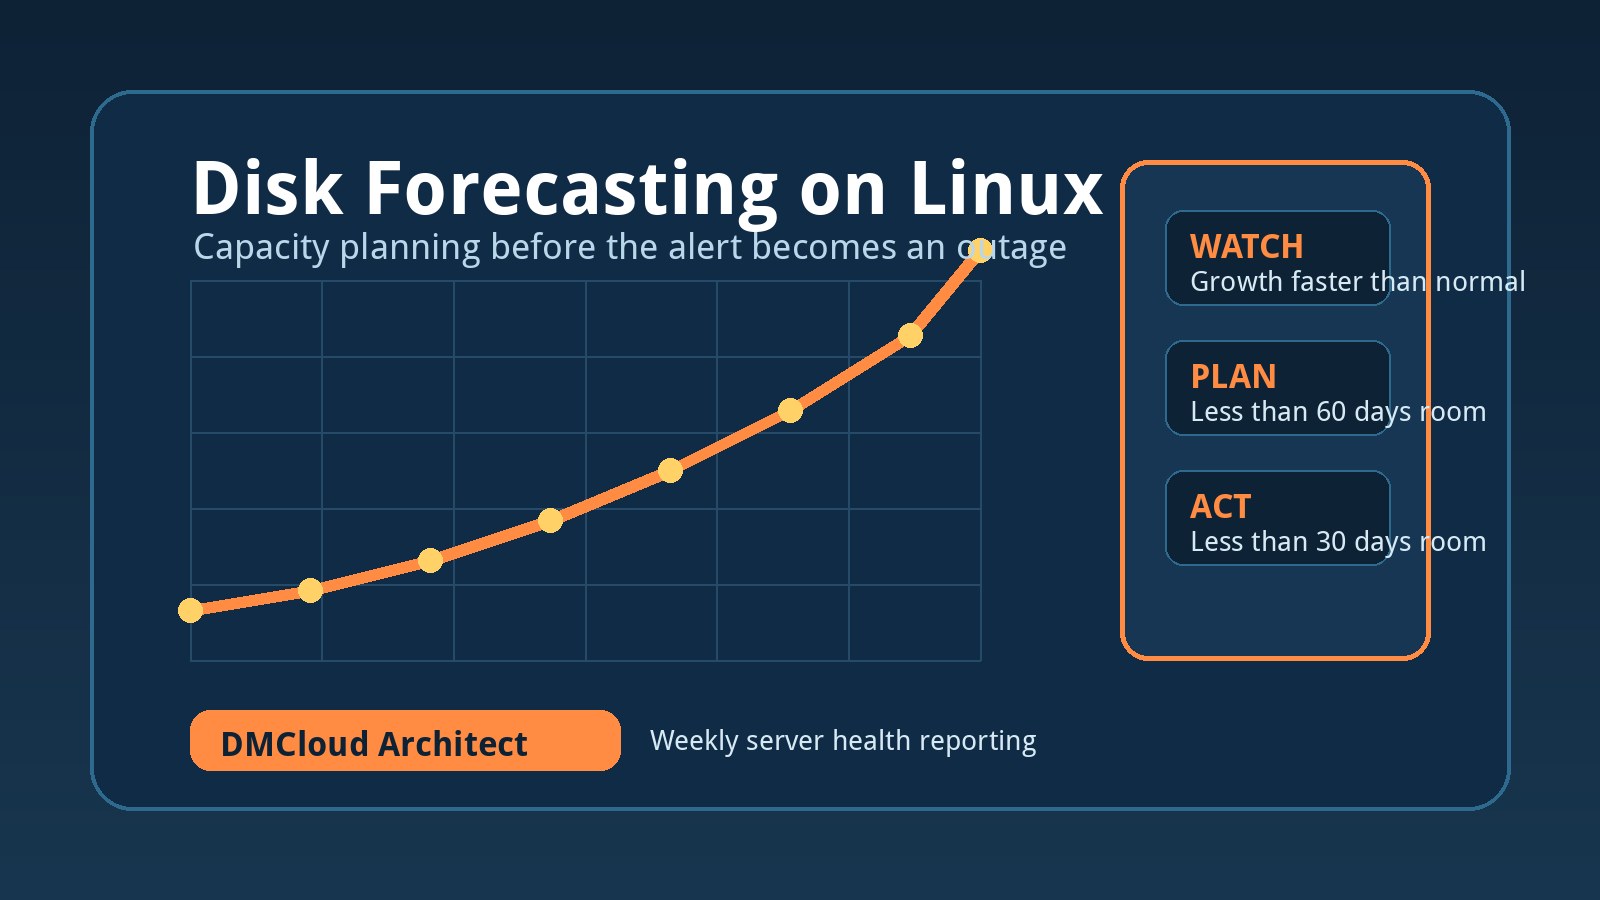
For example, a disk volume at 68% used might be fine if it has been stable for months. The same volume might be urgent if it was 42% used three weeks ago. CPU load might look normal during a quiet hour but show a steady weekly climb as traffic, background jobs, or database queries increase.
A lightweight monitoring solution should preserve enough history to answer simple questions:
- What changed since last week?
- Which metric is moving fastest?
- Is this normal growth, seasonal load, or a new problem?
- How much time do we have before action is needed?
You do not need perfect forecasting. You need enough context to avoid treating every alert as a surprise.
Keep alerts few, actionable, and calm
Monitoring without a DevOps team can fail when alerts become too noisy. If every small fluctuation sends an urgent notification, people learn to ignore the system. A lightweight setup should separate immediate incidents from maintenance signals.
Use urgent alerts for problems that need fast action: site down, disk critically full, backup repeatedly failing, certificate close to expiration, or a service process stopped. Use weekly reports for slower issues: disk growth, rising CPU load, memory pressure, old packages, noisy logs, or scheduled jobs that are taking longer than before.
This split keeps the system useful. The urgent channel stays rare enough to trust, and the weekly review gives you time to plan repairs before they become emergencies.
A practical first-week setup
If you are starting from almost nothing, do not try to build an enterprise monitoring program in one sitting. Begin with a small baseline that you can understand and maintain.
- List your critical systems. Include the main website, database server, application server, storage volume, and backup destination.
- Record current health. Capture uptime, disk usage, CPU load, memory usage, backup freshness, and certificate expiration.
- Choose warning levels. For example, review disk usage above 75%, act above 85%, and investigate rapid growth even if usage is still lower.
- Document owners. Decide who receives urgent alerts and who reviews weekly health notes.
- Review again next week. The second data point is where monitoring starts becoming a trend instead of a checklist.
That is enough to monitor a small production server more responsibly than many teams do today.
What to avoid when choosing tools
There are many excellent monitoring platforms, but tool choice should follow operational need. Before adopting a complex system, ask whether your team will actually maintain it. A powerful dashboard that nobody reviews is not a lightweight monitoring solution; it is shelfware with a login screen.
Be cautious with setups that require too much tuning, create hundreds of default alerts, or make simple answers hard to find. Small business infrastructure usually benefits from plain-language summaries, stable thresholds, and clear recommendations. You can always add depth later when the operational habit is working.
Turn monitoring into a weekly decision
The most useful output is not a graph. It is a short decision: no action needed, investigate this item, clean this disk, confirm this backup, renew this certificate, resize this server, or schedule a maintenance window.
A weekly infrastructure health note might include:
- Systems checked and whether they are reachable.
- Disk, CPU, and memory changes since the previous report.
- Backup freshness and any failed jobs.
- Certificates or domains approaching renewal.
- One or two recommended actions with owners and due dates.
This is where lightweight monitoring becomes valuable for both technical and non-technical stakeholders. Developers get the operational signal. Owners get a concise view of risk and next steps.
Bottom line
A lightweight monitoring solution is not a weaker version of enterprise observability. It is a focused operating habit for small teams that need early warning, practical recommendations, and less dashboard fatigue. Start with the checks most likely to prevent real incidents, review trends weekly, and keep alerts rare enough that people trust them.
Want weekly infrastructure health checks without dashboard fatigue?
DMCloud Architect sends Linux and MySQL infrastructure health reports directly to your inbox, so you can spot disk, CPU, memory, backup, and uptime risks early without adding another monitoring dashboard to watch.
Get the free starter plan for weekly infrastructure health reports.