Performance tuning is tempting because a single profile change feels faster than a full investigation. But for a production server, especially one owned by a small team, the safest question is not “which knob is fastest?” It is “which workload are we optimizing, and how will we know the change helped?”
RHEL and compatible Linux distributions make this easier with tuned, a service that applies workload-oriented performance profiles. Used well, it can be a practical part of linux server monitoring. Used casually, it can mask disk pressure, memory shortages, noisy neighbors, or application bottlenecks that still need attention.
Start with the workload, not the profile list
Before changing anything, write down what the server actually does. A web application host, MySQL server, build runner, file server, and virtual machine host all have different performance tradeoffs. A profile that helps one workload may waste power, increase latency, or make troubleshooting harder on another.
- Identify the primary workload: database, web/API, virtualization, batch jobs, storage, or general purpose.
- List the symptom you are trying to improve: latency, throughput, CPU saturation, disk wait, network drops, or inconsistent response time.
- Check whether the symptom appears during normal traffic, backups, reporting jobs, deployments, or only during one-off incidents.
- Record the current active profile before making a change.
This gives the team a clear target. Without that target, tuning becomes guesswork.
Capture a simple baseline first
Do not switch profiles until you know the current pattern. A baseline does not need to be complicated, but it should cover enough signals to tell whether the server is CPU-bound, memory-bound, disk-bound, or waiting on something external.
- CPU load average, run queue pressure, and high-CPU processes.
- Memory usage, swap activity, and out-of-memory events.
- Disk latency, I/O wait, filesystem capacity, and inode usage.
- Network errors, packet drops, and interface saturation.
- Application-specific signals such as MySQL slow queries, queue depth, worker saturation, or request latency.
If you already receive a weekly infrastructure health report, use it as the starting snapshot. If not, save command output or monitoring screenshots before the change so the before-and-after comparison is not based on memory.
Use tuned-adm deliberately
The tuned-adm command is useful because it exposes both available profiles and the active profile. The exact list varies by distribution and installed packages, but the workflow is consistent: inspect, choose, apply, validate, and roll back if needed.
- Run
tuned-adm activeto see the current profile. - Run
tuned-adm listto see profiles available on that host. - Use
tuned-adm recommendas a hint, not as an automatic approval. - Pick a profile that matches the server role, such as throughput-oriented, latency-oriented, virtual-guest, virtual-host, powersave, or database-focused profiles when available.
- Document the old profile, new profile, date, owner, and reason.
Small teams should prefer changes that are easy to explain and reverse. If nobody can say why a profile was selected, it is not ready for production.
Validate one change at a time
Performance work gets confusing when several changes land together. If you change the tuned profile, kernel parameters, database configuration, application worker counts, and cron schedule in the same maintenance window, you may not know which change helped or hurt.
- Apply the tuned profile during a planned window when traffic patterns are understandable.
- Watch the same baseline metrics after the change.
- Compare user-facing behavior, not just system counters.
- Keep the previous profile and rollback command in the change note.
- Avoid declaring victory until the server has passed through its normal busy period.
A tuning change should produce an observable improvement or a documented learning. “No obvious errors” is not enough.
Know when tuning is the wrong fix
Some problems look like tuning problems because the server feels slow. In reality, they are capacity, architecture, or maintenance issues. A tuned profile may reduce friction, but it will not create missing CPU, fix an overloaded disk, or make inefficient queries cheap.
- If disk usage is above safe thresholds, address capacity before tuning for throughput.
- If swap activity is constant, investigate memory pressure and application sizing.
- If MySQL slow queries dominate response time, profile the queries before changing system-wide settings.
- If backups or reports overload the host, reschedule or isolate those jobs.
- If the issue appears only after deploys, inspect application changes and dependency updates.
The best tuning checklist protects you from optimizing the wrong layer.
Add monitoring guardrails after the change
Once the server has a new profile, add it to the operational checklist. The profile should not become invisible configuration drift. It should be part of the same weekly review as updates, capacity, backup health, and error trends.
- Track the active tuned profile and alert on unexpected changes for critical servers.
- Review CPU, memory, disk, and network trends after profile changes.
- Compare busy-hour application latency before and after the change.
- Keep a note of the business reason for non-default profiles.
- Revisit the choice after OS upgrades, instance size changes, workload moves, or database growth.
This is where linux server monitoring turns performance tuning into a repeatable process instead of a one-time command.
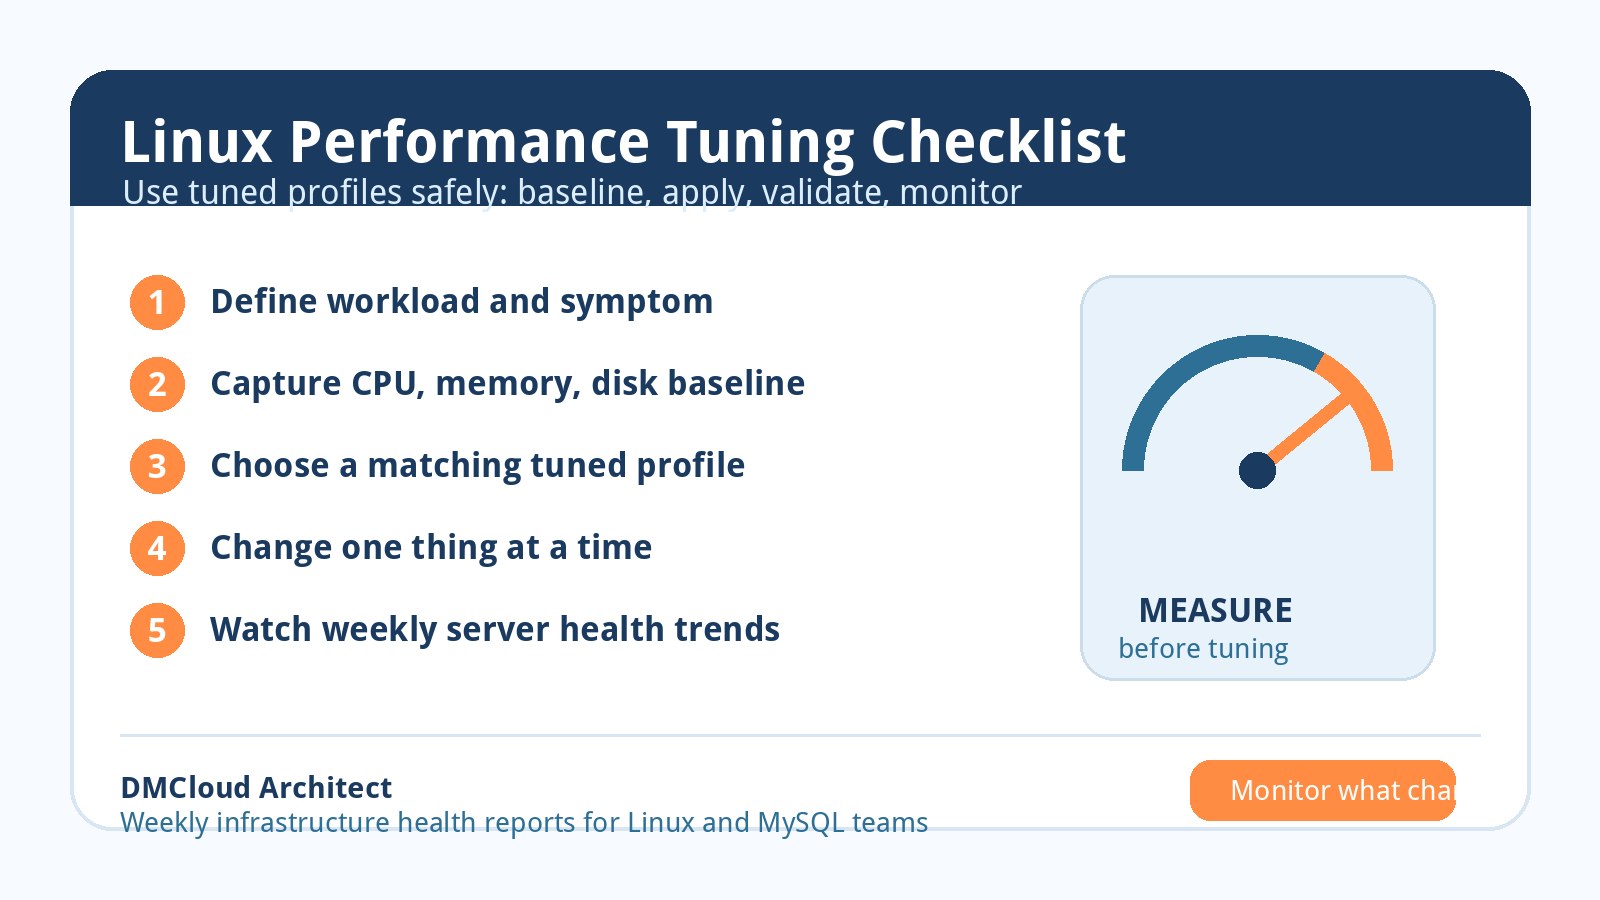
Small-team tuning checklist
- Define the workload and symptom before changing profiles.
- Capture CPU, memory, disk, network, and application baselines.
- Check the current profile with
tuned-adm active. - Review available profiles with
tuned-adm list. - Treat
tuned-adm recommendas a recommendation, not a guarantee. - Apply only one performance change at a time when possible.
- Validate during the next normal busy period.
- Document the rollback path.
- Add the active profile and key performance signals to weekly infrastructure reporting.
Bottom line
Linux performance tuning is most valuable when it is measured, reversible, and tied to the workload. RHEL tuned profiles are a good tool for small teams, but they should sit inside a larger operations habit: baseline first, change deliberately, validate with real signals, and keep watching after the change. That approach helps you improve performance without turning your production server into an undocumented experiment.
Want weekly infrastructure health checks without dashboard fatigue?
DMCloud Architect sends Linux and MySQL infrastructure health reports directly to your inbox, so you can spot risks early without adding another monitoring dashboard to watch.
Get the free starter plan for weekly infrastructure health reports.