Most monitoring setups are excellent at telling you when something is wrong right now. The harder question is whether your infrastructure has been drifting toward trouble for weeks. For developers and small business owners, historical server monitoring turns daily noise into a simple trend story: what changed, how fast it changed, and what deserves attention before customers notice.
Why point-in-time alerts are not enough
A green dashboard can still hide a growing risk. CPU might be within limits today while the weekly average keeps climbing. Disk usage might have plenty of free space this morning while backups, logs, or uploads are growing faster than expected. MySQL might respond quickly during business hours while slow queries become more common every month.
Point-in-time alerts are important, but they usually answer one question: “Is this threshold broken now?” Trend based monitoring answers a different and often more useful question: “Are we moving toward a threshold, and do we have time to fix it calmly?”
The trends worth keeping every week
You do not need to store every metric forever to get value from infrastructure trends monitoring. Start with a small set of measurements that connect directly to reliability, cost, and maintenance planning.
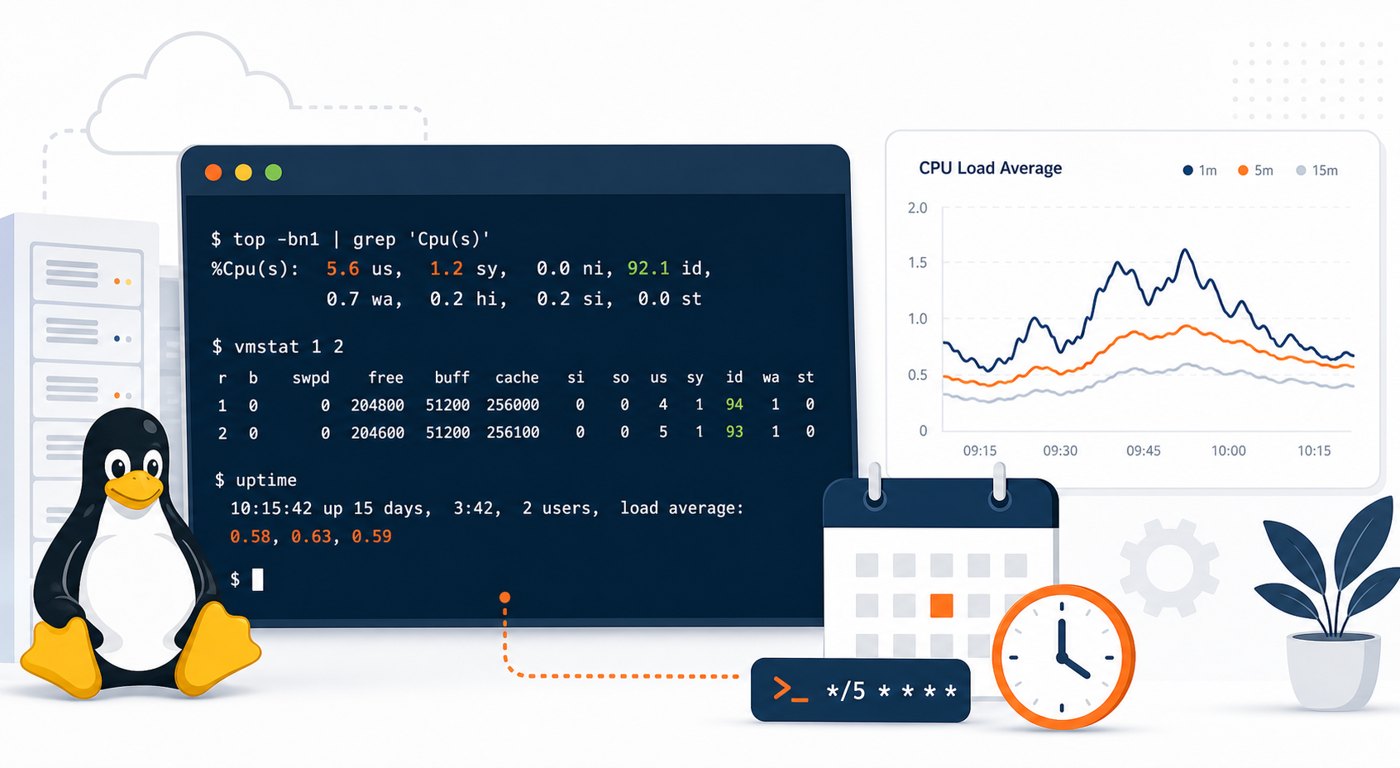
- CPU load and utilization: Compare weekly averages and peaks so you can see whether new workloads, traffic patterns, or background jobs are adding pressure.
- Memory usage and swap activity: Watch for slow increases in baseline memory consumption, especially after application releases or database changes.
- Disk capacity and growth rate: Track both percent used and weekly growth, because a disk at 55% can still be urgent if it is growing quickly.
- Filesystem inode usage: Log-heavy systems can run out of inodes even when space appears available.
- Database health: Review slow query counts, connection pressure, table growth, replication lag, and backup completion patterns.
- Service availability checks: Keep a record of brief failures, not just major outages, because small interruptions often reveal fragile dependencies.
How to read trend data without overcomplicating it
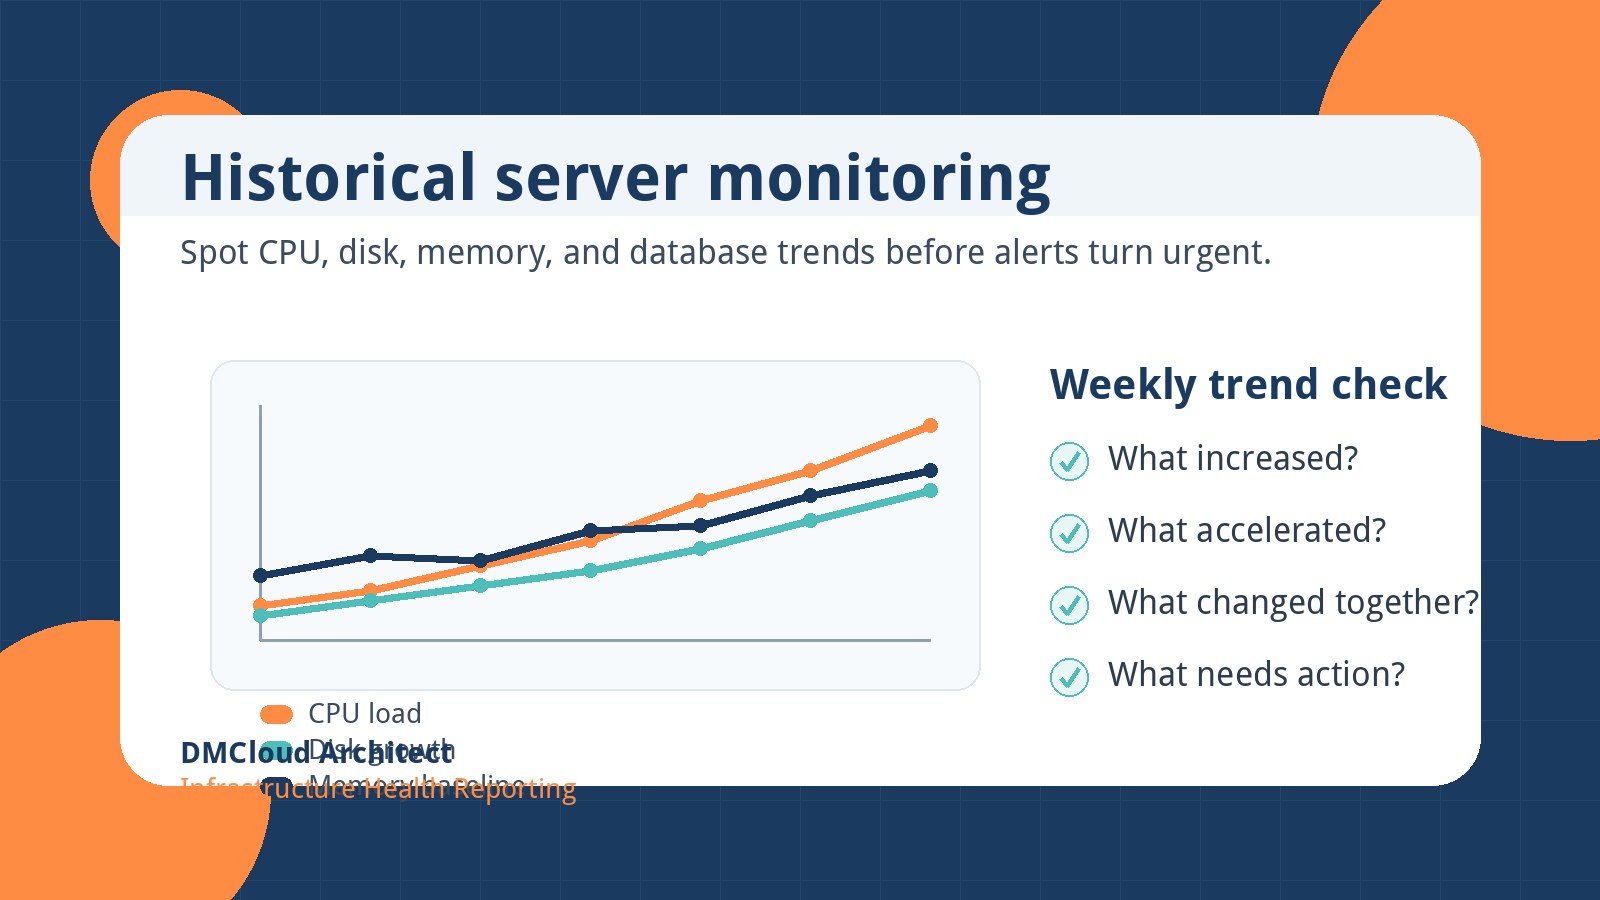
The goal is not to stare at graphs all day. A practical server trend analysis can be a short weekly review that asks four questions.
- What increased? Look for metrics that rose compared with the previous week and the previous month.
- What accelerated? A steady 1% disk increase may be manageable; a sudden 8% jump deserves investigation.
- What changed together? CPU, memory, and slow queries rising at the same time may point to a release, query plan change, or traffic shift.
- What action is needed? Decide whether to tune, clean up, resize, archive, investigate, or simply keep watching.
This lightweight review keeps monitoring useful for busy teams. You are not trying to predict every incident. You are building enough context to spot the obvious slow-moving problems early.
Example: disk growth that looks safe until it does not
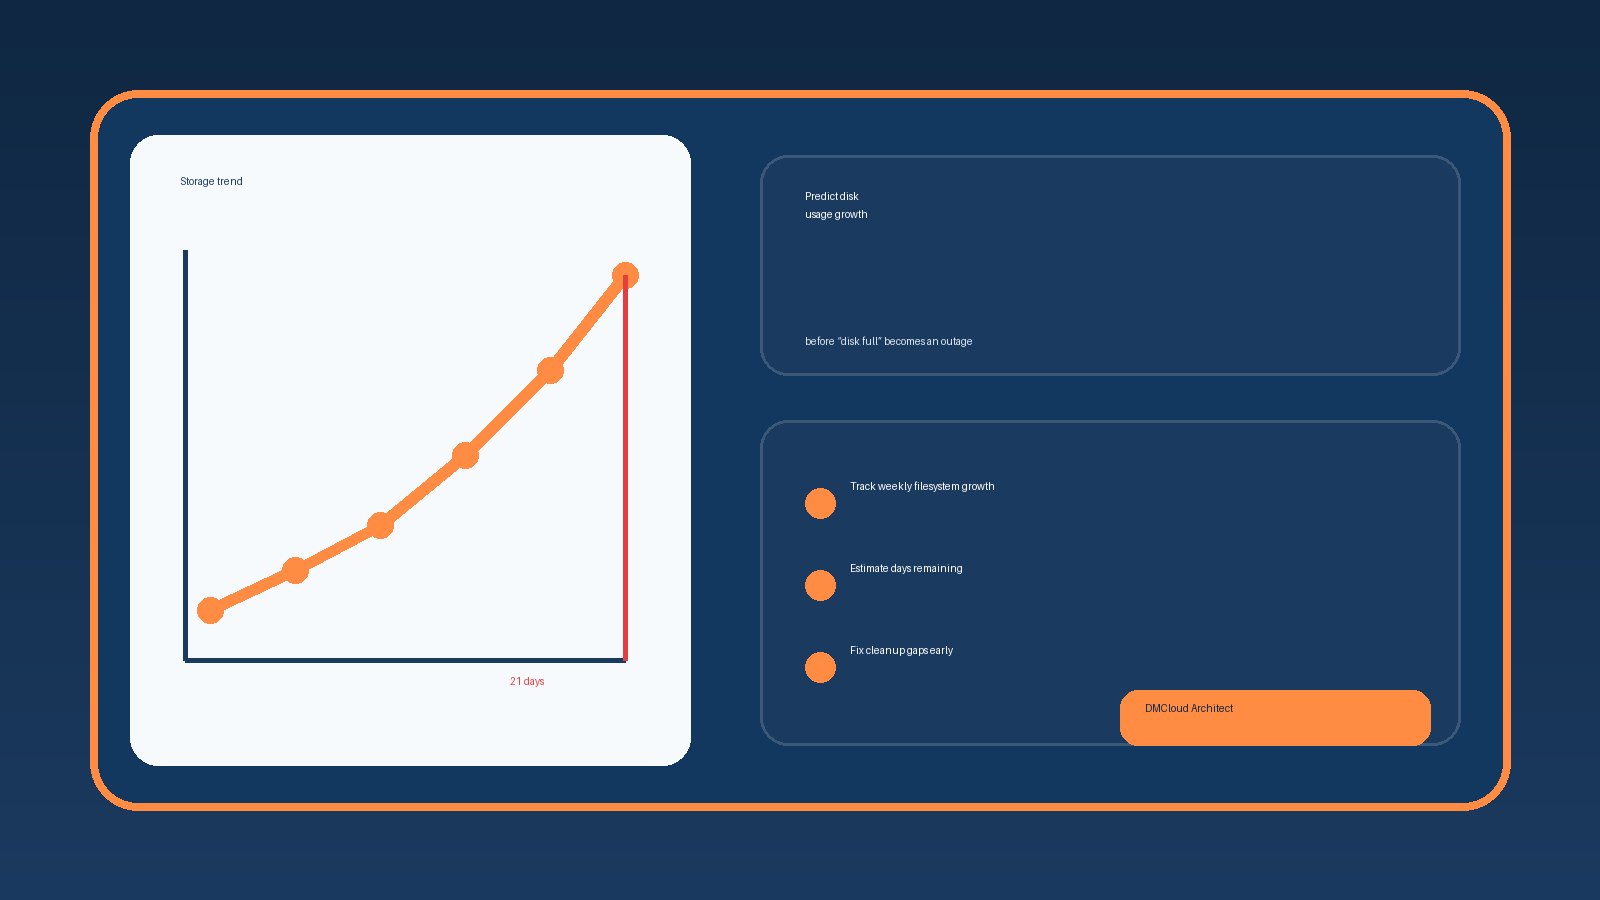
Imagine a server with a 500 GB disk using 58% of capacity. A standard threshold alert at 85% would stay quiet. But if historical data shows the server was at 42% six weeks ago, the trend tells a different story. At that pace, the team may only have a few more weeks before log rotation, backups, or storage expansion becomes urgent.
That is exactly where performance trend monitoring shines. The current number says, “not urgent.” The history says, “schedule the cleanup now, before it becomes a weekend emergency.”
Common causes of slow infrastructure drift
Trend changes are often caused by ordinary business activity rather than a single dramatic failure. New customers create more uploads. A reporting job gets added to cron. Debug logging stays enabled after a release. Database tables grow after a successful campaign. Backups are retained longer than planned.
None of these are bad by themselves. They become risky when no one notices the slope. When you monitor server trends over time, you can connect infrastructure changes to business events and decide whether the system needs tuning, cleanup, or more capacity.
A simple weekly review workflow
For small teams, the easiest workflow is a weekly health report that summarizes trend changes in plain language. Keep it short enough that someone will actually read it.
- Show the top three positive or negative changes from the last seven days.
- Compare each key metric with the prior week and the prior month.
- Highlight anything that is moving toward a known threshold.
- List recommended actions in order of urgency.
- Keep a short note history so future reviews explain why a change happened.
This approach works well because it creates a habit. Instead of waiting for a red alert, you get a regular reminder of what your infrastructure is trying to tell you.
What good historical data helps you decide
Once you have a few months of history, the data becomes useful for more than troubleshooting. It helps with capacity planning, budget conversations, release reviews, and vendor decisions. You can show whether a server needs resizing, whether a database optimization helped, or whether a cleanup task actually reduced growth.
Historical context also reduces guesswork during incidents. If a metric was already trending up before an outage, you have a clue. If it jumped only after a deployment, you have a different clue. Either way, the investigation starts with evidence instead of memory.
Start small, then make it repeatable
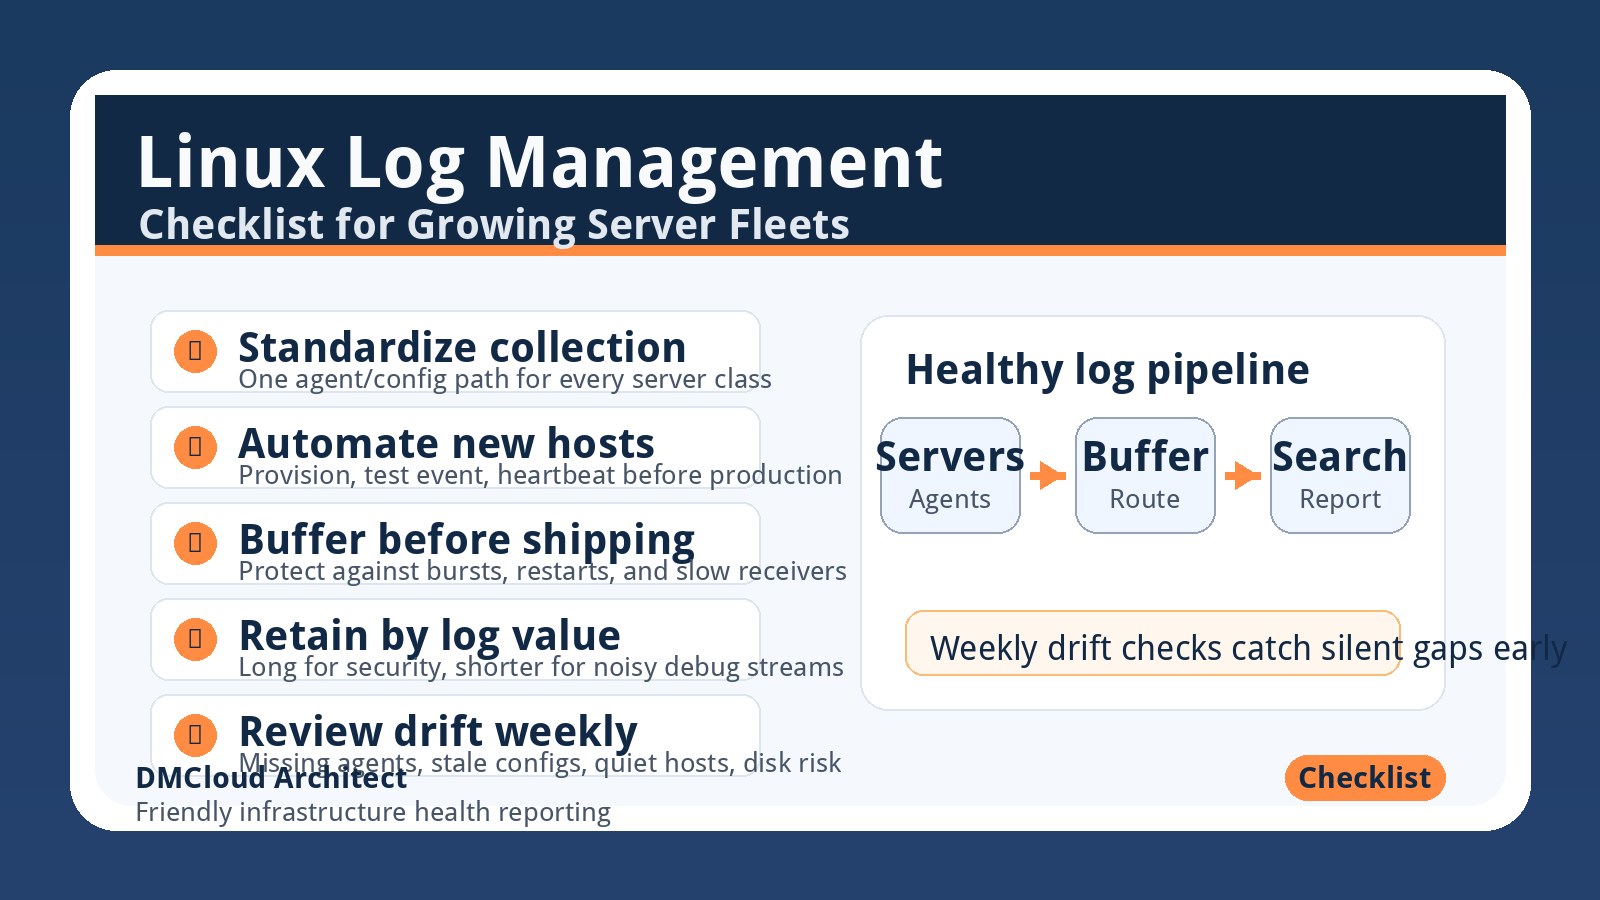
If your current monitoring only focuses on real-time alerts, start by preserving weekly snapshots of the basics: CPU, memory, disk, database health, backups, and availability. Add notes when something changes. Review the same set of metrics on the same day each week. A small repeatable process beats a large dashboard nobody checks.
The best monitoring habit is the one that helps you make calm decisions before the urgent alert arrives.
Want weekly infrastructure health checks without dashboard fatigue?
DMCloud Architect sends Linux and MySQL infrastructure health reports directly to your inbox, so you can spot risks early without adding another monitoring dashboard to watch.
Get the free starter plan for weekly infrastructure health reports.