A small business can run for months with a Linux server that appears healthy because the website loads and nobody has complained. That surface-level success can hide shrinking disk capacity, failed backup jobs, expiring certificates, recurring authentication attacks, or a service that never recovered cleanly after a reboot. Good Linux server monitoring closes that gap by turning system evidence into a regular operating routine.
The goal is not to collect every metric or keep another dashboard open all day. It is to know what changed, what now threatens availability, and who should act. The following checklist combines the core responsibilities normally spread across Linux administration, cloud operations, DevOps, site reliability, incident response, and business continuity.
1. Keep an accurate server and service inventory
Monitoring starts with knowing what must remain available. Record each server's purpose, environment, operating system, hosting provider, owner, public and private addresses, critical services, dependencies, maintenance window, and recovery priority. Include managed databases, object storage, DNS, load balancers, VPNs, and third-party services that sit outside the Linux host but affect the application.
For each customer-facing service, define a simple health test. A process being present is weaker evidence than a real request completing successfully. For example, check that an HTTPS endpoint returns the expected status and content, that a database accepts a harmless query, and that a scheduled data pipeline produced its expected output.
systemctl --failed --no-pager
systemctl list-units --type=service --state=running
ss -lntup
curl -fsS https://example.com/health
Review the inventory after migrations, application releases, vendor changes, and staff handovers. An undocumented server is difficult to patch and easy to forget during an incident.
2. Establish a capacity and performance baseline
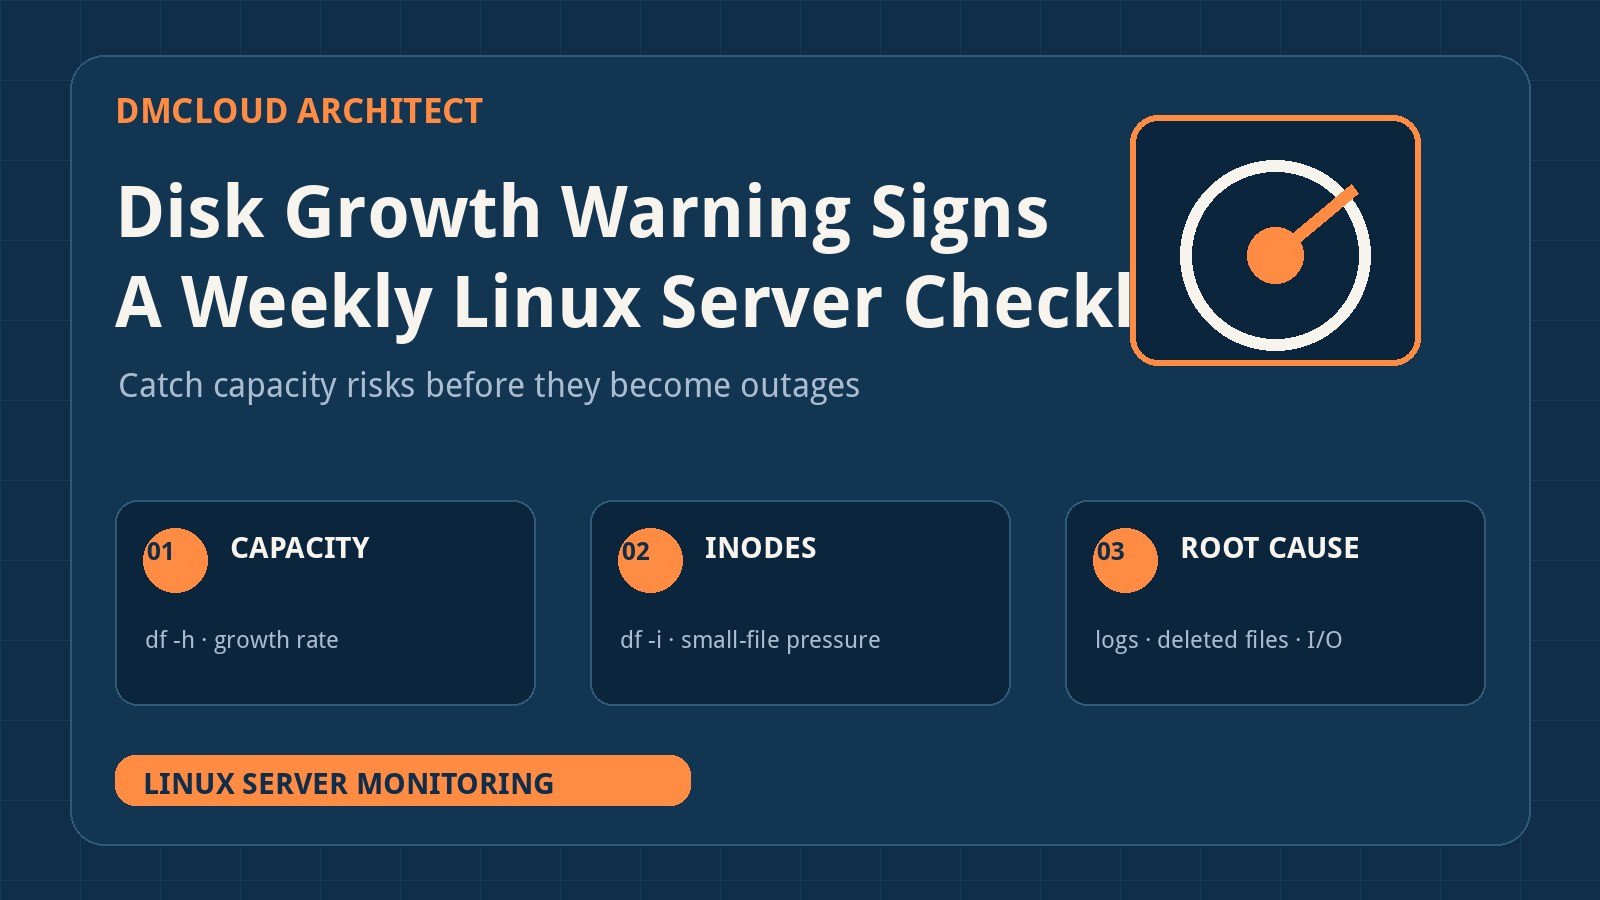
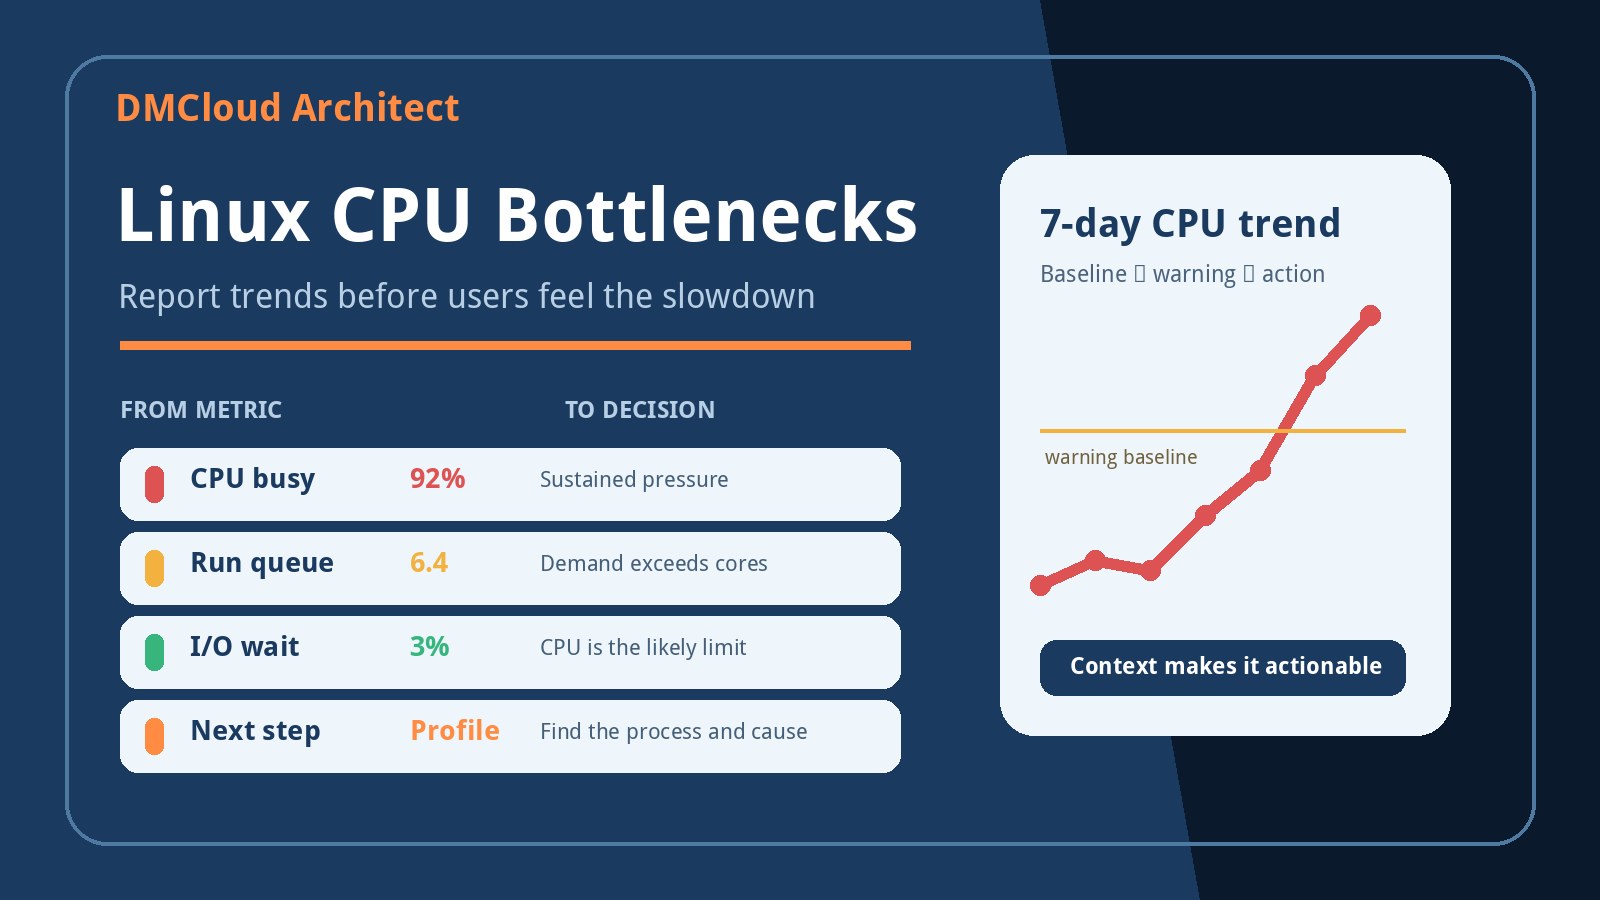
A single CPU or memory reading rarely explains whether a system is healthy. Build a baseline from several weeks of comparable observations: load average, CPU pressure, available memory, swap activity, disk latency, filesystem use, inode use, and network errors. Compare the current period with that baseline and with business events such as promotions, imports, backups, and month-end processing.
uptime
free -h
vmstat 1 5
df -hT
df -i
lsblk -o NAME,SIZE,FSTYPE,MOUNTPOINTS
ip -s link
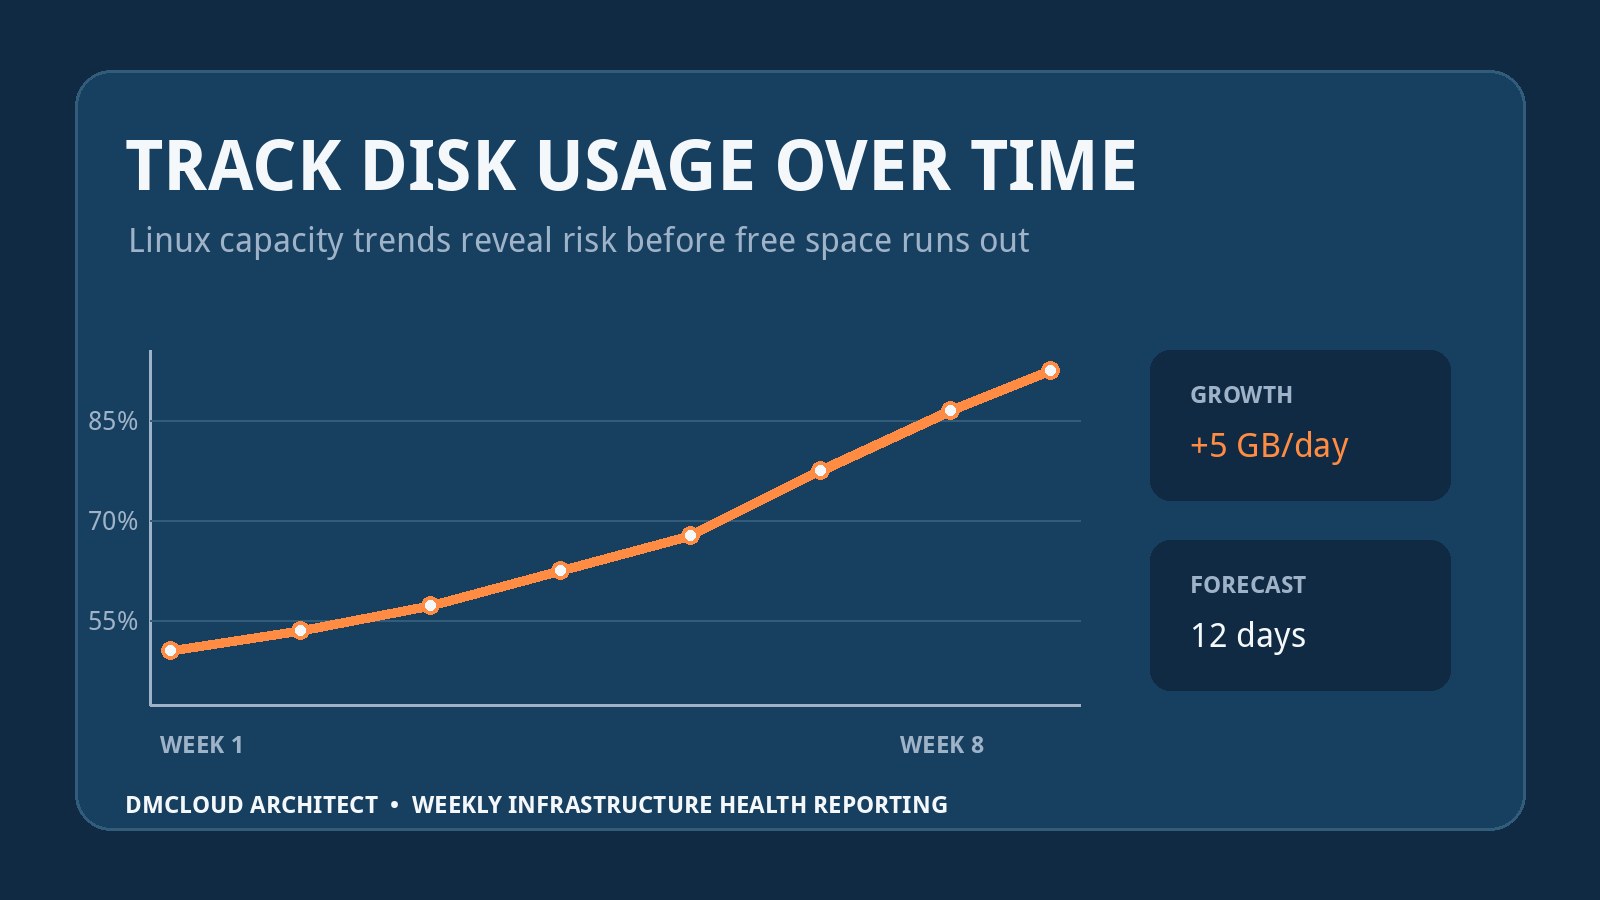
Look for trends instead of relying only on generic thresholds. A filesystem at 68% may be urgent if it is growing ten percentage points each week. A server at 85% memory use may be normal when applications use memory efficiently and there is no sustained swap pressure. Record the cause, expected range, and likely exhaustion date so a report leads to a decision rather than an unexplained warning.
3. Check service health and failed work
Review failed systemd units, unexpected restarts, application errors, scheduled jobs, and queue backlogs. A service that restarted automatically may have restored availability while leaving the underlying fault unresolved. Repeated crashes, out-of-memory kills, database connection exhaustion, or worker retries are reliability signals even when users did not report an outage.
journalctl -p warning..alert --since "7 days ago" --no-pager
journalctl --list-boots
systemctl list-timers --all
systemctl status cron 2>/dev/null || systemctl status crond
For scheduled work, verify outcomes rather than merely confirming that the scheduler fired. Check the timestamp, exit state, output record, and downstream effect. A backup command can run on time and still create an empty archive; an invoice job can exit successfully while sending zero messages because its source query failed.
4. Review security signals without drowning in logs
Security monitoring should highlight meaningful changes: new listening ports, new privileged users, altered SSH configuration, repeated login failures, disabled controls, unexpected package repositories, pending critical updates, and certificate expiry. Compare the current state with an approved baseline so routine background noise does not hide a material change.
ss -lntup
last -a | head -30
sudo journalctl -u sshd --since "7 days ago" --no-pager
getent group sudo wheel 2>/dev/null
sudo find /etc/ssh -type f -mtime -8 -ls
Use distribution-supported update tools to review security advisories and plan maintenance. Do not install every update automatically on an untested production system simply because monitoring found it. Prioritize by exploitability, exposure, affected service, vendor guidance, and rollback readiness.
Also verify that firewall, cloud security-group, and allowlist rules still match the intended access model. A host firewall can look correct while a cloud rule exposes the same service publicly. Conversely, an emergency allowlist entry may remain after the incident that justified it.
5. Treat logs as evidence, not a storage target
Useful log review answers focused questions: what failed, what changed, when did it begin, how often did it recur, and which requests or hosts were affected? Retain enough history to compare an incident with the period before it. Make sure rotation works and that logs cannot consume the root filesystem.
journalctl --disk-usage
sudo du -xhd1 /var/log | sort -h
sudo logrotate -d /etc/logrotate.conf
Centralized logs are valuable when one host might become unavailable or compromised, but small environments still need restraint. Forward high-value service, authentication, and audit logs first. Document retention and access instead of sending everything indefinitely to an expensive destination.
6. Verify backups and restoration separately
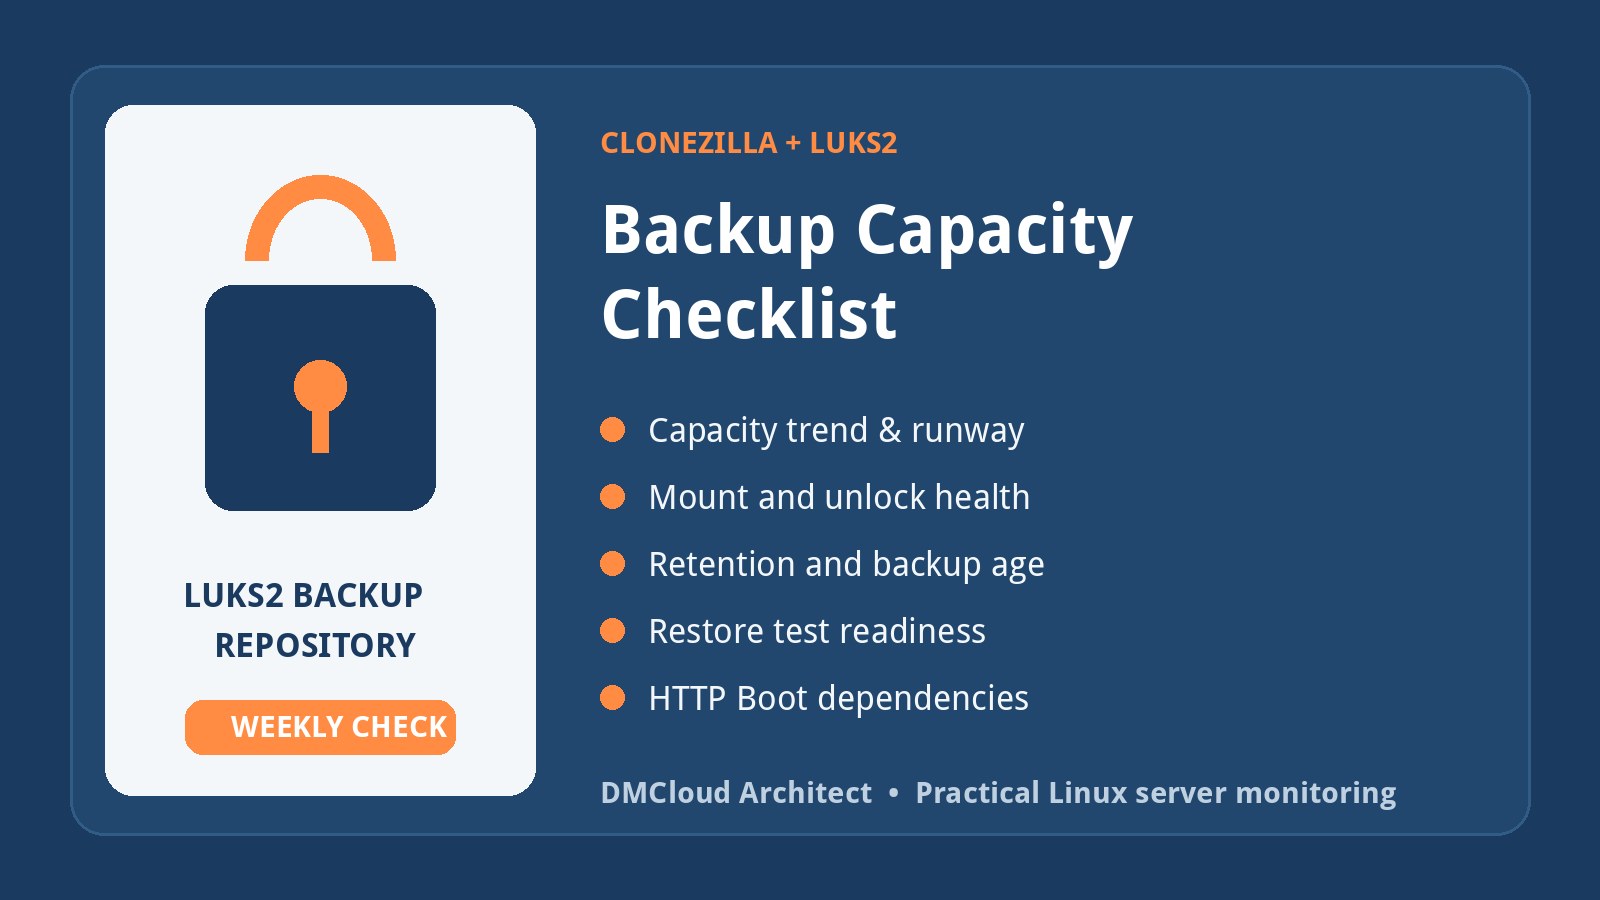
A green backup status is not proof of recoverability. For every critical system, confirm the latest successful backup, expected data size, retention policy, encryption state, off-host copy, and failed-job history. Investigate backups that become dramatically smaller or larger than their baseline.
Then test restoration. Restore a representative database, file set, or machine image into an isolated destination and verify that it is readable and internally consistent. Record the date, duration, operator, source backup, result, and any undocumented step. Recovery instructions and encryption keys must remain accessible during the type of failure they are meant to solve.
Small businesses should connect backup checks to recovery objectives. Identify how much data the business can lose and how long each service can remain unavailable. Those requirements determine backup frequency, replication, retained generations, and restoration-test cadence.
7. Monitor high availability as an end-to-end path
Multiple servers do not create high availability by themselves. Check the full request path: DNS, certificate, load balancer, application instances, database, shared storage, queues, and external dependencies. Confirm that health checks can remove a failed instance and that remaining capacity can carry realistic traffic.
Test failover under controlled conditions. Observe whether sessions, background jobs, DNS caching, database promotion, and monitoring behave as expected. Record recovery time and any manual intervention. If nobody is willing to test failover, treat the claimed redundancy as unverified.
8. Connect automation to ownership and rollback
Automation improves consistency, but an unattended script can repeat a mistake faster than a person. Track the owner, repository, version, credentials path, schedule, last success, expected output, timeout, retry policy, and rollback method for important automation. Alert on missed outcomes and excessive retries, not only process failures.
Configuration management and infrastructure-as-code should be reviewed like application code. Require change history for firewall rules, packages, users, scheduled jobs, and cloud resources. Detect drift between the approved configuration and the running environment. Keep secrets out of repositories and command output, and test restoration of the automation platform itself.
9. Make incident response part of routine monitoring
During normal operation, confirm that contact details, escalation paths, provider access, status-page credentials, and evidence-collection steps are current. Define severity in business terms: customer impact, data risk, financial exposure, and expected duration. A technically interesting warning is not automatically a critical incident, while a quiet payment-processing failure may be.
For each material event, preserve a timeline, symptoms, affected services, actions, decisions, and recovery evidence. Afterward, identify the contributing conditions and assign corrective actions with owners and dates. Root-cause analysis should improve the system, not search for someone to blame.
10. Report findings as actions
A monitoring report should help a developer or owner decide what to do next. Group findings into clear levels:
- Act now: customer-facing outage, missing backup, filesystem near exhaustion, certificate near expiry, active compromise evidence, failed required service, or unrecoverable dependency.
- Plan this week: accelerating capacity growth, recurring restarts, overdue security maintenance, stale recovery test, configuration drift, or unreliable scheduled work.
- Track: expected growth, low-risk updates, stable recurring noise, and improvements that need budget or a maintenance window.
Every finding should include the affected asset, evidence, business consequence, recommended action, owner, and target date. Compare open findings with the prior report so recurring issues cannot disappear into a fresh list each week.
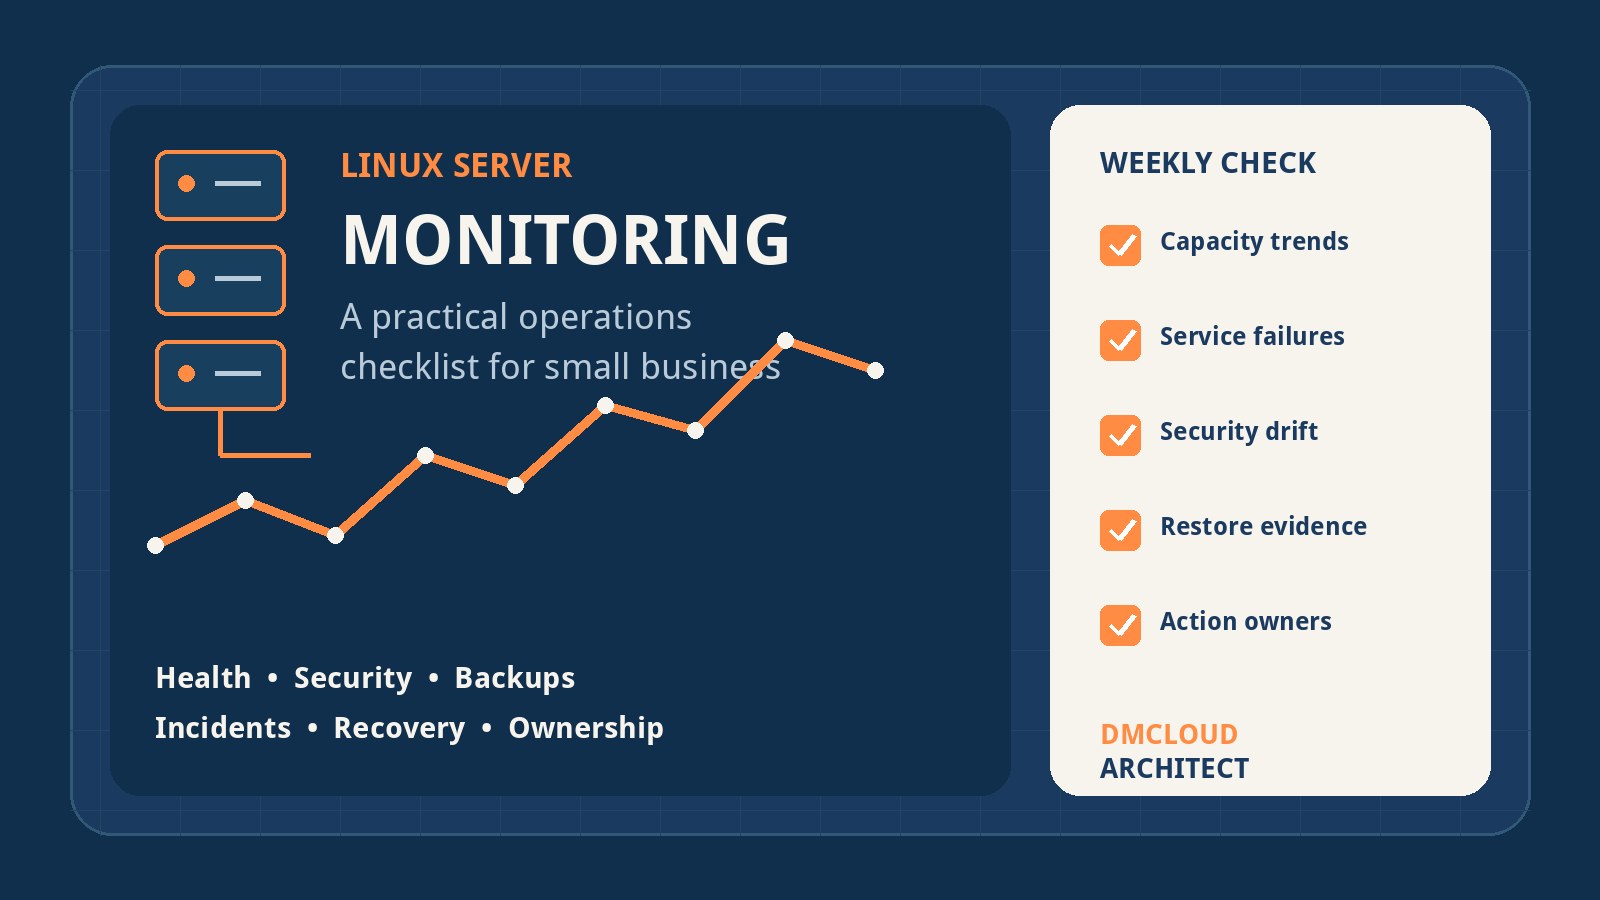
Weekly Linux server monitoring checklist
- Confirm the inventory, owners, dependencies, and customer-facing health checks.
- Review CPU, memory, swap, storage, inode, disk-latency, and network trends.
- Investigate failed units, unexpected restarts, scheduler failures, and queue backlogs.
- Compare listening ports, privileged access, login failures, firewall rules, and security updates with the approved baseline.
- Check log growth, rotation, retention, and recurring application errors.
- Verify backup recency, size, retention, encryption, off-host copies, and failed jobs.
- Confirm the latest representative restore test and recovery-key access exercise.
- Review load-balancer, database, storage, queue, DNS, and certificate dependencies.
- Check important automation for drift, missed outcomes, runaway retries, and rollback readiness.
- Review incidents and open corrective actions, then assign every new risk an owner and date.
Real-time alerting remains essential for outages, severe resource exhaustion, and security events. A weekly review adds the context alerts cannot provide on their own: trends, repeated weaknesses, recovery evidence, ownership, and priorities. That is what turns Linux server monitoring from a collection of signals into dependable infrastructure operations.
Want weekly infrastructure checks without dashboard fatigue?
DMCloud Architect turns Linux and MySQL health signals into practical weekly reports, helping developers and small business owners spot capacity drift, backup risk, security gaps, and recurring failures before they become incidents.
Get the free starter plan for weekly infrastructure health reports.