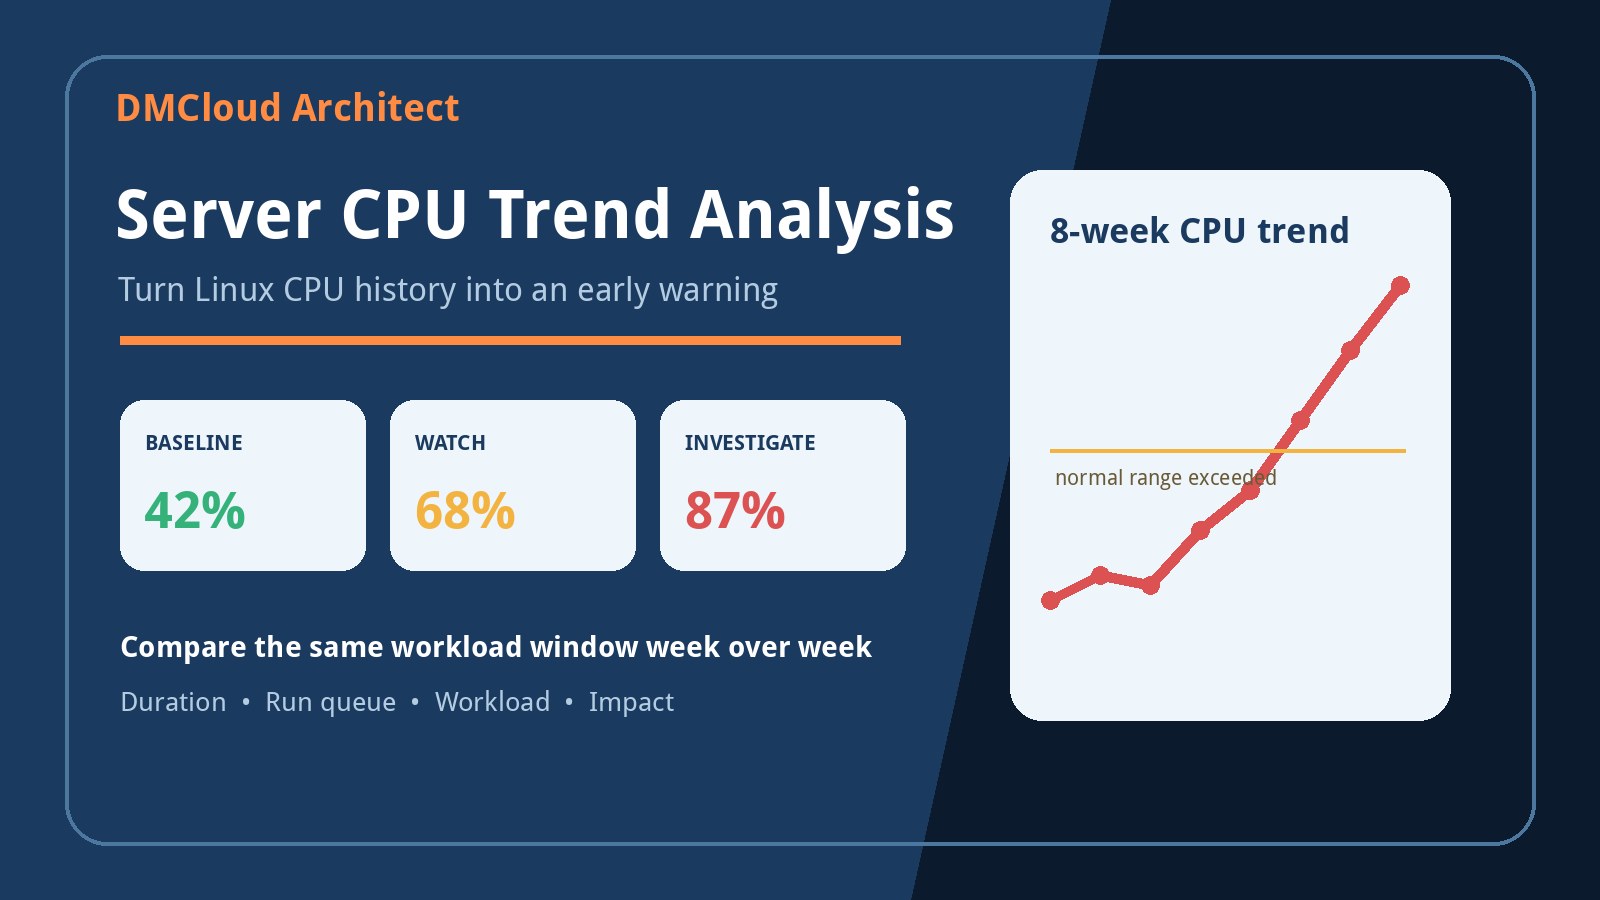
A Linux server can pass every spot check and still be moving toward a capacity problem. CPU utilization may look acceptable at 10:00 today, yet the same report, backup, or customer workload can be consuming a little more processor time each week. Server CPU trend analysis makes that gradual change visible before it becomes a slow application or missed job window.
The goal is not to collect another wall of charts. A useful trend review compares consistent periods, separates short bursts from sustained pressure, and connects host measurements to real work. Developers and small business owners can then decide whether to investigate code, reschedule a job, tune a database, or plan capacity without living in a dashboard.
Why a CPU snapshot misses performance drift
Commands such as top and mpstat are useful when a problem is happening now, but one sample has almost no historical context. Seventy percent CPU could be normal during an invoice run, unusually high for ordinary web traffic, or harmless if it lasts for only ten seconds. A snapshot cannot tell you which interpretation is correct.
Trends add three pieces of context: what is normal for this server, how long the condition lasts, and whether the workload is changing. An increase from 35 to 55 percent during the same business-hour window may matter more than an isolated peak at 95 percent. The first pattern can indicate steady growth or declining efficiency; the second may simply be a healthy batch process using available capacity.
Define the question before collecting CPU history
Start with a decision, not a metric. Are you checking whether a virtual machine has enough headroom for the next quarter? Are you trying to explain a weekly job that keeps finishing later? Do API response times rise as traffic grows? The question determines the sampling interval, comparison window, and supporting evidence.
For capacity planning, daily or weekly percentiles and sustained busy periods are often enough. For a recurring ten-minute slowdown, samples every minute may be necessary. For an application regression, compare CPU seconds per request, transaction, or processed record before and after the release. Collecting at the wrong resolution can either hide the event or produce noise without insight.
Collect the Linux CPU signals that explain the trend
Total utilization is only the starting point. Preserve the CPU breakdown into user time, system time, idle time, I/O wait, and steal time. User time usually reflects application work. System time points toward kernel activity. I/O wait suggests tasks are blocked on storage, while steal time can reveal hypervisor contention on a virtual machine.
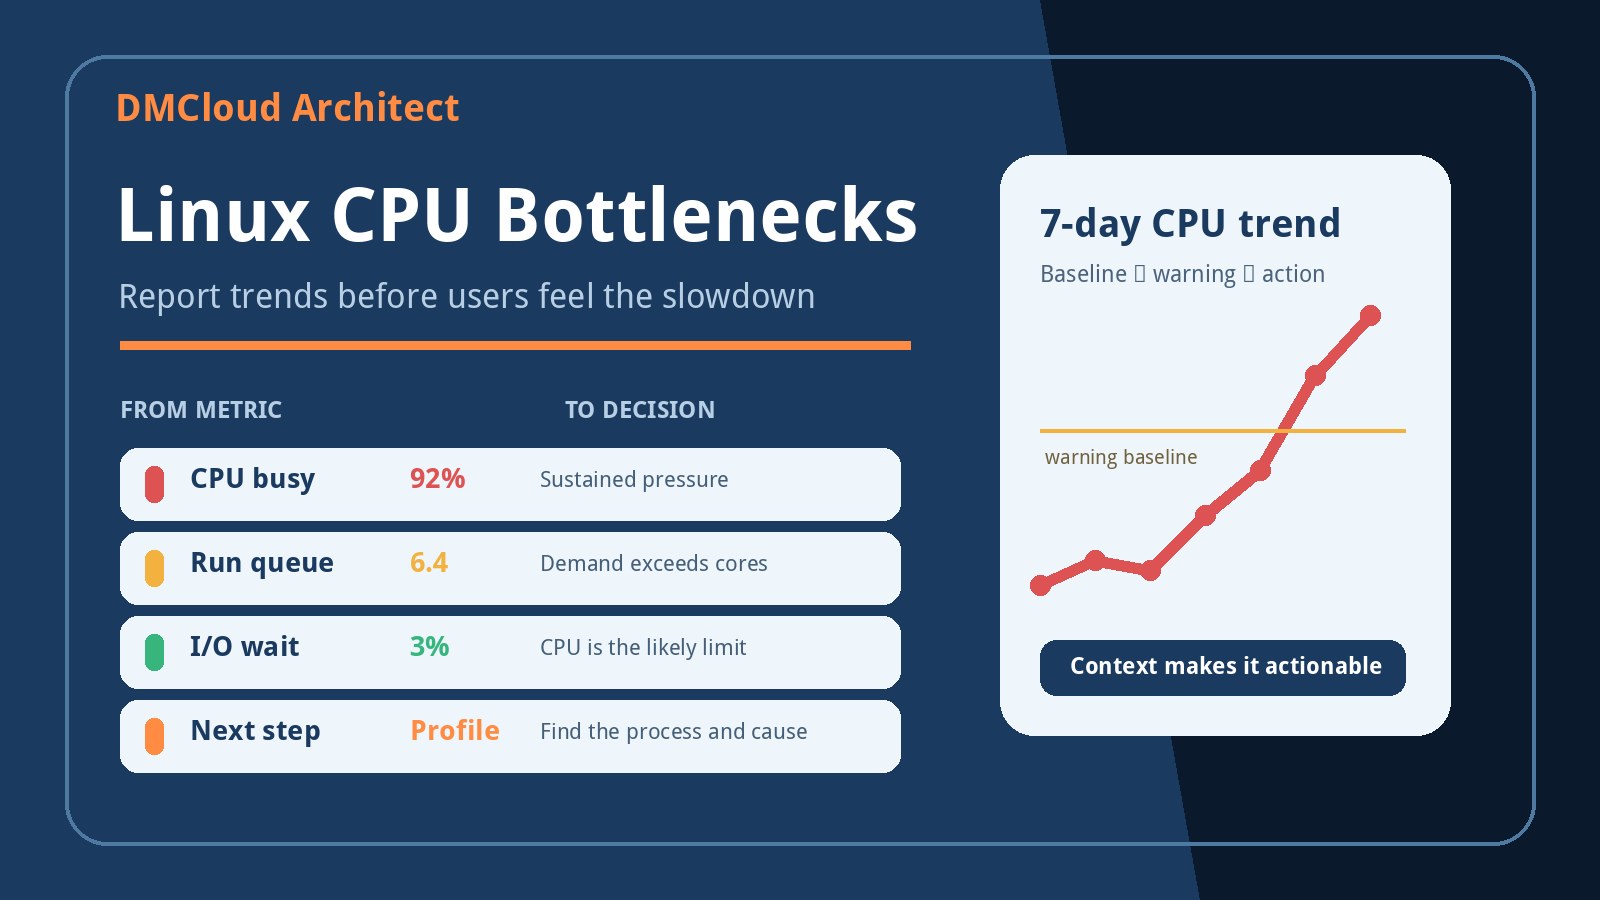
Add load average, runnable-task count, logical CPU count, and the leading processes. Load should be interpreted against available cores and alongside the run queue. A load of four can be comfortable on a sixteen-core machine but a warning on a two-core instance. Process history connects the host-level change to an application, database, agent, backup, or scheduled job.
- CPU breakdown: user, system, idle, I/O wait, and steal percentages.
- Demand: load average and the number of runnable tasks.
- Capacity: logical CPUs, VM size, container quota, and throttling.
- Attribution: top processes, services, threads, and scheduled tasks.
- Impact: response time, job duration, throughput, errors, and queue depth.
Practical tools to monitor CPU usage over time on Linux
sar from the sysstat package is a simple foundation for CPU usage history on Linux. Once collection is enabled, sar -u shows the CPU breakdown and sar -q shows load and run-queue information for stored intervals. mpstat -P ALL helps identify uneven per-core use, while pidstat records per-process CPU activity.
For lightweight custom collection, a scheduled script can capture selected values from /proc/stat, /proc/loadavg, vmstat, and process accounting into timestamped records. Keep the schema stable and record the server timezone. Stable fields matter more than an elaborate tool because they make week-over-week comparisons dependable.
Prometheus, cloud monitoring services, and commercial platforms can retain the same signals at larger scale. The analysis principles remain unchanged: use a consistent interval, preserve enough history, compare equivalent workloads, and summarize decisions rather than forwarding every raw data point.
Build a baseline that represents normal work
A baseline should describe comparable operating periods. Separate business hours from overnight jobs, weekdays from weekends, and ordinary traffic from month-end processing. Mixing unlike periods can create a broad “normal” range that hides meaningful drift.
Use several healthy weeks rather than one unusually quiet day. For each period, record typical utilization, a high percentile such as the 95th percentile, time above a chosen range, maximum run queue, and related service duration. Percentiles are often more useful than a single maximum because they reduce the influence of momentary spikes.
Document major context changes: application releases, additional customers, data growth, VM resizing, new cron jobs, or a changed container limit. A trend without this context can identify change but not explain it.
Compare the same workload window week over week
Time alignment is one of the most important parts of CPU trend monitoring on Linux. Compare Tuesday morning traffic with previous Tuesday mornings, or the current backup run with earlier backup runs. If a job starts at different times, align by job start and compare elapsed minutes instead of clock time.
Track magnitude and duration together. If peak CPU remains at 75 percent but the busy period expands from 20 to 50 minutes, demand has still increased. Likewise, a stable average can conceal short periods in which all cores are saturated and requests queue. Include the longest sustained period above the baseline and the associated run-queue behavior.
Distinguish healthy growth from declining efficiency
Rising CPU is not automatically bad. More customers, requests, or records should require more work. Normalize utilization against a unit of useful output where possible: CPU seconds per thousand requests, per report, per backup gigabyte, or per imported record.
If total CPU rises while CPU per unit remains stable, the system may be scaling predictably and need future capacity. If CPU per unit rises, investigate efficiency. Common causes include an application regression, an unindexed database query, growing lock contention, excessive logging, retries, encryption overhead, or a background service competing for resources.
This distinction improves budgeting. Predictable workload growth may justify a larger instance at a planned date. Declining efficiency deserves diagnosis before money is spent on hardware that only delays the same problem.
Rule out false CPU conclusions
A slow service with high load is not always processor-bound. Linux load includes runnable tasks and tasks in uninterruptible sleep, so storage delays can raise load even when CPUs have room. Examine I/O wait, disk latency, blocked processes, memory pressure, swapping, and database locks before naming CPU as the bottleneck.
Virtualization and containers add other traps. Elevated steal time means the guest wanted CPU but the hypervisor did not provide it. A container can be throttled by its quota while the host remains mostly idle. A single-threaded service can saturate one core while total CPU across many cores appears modest. Per-core and cgroup measurements prevent these cases from disappearing inside an average.
Use duration-aware status levels instead of noisy thresholds
A fixed warning at 80 percent CPU often produces alert fatigue. Use status rules that combine baseline deviation, duration, run-queue demand, and service impact. The exact values should reflect the server and workload rather than a universal number.
- Stable: utilization, duration, and workload-normalized CPU remain inside their expected ranges.
- Watch: the trend exceeds its baseline or headroom is shrinking, but user impact is limited.
- Investigate: sustained pressure, a growing run queue, or worsening efficiency aligns with slower work or errors.
- Plan capacity: efficiency is stable, but forecast workload will consume the remaining margin.
Duration prevents a harmless burst from receiving the same treatment as thirty minutes of saturation. Impact keeps the review focused on business and operational consequences.
Forecast when CPU headroom may become a constraint
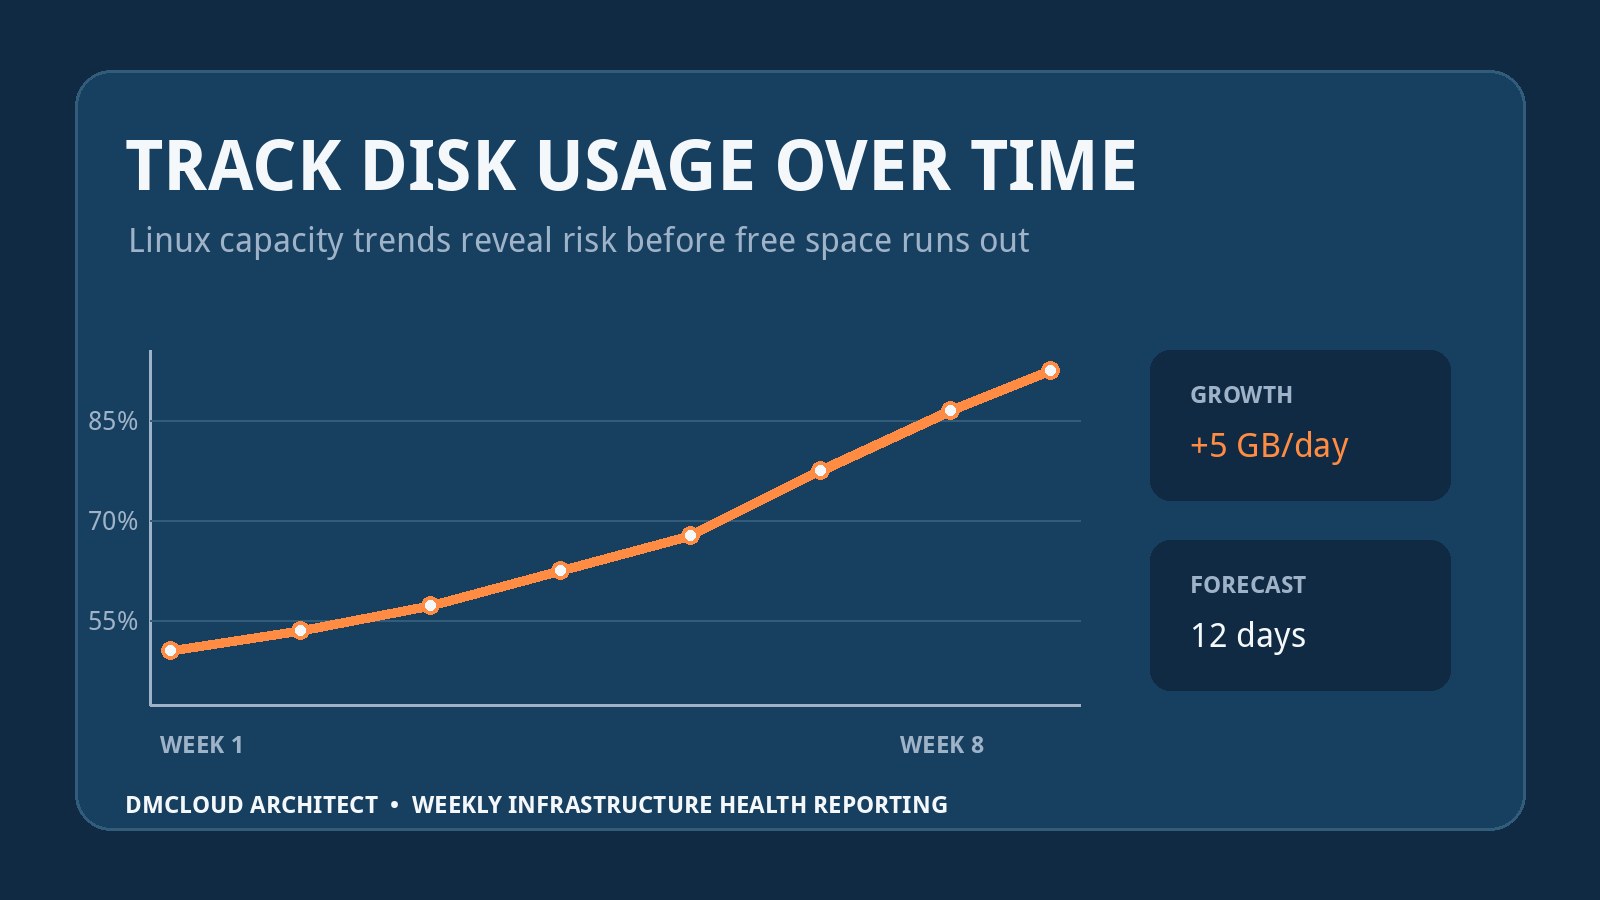
A straight-line forecast can be useful when growth is steady, but treat it as a planning estimate rather than a promise. Calculate how quickly a consistent percentile or busy-window average is changing, then estimate when it will reach the organization’s preferred operating margin. Recalculate after major releases or workload changes.
Keep intentional headroom for traffic variation, failover, maintenance, and unexpected jobs. A server that averages 70 percent during peak periods may have little room for a failed peer’s workload or a sudden report. Capacity decisions should consider resilience, not only the date at which an average reaches 100 percent.
Turn CPU trends into a concise weekly report
A useful weekly summary should be readable in minutes. Lead with status and change, provide a small amount of evidence, and name the next action. Raw command output can remain available for investigation without dominating the report.
- Status: stable, watch, investigate, or plan capacity.
- Trend: the change in a comparable CPU measure over several weeks.
- Duration: how long pressure remained above the normal range.
- Driver: the process, workload, release, or growth factor most closely associated with the change.
- Impact: response time, job completion, throughput, or error behavior.
- Action: one specific investigation, optimization, schedule change, or capacity task.
For example: “Watch: the web tier’s business-hour 95th-percentile CPU rose from 48 to 63 percent across six weeks. Request volume increased 14 percent, but CPU time per thousand requests increased 9 percent after the latest release. Profile the document-preview endpoint and review again next week.” This statement gives an owner a clear place to start.
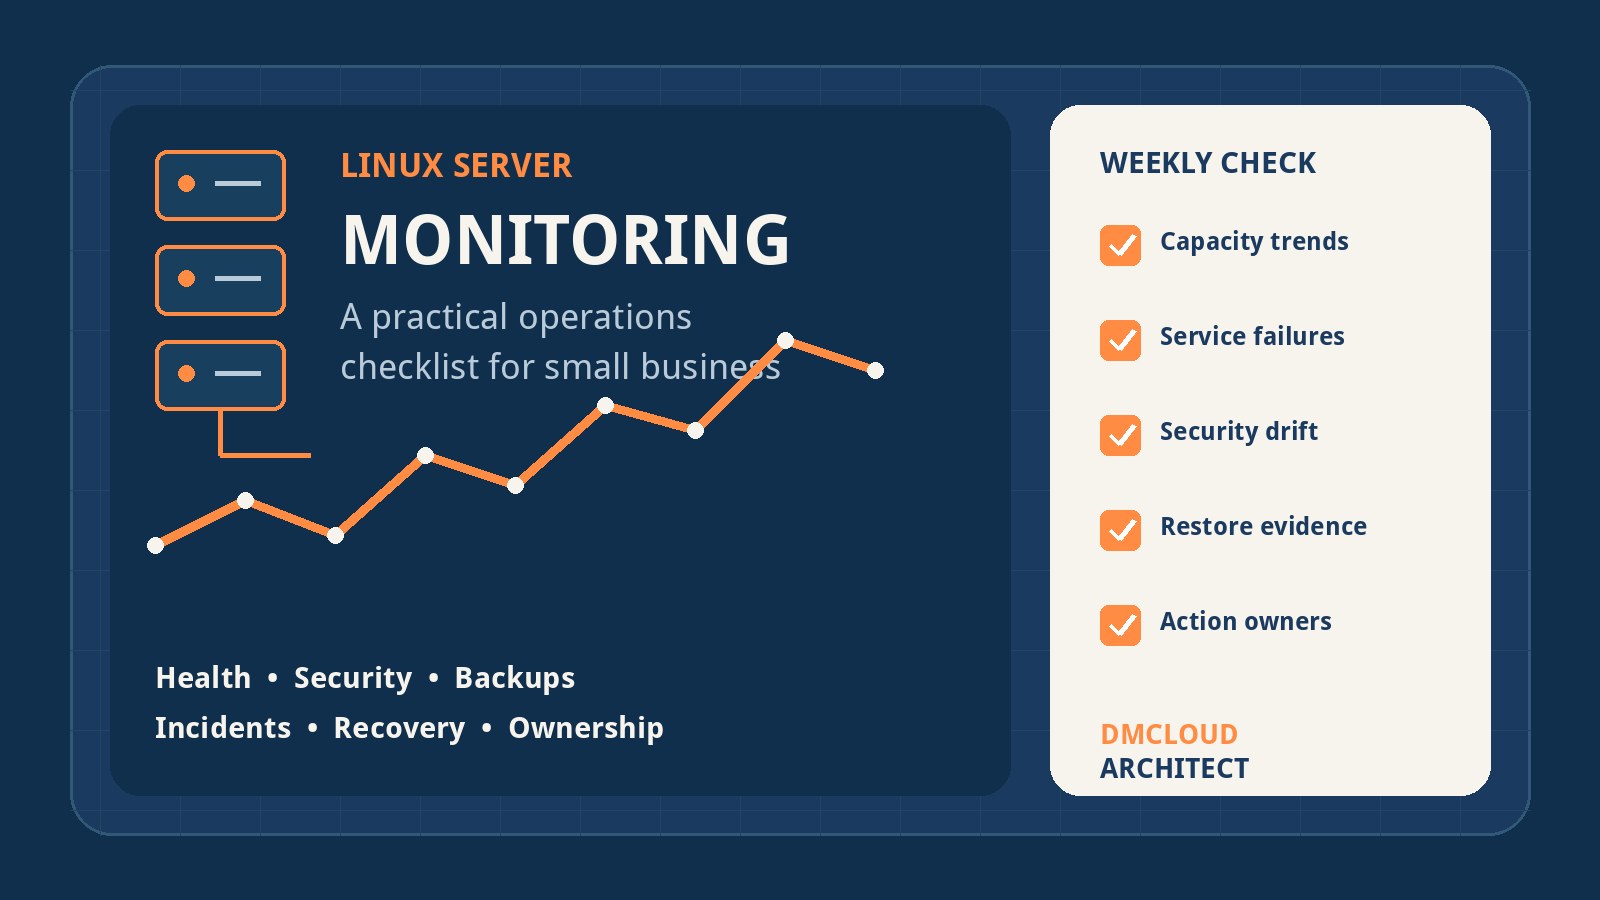
Server CPU trend analysis checklist
- Choose the operational or capacity question the review must answer.
- Collect CPU breakdown, run queue, process activity, and service impact at a useful interval.
- Record logical CPUs, VM size, container quotas, and significant configuration changes.
- Build baselines from several healthy and comparable periods.
- Compare equivalent workload windows rather than unrelated daily averages.
- Track both utilization magnitude and time above the normal range.
- Normalize CPU against requests, records, jobs, or another unit of output.
- Check I/O, memory, locks, steal time, throttling, and single-core saturation.
- Summarize status, evidence, impact, and one named next action.
See gradual CPU changes without another dashboard
Tracking CPU utilization on a Linux server is valuable when it exposes change that affects a decision. Consistent history, workload-aware baselines, duration, process attribution, and service impact turn ordinary metrics into an early warning that teams can act on.
DMCloud Architect converts Linux, MySQL, backup, and infrastructure signals into a concise weekly view for developers and small business owners. To review trends, risks, and next actions without spending every day watching dashboards, explore Infrastructure Health Reporting.