A small production server can support a website, customer portal, internal application, database, email relay, or several services at once. That makes it valuable, but it also means a single unnoticed problem can affect the whole business. Small business server monitoring should make those risks visible without asking a small team to watch graphs all day.
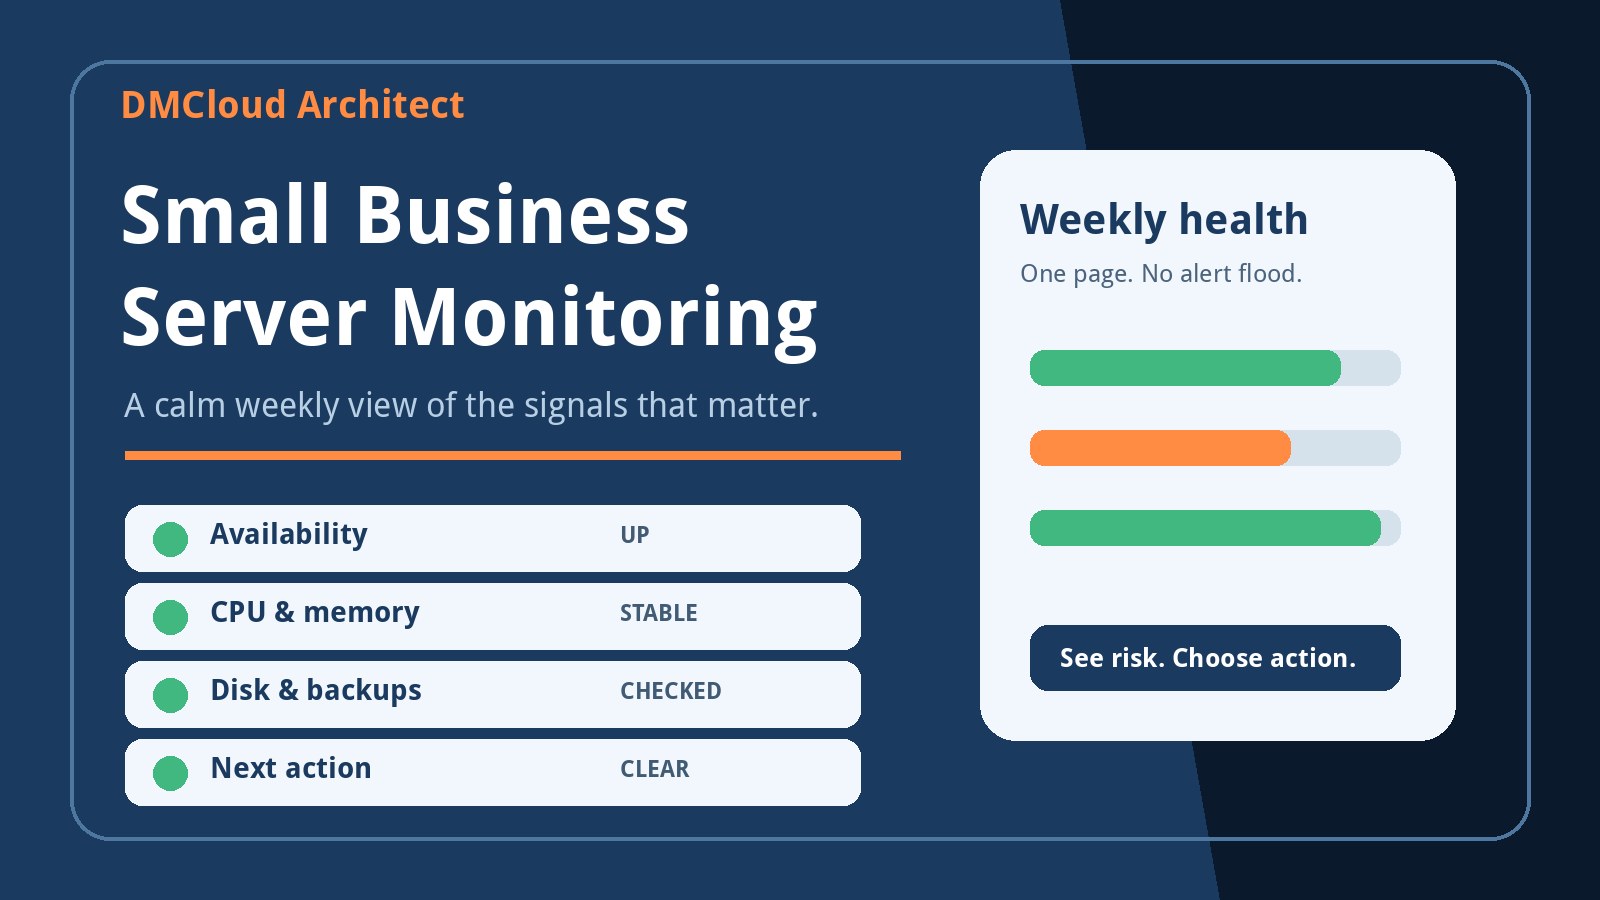
The most useful approach is usually a layered routine: immediate checks for genuine outages, a short daily confirmation for critical jobs, and a weekly health review for trends. The weekly review is where scattered measurements become a decision. It should explain what changed, why it matters, and what to do next.
Start with the services the business actually depends on
Before choosing tools or thresholds, list the services that would create a real business problem if they stopped. Examples include the public website, online ordering, a customer database, scheduled imports, file sharing, VPN access, backups, and certificate renewals. Add the owner of each service and a simple description of its expected schedule.
This prevents a common monitoring mistake: collecting many host metrics while missing the application path customers use. A server can respond to ping while its website returns errors. MySQL can run while an application account is locked. A backup process can start on time but produce an unusable file. Monitor the outcome, not only the process.
Use three monitoring layers instead of one noisy system
The first layer is availability. Check whether essential public endpoints and services respond, and notify someone when a confirmed outage needs immediate attention. The second layer covers daily operational facts such as backup completion, disk headroom, certificate expiry, and failed scheduled jobs. The third layer is a weekly report that compares resource and application trends.
This separation keeps urgent incidents urgent and routine observations calm. CPU briefly reaching 85 percent may be normal during a backup. A website being unavailable for ten minutes is different. Treating both events as identical alerts trains people to ignore notifications, which defeats the purpose of monitoring.
Check availability from the user's point of view
For a public application, test the full HTTPS endpoint rather than only checking whether the host answers. Confirm the expected HTTP status, certificate validity, and a small piece of page or API content. For private services, use a trusted internal location or VPN-connected monitor that follows the same path as staff.
Avoid declaring an outage after one failed request. Use two or three checks from an appropriate location, with short spacing, before escalating. Record response time as context, but do not turn every small latency change into an alert. The goal is to catch sustained failure and meaningful degradation.
Review CPU load in context
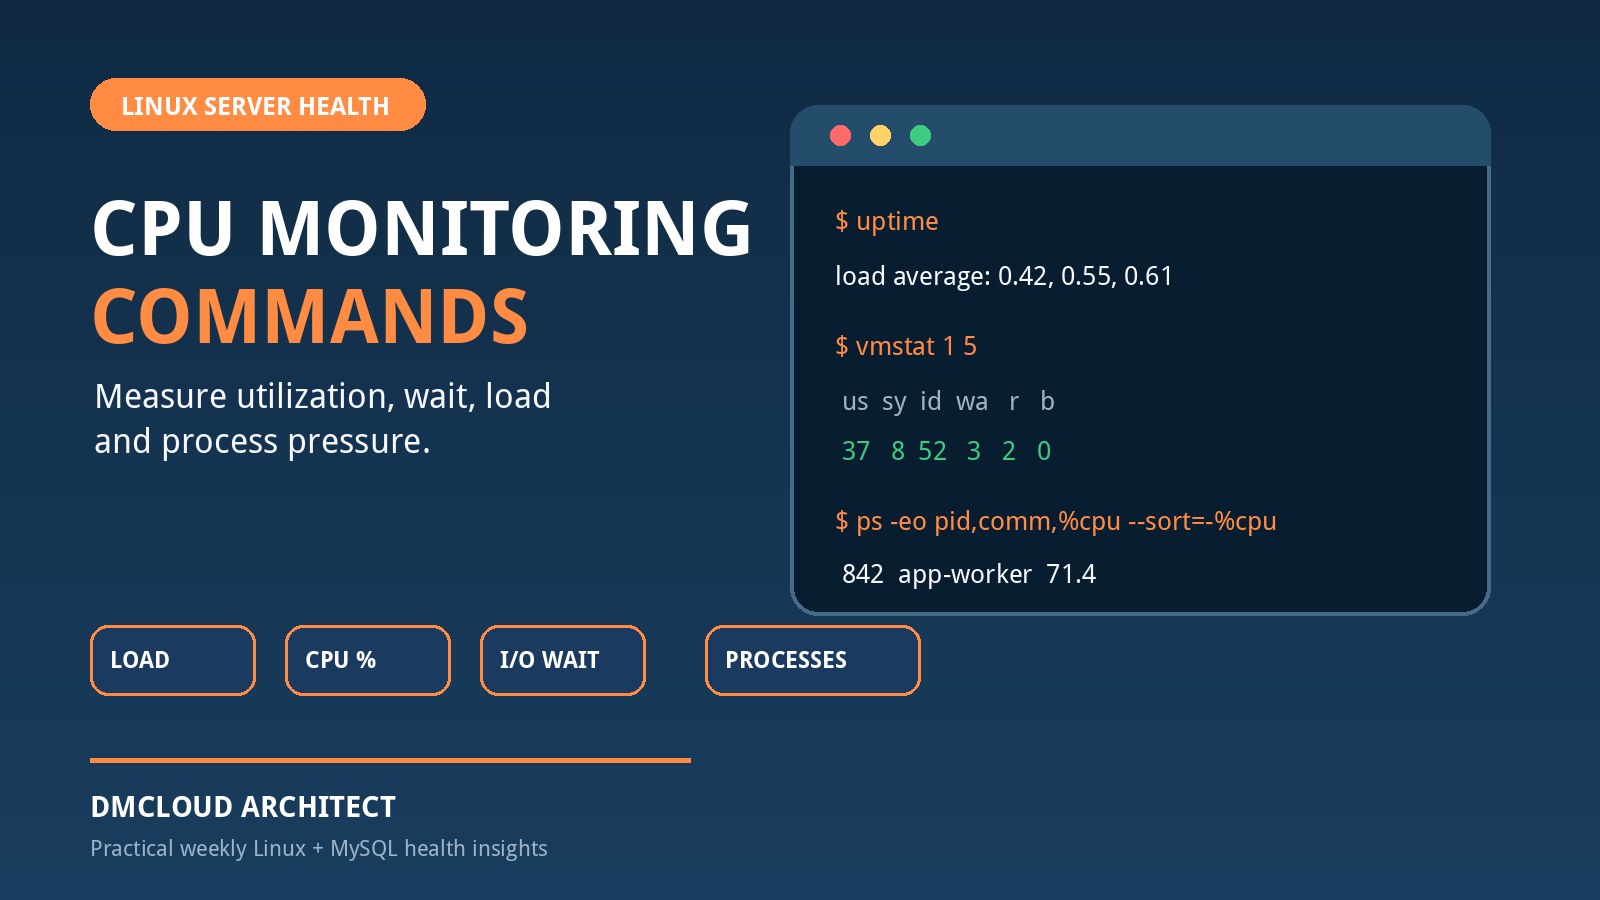
CPU usage is useful when compared with workload and history. A short peak during report generation is not automatically a problem. Sustained high utilization, rising load averages, or a service consuming more CPU each week deserves investigation. On Linux, compare load averages with the number of available CPU cores and look for processes responsible for the pressure.
The weekly report should identify whether high CPU matched a known job, traffic increase, deployment, database query, or unknown process. That context turns a percentage into an action: reschedule a job, optimize code, tune a query, remove a runaway process, or plan capacity before the next busy period.
Watch memory pressure, not just free memory
Linux intentionally uses spare memory for cache, so a low "free" value alone can be misleading. Review available memory, swap activity, out-of-memory events, and service restarts. Repeated swapping or a steadily shrinking available-memory baseline can signal a leak, an oversized service, or a server that has outgrown its workload.
Small server monitoring should also note which process changed. If memory pressure started after a release, compare service limits and application behavior before simply adding RAM. More capacity can be the right answer, but evidence helps avoid paying to hide a correctable issue.
Track disk space, inode use, and growth rate
Disk exhaustion is one of the most preventable server incidents. Check free space on every important filesystem, inode consumption, and the directories growing fastest. Logs, database files, container layers, temporary exports, and old backups are common causes. A percentage without a growth rate is incomplete because 30 percent free may mean months of capacity or only a few days.
Set thresholds with enough time for a safe response. Cleaning production storage in a panic can cause more damage than the original growth. A weekly trend supports planned log rotation, retention changes, archival, or volume expansion before applications fail.
Verify backups as recoverable assets
A green backup job is not the same as a recoverable backup. Confirm completion time, file size, retention, off-server storage, and recent restore-test evidence. Watch for zero-byte files, suddenly smaller archives, permissions failures, expired cloud credentials, and backups that now overlap business hours.
At least periodically, restore a representative backup into a safe environment and confirm that the application or database can use it. The weekly report can show the latest successful backup and the date of the latest restore test. That gives owners a much clearer view of recovery readiness.
Include database health where it affects the application
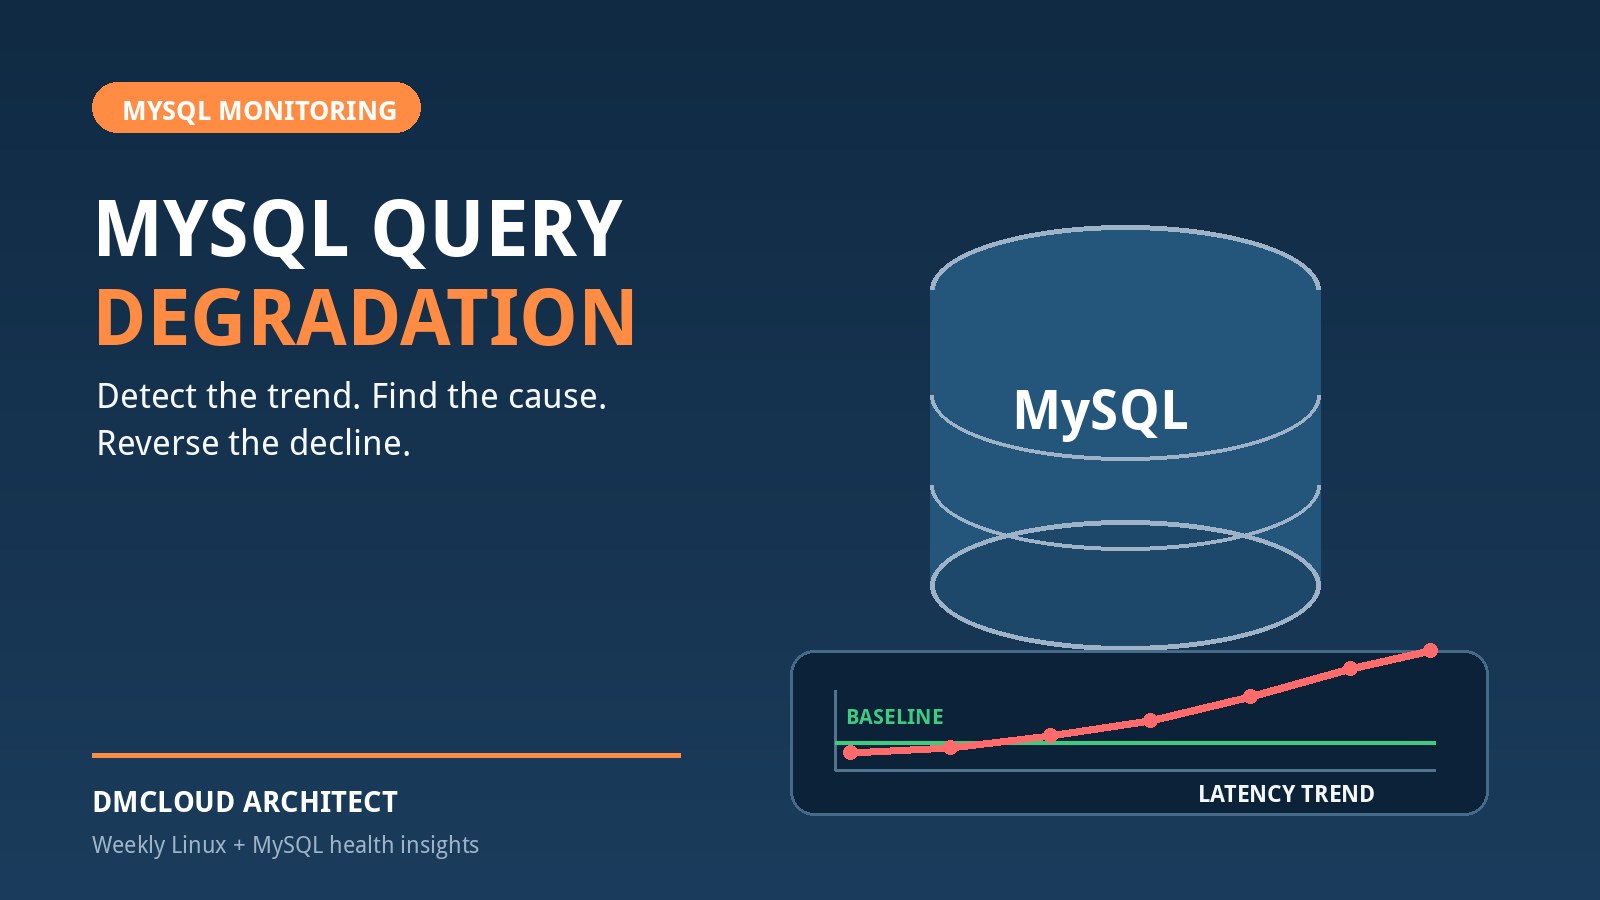
If the server runs MySQL or another database, include connections, slow queries, storage growth, failed jobs, replication status, and backup health. A small production database often gives warning before users report problems: query times rise, connections accumulate, or a table grows faster than expected.
Keep the database section concise. Highlight changes that affect reliability or customer experience, and attach one recommended next step. The report should not require a business owner to interpret dozens of engine counters.
Monitor certificates, patching, and security signals
Record certificate expiry windows, operating system update status, failed login trends, firewall changes, and unexpected listening services. These are practical security checks for a small environment because they catch common operational gaps without pretending that a single tool replaces a security program.
Use severity carefully. An available security update can be scheduled according to risk and maintenance policy. A certificate expiring tomorrow or an unexpected public service needs faster action. Clear priority helps a small team spend limited time on the right issue.
Build thresholds from normal behavior
Generic thresholds are a starting point, not a finished policy. Observe a few normal weeks, including backups and busy periods, then define stable, watch, and action-needed ranges. Add duration so a brief spike does not trigger the same response as sustained pressure.
- Stable: the signal remains within the expected range and no action is required.
- Watch: the value or trend changed enough to review during the next planned work period.
- Action needed: reliability, capacity, recovery, or security is likely to suffer without intervention.
Every watch or action-needed item should include a reason and owner. "Disk warning" is vague. "Application volume grew 8 GB this week and may reach 90 percent in three weeks; review log retention by Friday" is useful.
A practical weekly server monitoring checklist
- Confirm essential websites, APIs, and private services respond as expected.
- Compare CPU load, memory pressure, swap, and service restarts with recent weeks.
- Review filesystem space, inode use, and the fastest-growing directories.
- Verify backups completed, look plausible, are retained off-server, and have current restore-test evidence.
- Check database connections, slow queries, storage growth, and replication where applicable.
- Review failed scheduled jobs, certificate expiry, update status, failed logins, and unexpected open services.
- Assign an owner and due date to each item that needs attention.
Keep the report short enough to use
A lightweight monitoring solution succeeds when the team reads it and acts on it. Lead with an overall status, list the few meaningful changes, show compact trends, and finish with next actions. Keep raw command output and detailed charts available for investigation, but do not make them the main report.
This model gives developers enough technical context while giving small business owners a clear answer to the question that matters: is the infrastructure healthy, and does anything need attention this week?
Turn server signals into a weekly decision
Monitoring is not about collecting the largest number of metrics. It is about finding meaningful change early enough to respond calmly. A consistent weekly plan creates a baseline, exposes trends, and makes maintenance easier to prioritize without adding dashboard fatigue.
DMCloud Architect provides weekly Linux, MySQL, backup, and infrastructure health reports for developers and small business owners. To see how a concise report can turn server signals into clear next actions, visit Infrastructure Health Reporting.