CPU spikes don’t usually show up as a single dramatic event. More often, they creep up over time—like a slow leak in your infrastructure. One week everything looks fine, and a few weeks later your server starts feeling sluggish, jobs take longer, and users notice delays.
That’s why learning how to track CPU utilization on a Linux server properly matters. Not just in real time, but over time. Because real problems aren’t about a single spike—they’re about trends.
Why CPU Tracking Over Time Matters
Most teams rely on tools like top or htop. These are great for real-time visibility, but they don’t answer the bigger question:
Is CPU usage getting worse over time?
Here’s the thing—without historical visibility, you’re always reacting. You notice issues only when performance drops or alerts fire.
But this is where it matters. CPU trend monitoring helps you:
- Identify gradual performance degradation
- Spot workload growth before saturation
- Understand peak usage patterns
- Plan capacity upgrades more accurately
Common Mistake: Real-Time Only Monitoring
A typical setup might look like this:
top
htop
uptime
This gives you instant feedback—but zero history.
If CPU usage hits 90% right now, you can see it. But you won’t know if:
- It’s a rare spike
- It’s happening every hour
- It’s been increasing steadily for weeks
This is exactly why many teams struggle with “random” performance issues that aren’t actually random.
Minimal Approach to Track CPU Utilization
You don’t need a heavy stack like Prometheus or Grafana to get useful insights. A minimal Linux monitoring setup can still give you reliable CPU usage history.
Step 1: Use sar for Historical Data
The sar tool (from sysstat) is one of the simplest ways to monitor CPU usage over time.
# Install sysstat
sudo apt install sysstat

# Enable data collection
sudo systemctl enable sysstat
sudo systemctl start sysstat
Once enabled, your system starts collecting CPU metrics automatically.
To view CPU usage trends:
sar -u 1 5
Or for historical daily data:
sar -u -f /var/log/sysstat/sa10
Step 2: Log CPU Usage Periodically
If you want more control, you can log CPU usage manually using a cron job.
* * * * * top -bn1 | grep "Cpu(s)" >> /var/log/cpu_usage.log
This builds a simple CPU usage history you can analyze later.
Step 3: Convert Logs into Trends
Raw logs aren’t enough—you need to visualize trends.
Even a simple approach works:
- Parse logs with
awkor Python - Generate daily averages
- Plot graphs using lightweight tools
This turns raw CPU usage into something actionable.
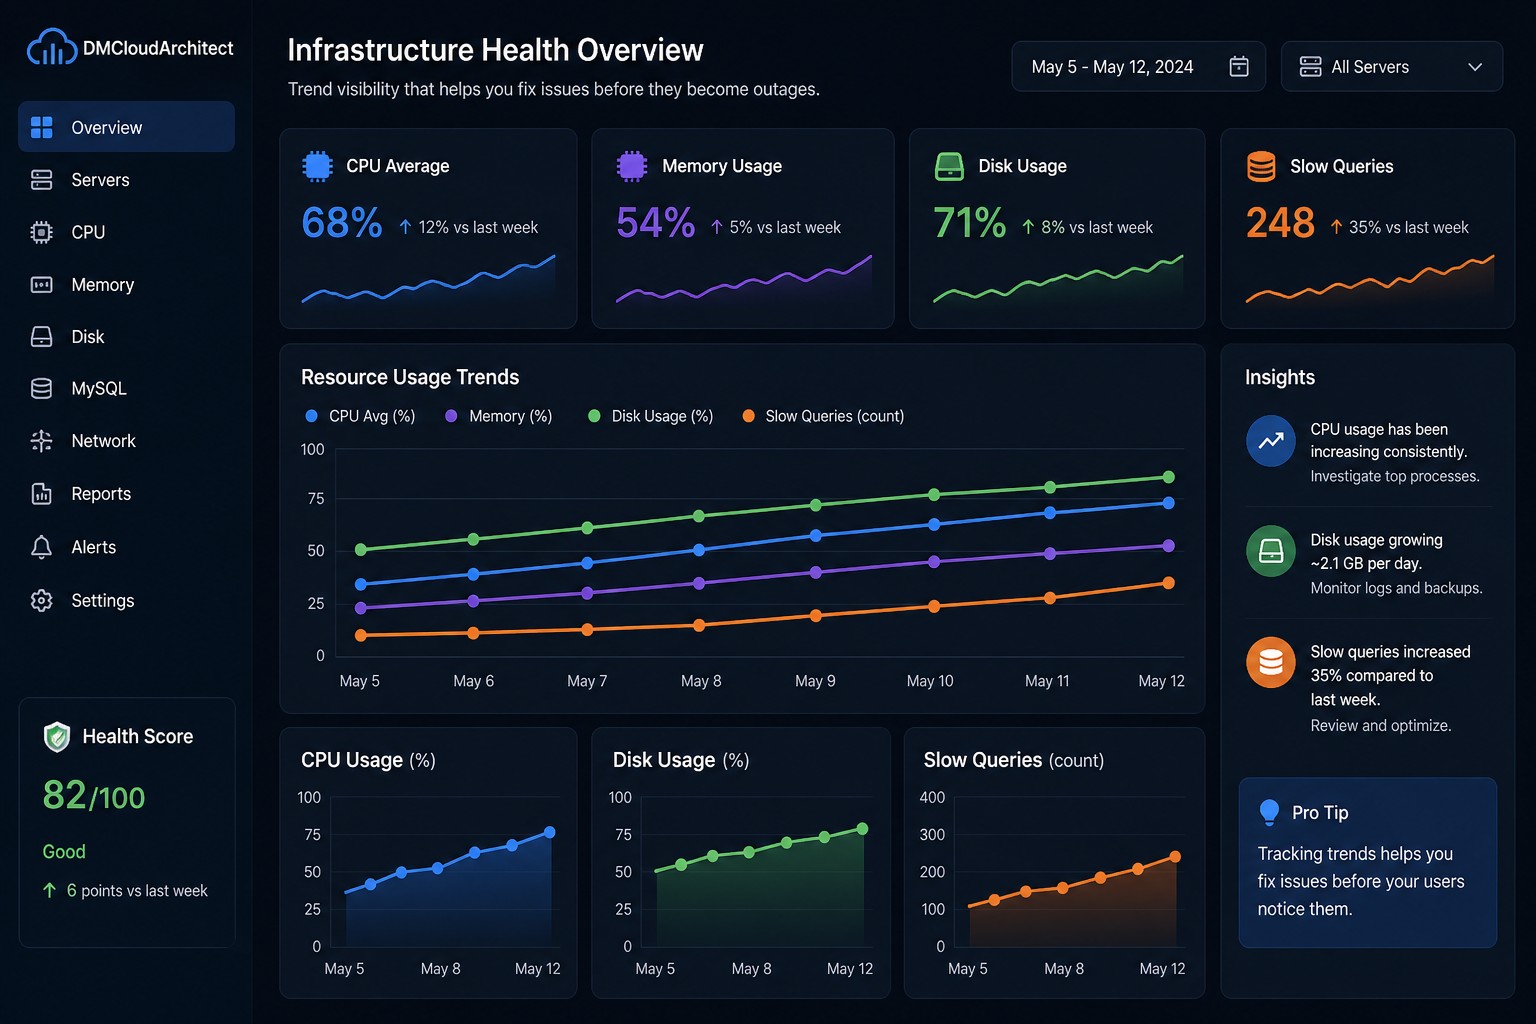
Real-World Example: CPU Growth Over Time
Let’s say you’re running a small application server.
At first, CPU usage averages around 25%. Everything looks stable.
Over the next month:
- Week 1: 25%
- Week 2: 35%
- Week 3: 50%
- Week 4: 70%
No alerts triggered. No crashes.
But the trend is clear—your server is heading toward saturation.
This is exactly what CPU usage trends in Linux are meant to reveal. Without tracking over time, you wouldn’t notice until performance degrades significantly.
Lightweight vs Heavy Monitoring Tools
There’s a common assumption that you need a full observability stack to monitor CPU usage properly.
But for many small teams, that’s overkill.
Lightweight Setup
sysstat (sar)- simple logging
- basic trend analysis
Pros:
- Low overhead
- Easy to maintain
- Works on any Linux server
Heavy Stack (Prometheus + Grafana)
- Real-time dashboards
- Advanced querying
- Alerting systems
Cons:
- Higher complexity
- Maintenance overhead
- Often unnecessary for small environments
So what does this mean in practice?
You don’t need to over-engineer your monitoring just to understand CPU growth trends.
What to Actually Track
When monitoring CPU usage history, focus on:
- User CPU (%) – application workload
- System CPU (%) – kernel operations
- Idle (%) – available capacity
- Load average – system pressure
Tracking these over time gives you a much clearer picture than a single snapshot.
Turning CPU Data into Decisions
Collecting CPU metrics is only useful if it drives decisions.
For example:
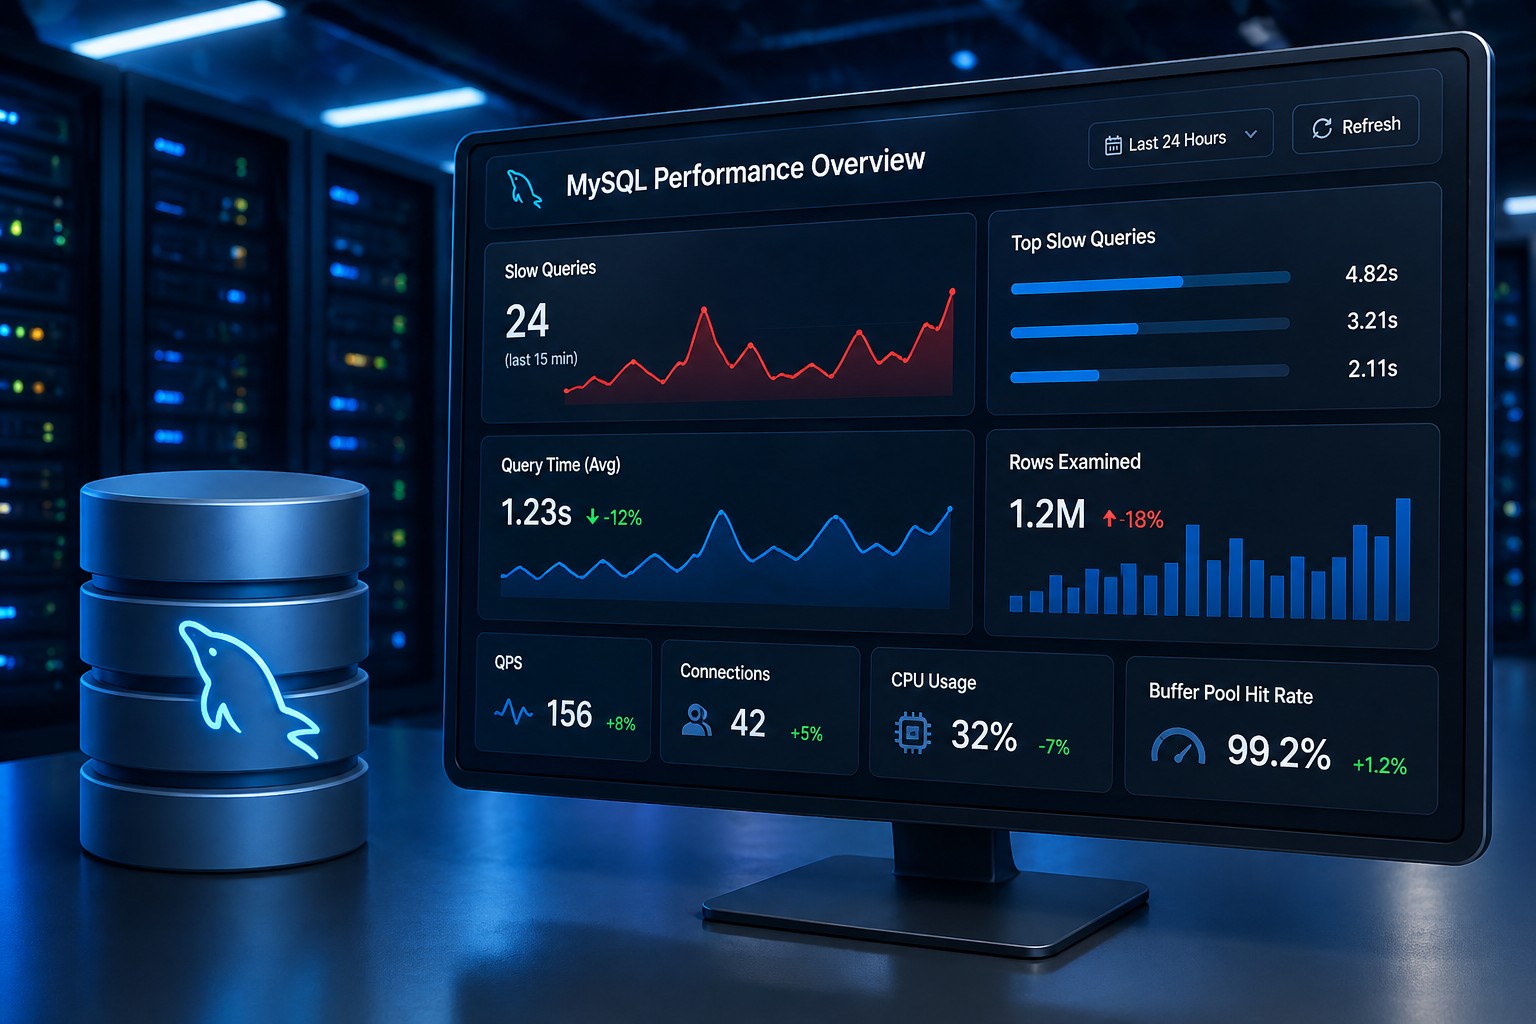
- Rising CPU trend → investigate inefficient queries or code
- Frequent spikes → identify batch jobs or cron tasks
- High system CPU → check I/O or kernel bottlenecks
This is where simple linux monitoring solutions become powerful—they give you just enough visibility without overwhelming you.
Summary
Tracking CPU utilization on a Linux server isn’t about watching a live dashboard all day. It’s about understanding how your system behaves over time.
A minimal setup using tools like sar and simple logging can already give you meaningful insights into CPU growth trends, usage patterns, and early warning signs.
You don’t need complex monitoring stacks to get started—you just need consistent data and a way to interpret it.
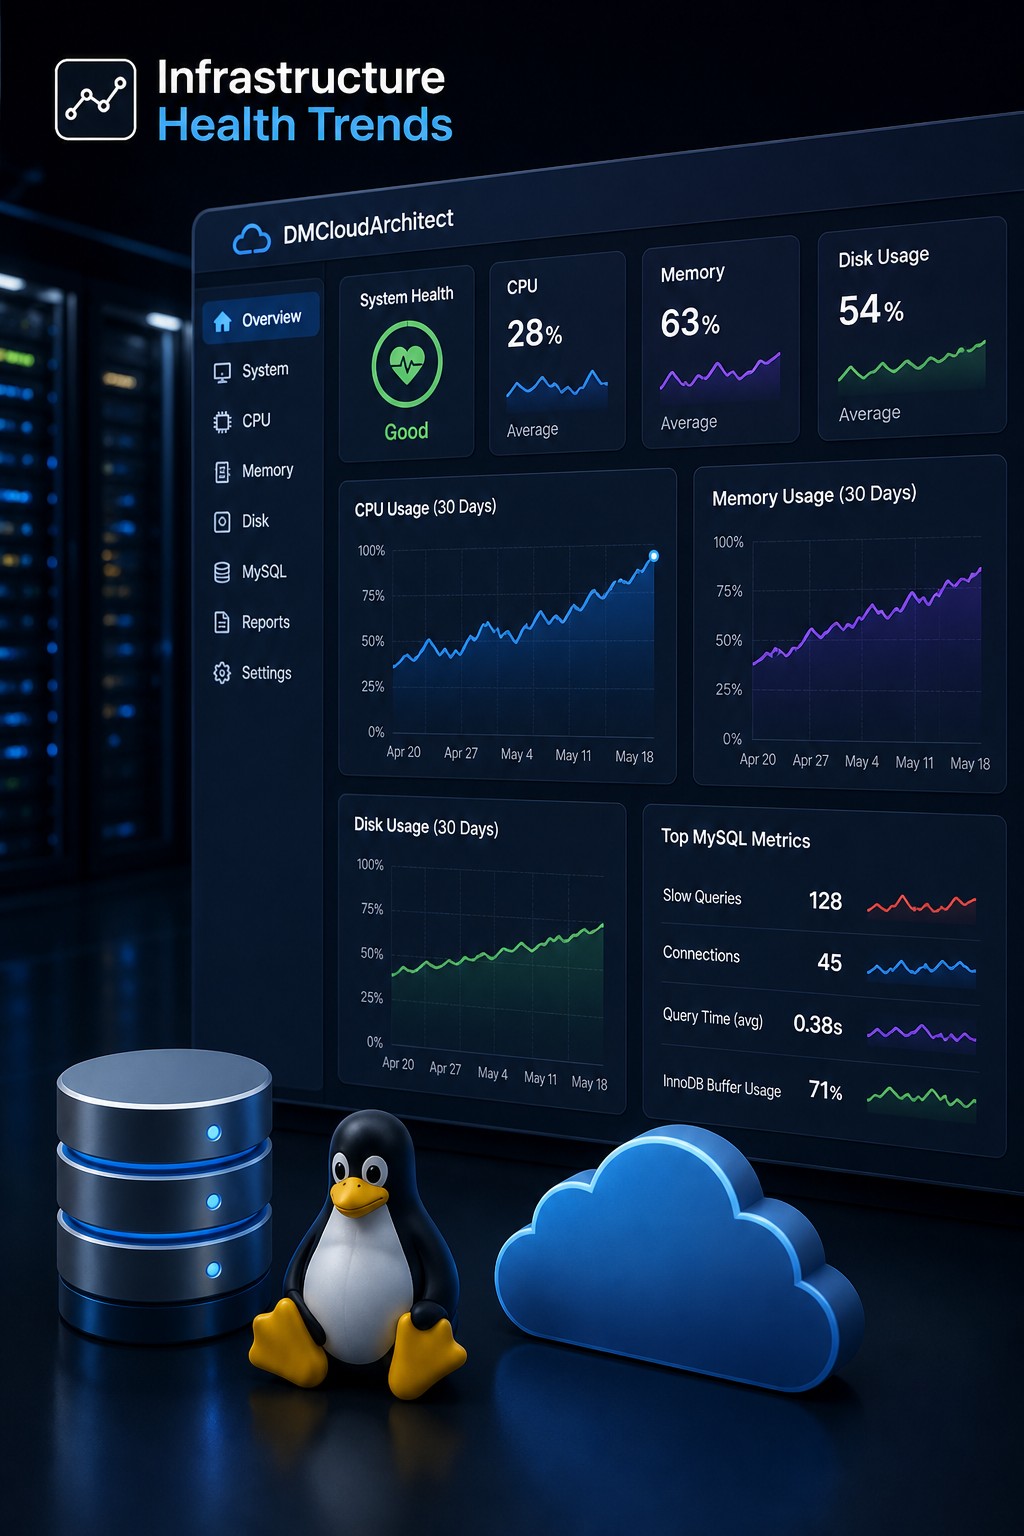
If you want to move beyond raw metrics and start seeing real infrastructure trends, take a look at Infrastructure Health Reporting. It helps you understand how your systems evolve over time—before problems turn into outages.