Most monitoring setups are built around alerts. When something crosses a threshold—CPU spikes, disk fills up, memory runs low—you get notified.
It sounds efficient. And in many cases, it is.
But over time, you start noticing a pattern. Issues don’t come out of nowhere. They build slowly, quietly, and often go unnoticed until the alert fires.
And by then, you're already reacting.
So the question becomes: how do you catch problems before they reach that point?
Why Alerts Alone Keep You Reactive
Alerts are designed to trigger at a specific moment. A threshold is crossed, and you take action.
This works well for sudden failures. But most infrastructure issues aren’t sudden.
They evolve:
- CPU usage slowly increases over time
- Disk usage grows day by day
- Database queries become slightly slower each week
None of these trigger alerts early on. But they’re exactly the signals that lead to future incidents.
So while alerts feel proactive, they often just help you react faster—not earlier.
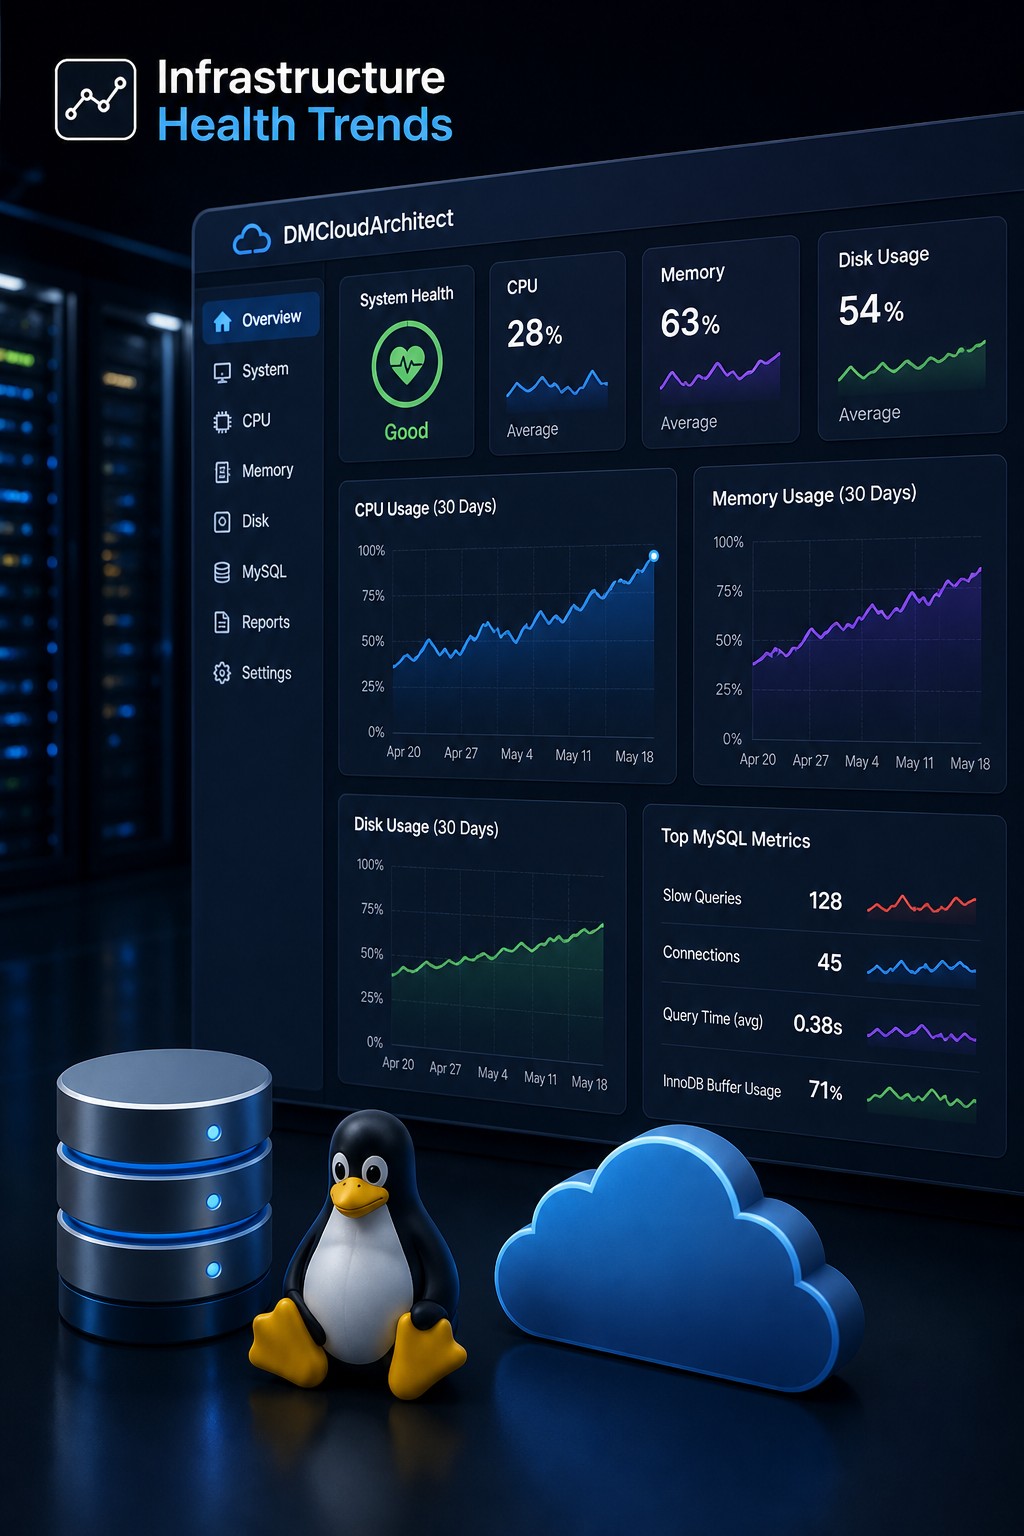
What Infrastructure Trends Actually Show
Trend-based visibility changes the perspective.
Instead of looking at isolated events, you start looking at behavior over time.
This allows you to answer better questions:
- Is resource usage steadily increasing?
- Is performance degrading gradually?
- Are patterns repeating week after week?
These insights don’t come from alerts. They come from observing how systems evolve.
And that’s where real prevention happens.
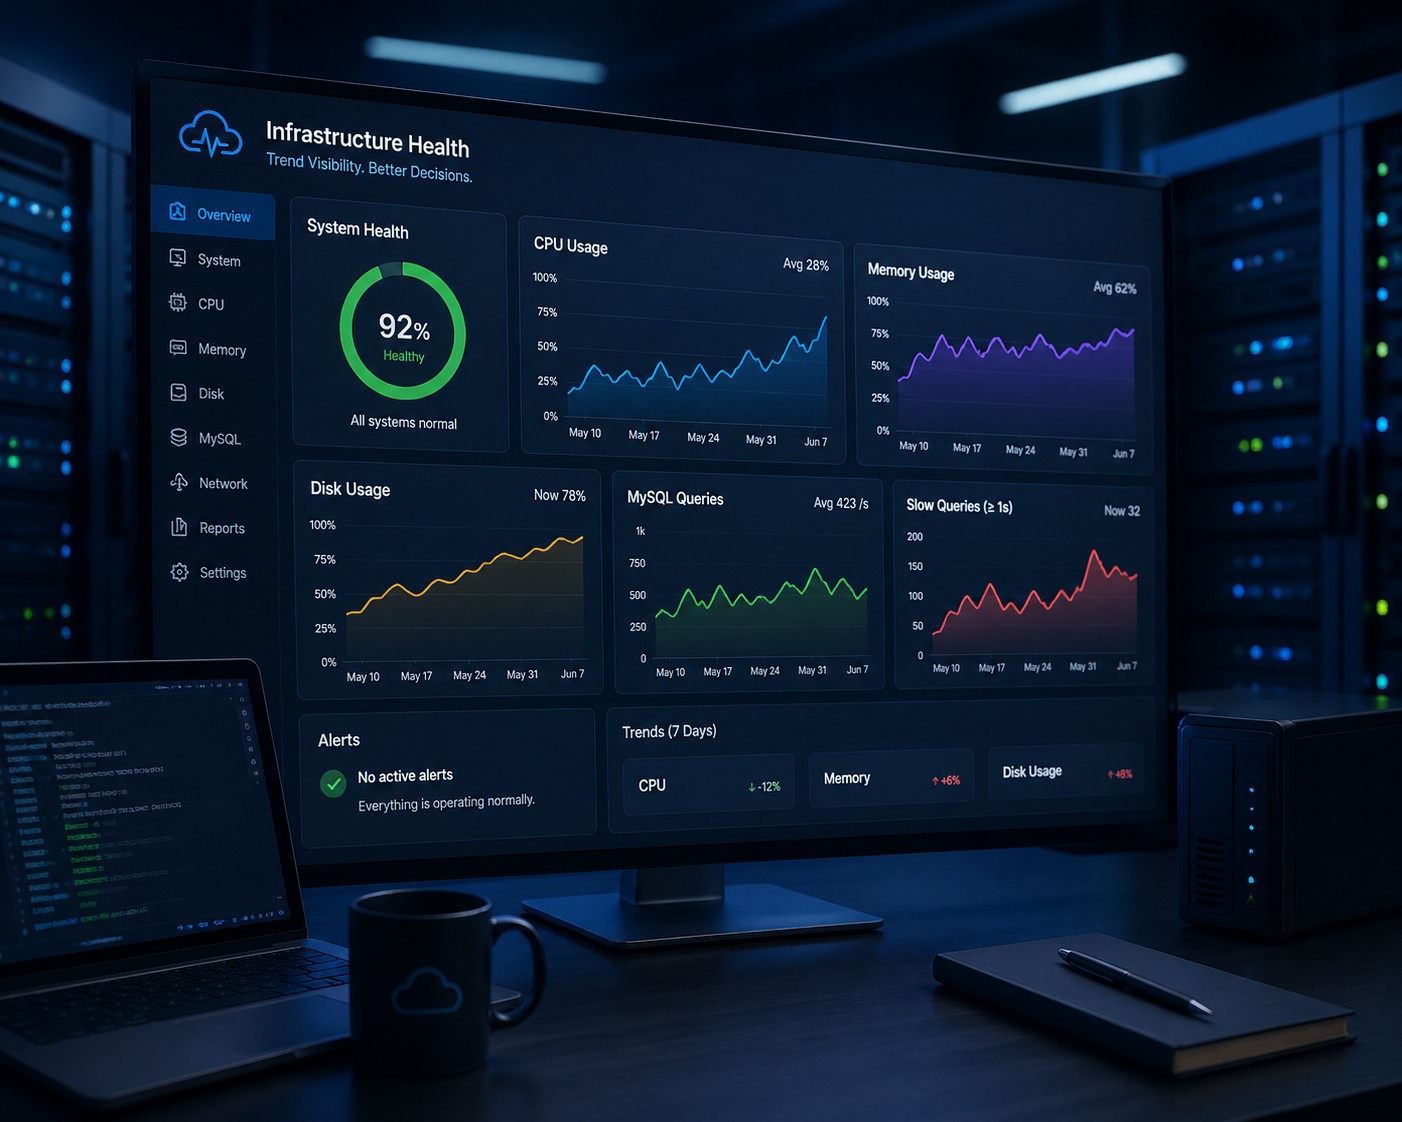
Example: Disk Growth Over Time
Consider a server with no current disk issues.
Everything looks stable. No alerts. No warnings.
But when you look at the trend:
- Week 1: 45% usage
- Week 2: 52%
- Week 3: 61%
- Week 4: 73%
No alert has triggered yet. But the trajectory is clear.
If nothing changes, you’ll hit critical levels soon.
With alerts alone, you act late. With trends, you act early—before it becomes urgent.
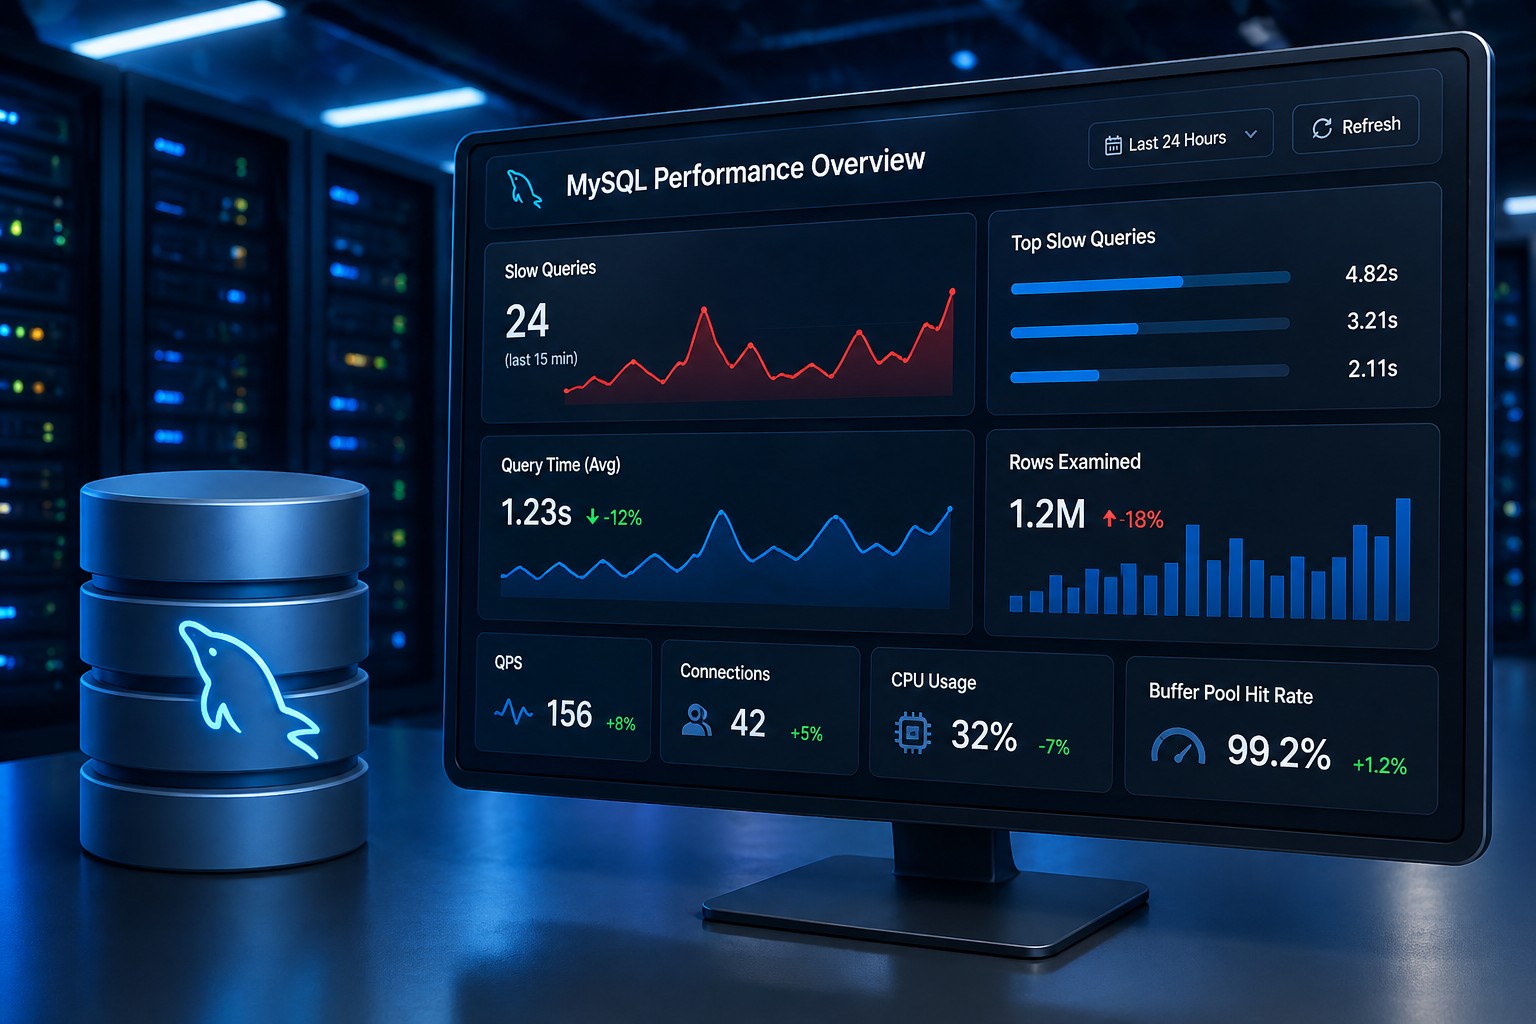
CPU Trends and Hidden Load Problems
CPU issues are often subtle at first.
You might see small increases that don’t seem significant individually. But over time, they add up.
This can happen due to:
- New application features
- Background jobs increasing in frequency
- Inefficient queries gradually growing in volume
Trend visibility helps you connect these changes before they impact performance.
Why This Approach Works Better for Small Teams
If you're managing infrastructure with a small team—or even alone—you don’t have time to constantly respond to alerts.
You need clarity, not noise.
Trend-based insights give you a high-level view of system health without requiring constant attention.
You can quickly see:
- What’s stable
- What’s changing
- What needs attention soon
This reduces firefighting and helps you plan instead of react.
Combining Alerts and Trends the Right Way
This isn’t about replacing alerts completely.
Alerts still serve an important role. They notify you when something needs immediate action.
But trends provide the context alerts lack.
Together:
- Alerts handle immediate issues
- Trends help you prevent future ones
This combination gives you both responsiveness and foresight.
What This Means in Practice
Instead of only responding to alerts, you begin reviewing your infrastructure regularly.
Even a simple weekly review can reveal:
- Gradual increases in resource usage
- Slow performance degradation
- Unusual patterns developing over time
These are the early signals of future problems.
And they’re much easier to fix when you catch them early.
Summary
Alerts tell you when something is already wrong. Trends show you how problems develop.
If you rely only on alerts, you’ll always be reacting under pressure.
But when you start paying attention to trends, you gain time—and that changes everything.
You begin fixing issues before they escalate, reducing downtime and avoiding unnecessary stress.
For teams that want better control without adding complexity, trend-based visibility is a practical and effective shift.