The short version: iproute2 is the right tool for humans, scripts, runbooks, and most operational checks. rtnetlink is the kernel API underneath it, and it becomes useful when you are building software that needs structured network state, event subscriptions, or tighter control than shelling out to ip can provide.
For developers and small business infrastructure teams, the decision is rarely about being more “low level” for its own sake. It is about choosing the interface that is safest to operate, easiest to debug, and reliable enough for the job. In linux server monitoring, that often means using simple commands for weekly health evidence, and only moving to rtnetlink when you are building a real agent or networking component.
1. Use iproute2 when a human needs to inspect or change state
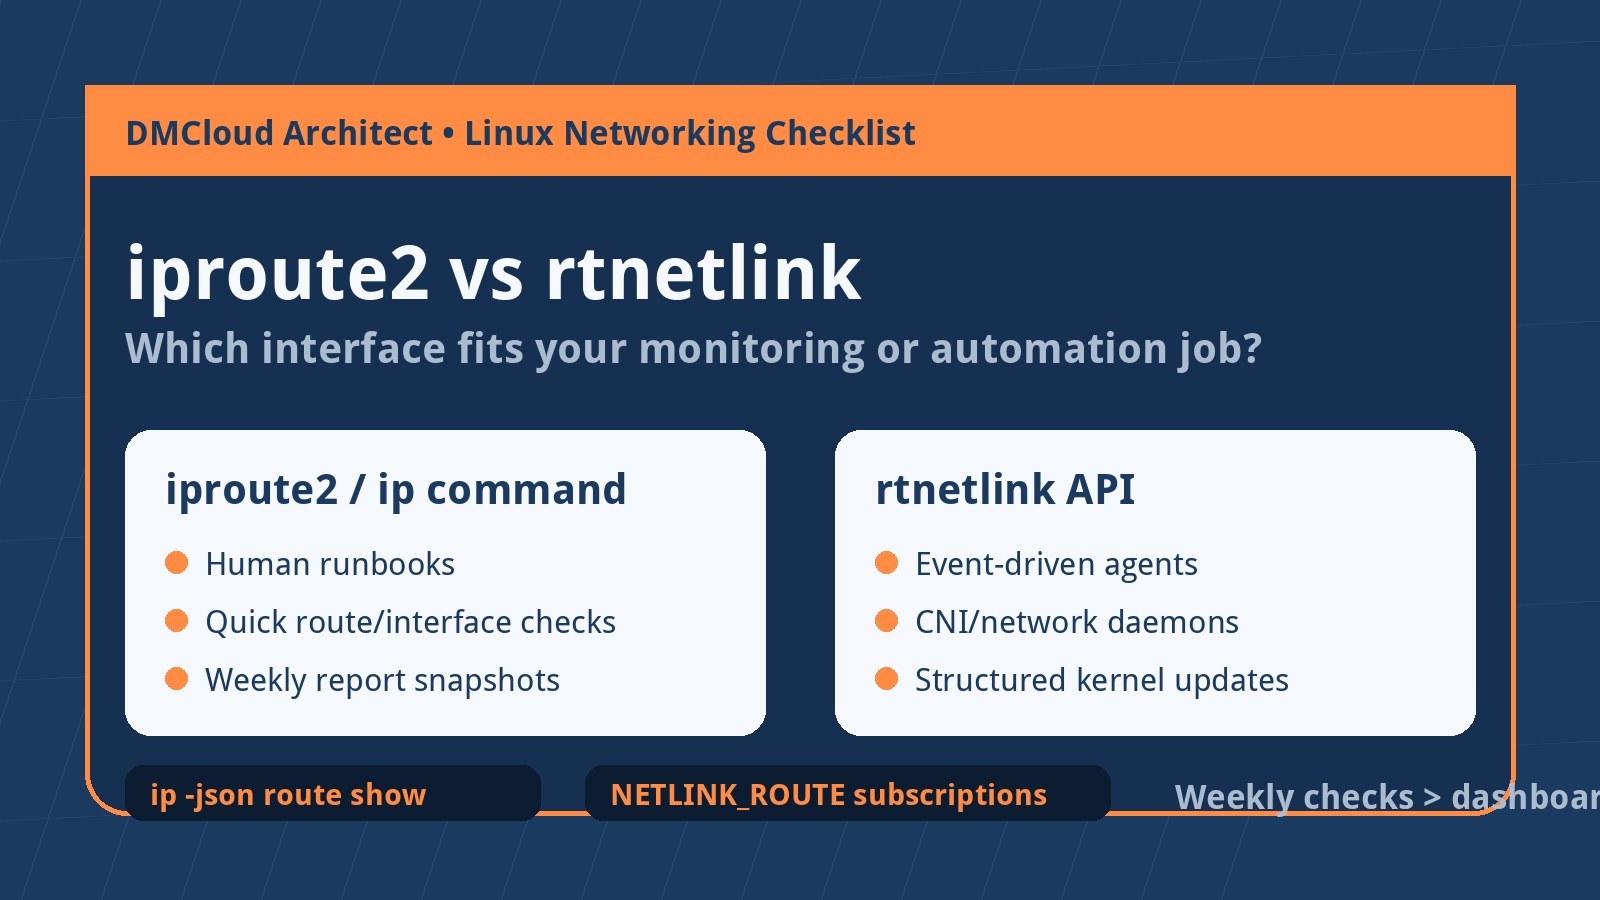
The ip command is built for operational clarity. It formats kernel network state into output that admins can read quickly, copy into tickets, and include in handoff notes.
- Interface inspection:
ip link showexplains device state, MTU, MAC address, and flags in a familiar form. - Address checks:
ip addr showquickly answers which IPs are bound to which interfaces. - Route review:
ip routemakes default gateways, policy routes, and subnet paths visible during troubleshooting. - One-time changes: adding a temporary route or address is usually clearer as a command than as custom socket code.
If the task belongs in a runbook, incident note, or weekly server report, iproute2 is usually the better interface. The output is understandable by more people, and mistakes are easier to reproduce.
2. Use rtnetlink when software needs structured kernel events
rtnetlink is not a replacement command-line tool. It is a socket API that lets user-space programs exchange structured messages with the Linux kernel's networking subsystem.
- Event-driven agents: subscribe to link, address, route, and neighbor changes instead of polling every few seconds.
- Container networking: CNI plugins and network daemons often need to create interfaces, move them between namespaces, and react quickly to state changes.
- Custom monitoring: agents can collect normalized interface and route data without parsing command output that may change across versions.
- High-volume automation: repeated network operations avoid process-spawn overhead and get clearer success or error codes.
The tradeoff is complexity. Raw netlink messages, nested attributes, and binary structs are not friendly compared with ip route. Most teams should use a library rather than hand-parsing messages unless the learning goal is the kernel interface itself.
3. Do not bypass iproute2 just for imagined performance gains
Performance can matter, but it is not usually the first reason to choose rtnetlink. For occasional checks, shelling out to ip is fast enough and much simpler to reason about.
- One server health check per hour: iproute2 is fine.
- A weekly infrastructure report: iproute2 plus other host checks is usually enough.
- A daemon watching hundreds of interfaces: rtnetlink subscriptions make more sense.
- A CNI or SDN component: rtnetlink is often the correct foundation because the program owns network state transitions.
Reach for rtnetlink when process spawning, text parsing, polling latency, or race conditions are real problems. Do not reach for it simply because it feels more professional than a command-line tool.
4. Prefer libraries over raw netlink parsing
Working directly with struct rtattr, ifinfomsg, sequence numbers, multipart replies, acknowledgements, and nested attributes can be educational, but it is easy to get wrong. Production code should normally use a maintained library.
- C:
libnlcan reduce boilerplate and improve readability when working with netlink families. - Go:
vishvananda/netlinkis commonly used for Linux networking automation and container tooling. - Rust: netlink crates can help when building safer systems tooling, though maturity varies by use case.
- Python: libraries such as
pyroute2are useful for automation and prototyping.
A good library lets your team reason about links, routes, addresses, neighbors, and namespaces as objects instead of byte offsets. That matters when the code has to be maintained during an outage.
5. Choose the interface by operational risk
A practical checklist helps keep the decision grounded:
- Use iproute2 when the result must be easy to paste into documentation or a support ticket.
- Use iproute2 when you are validating state rather than owning state.
- Use rtnetlink when your program must react to network changes as they happen.
- Use rtnetlink when parsing text output creates brittle automation.
- Use rtnetlink when a long-running daemon needs consistent structured errors and acknowledgements.
- Avoid both shortcuts when the real problem is missing documentation, unclear ownership, or no health-reporting process.
This is especially important for small teams. The best technical interface is not always the lowest-level interface; it is the one the team can operate safely after the original developer has moved on.
6. Monitoring agents need a different standard than weekly reports
A network monitoring agent that runs continuously has different needs from a weekly infrastructure health report. The agent may need immediate route-change events, interface counters, namespace awareness, and compact structured telemetry. That is where rtnetlink can be worth the complexity.
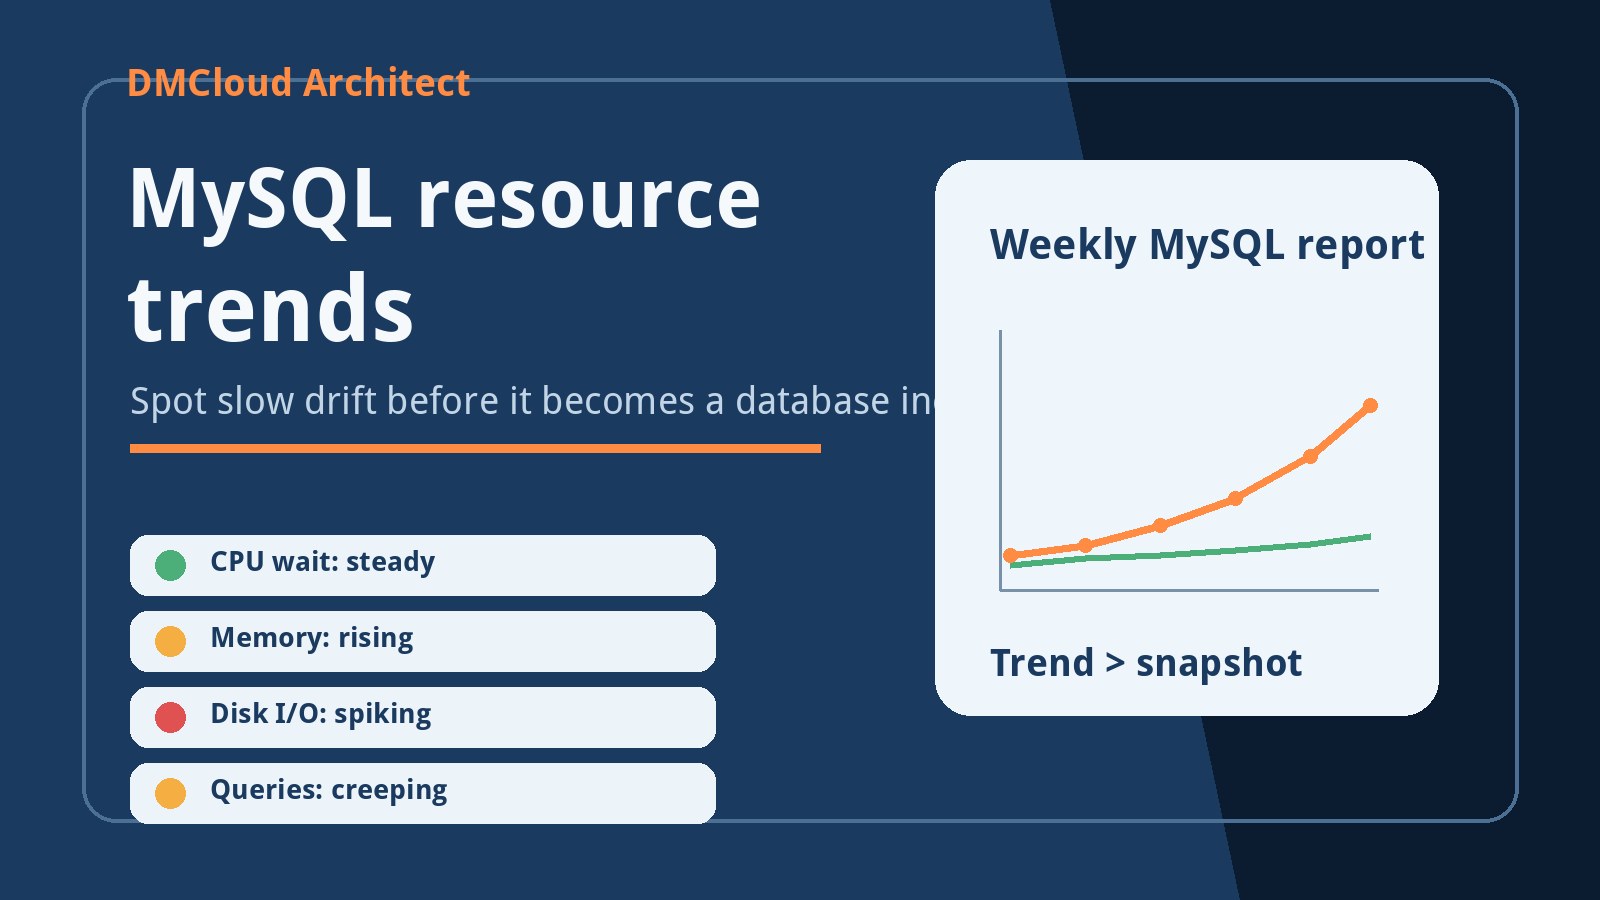
A weekly report, on the other hand, often needs a simpler question answered reliably: did the server's network, disk, CPU, memory, database, and services drift into risky territory this week? For that job, iproute2 snapshots can sit alongside uptime, disk growth, MySQL status, certificate checks, and service health evidence.
- Continuous agent: use rtnetlink when you need live subscriptions and normalized network objects.
- Operational report: use iproute2 outputs when you need understandable snapshots and trend evidence.
- Incident response: use both if needed: iproute2 for quick human inspection, rtnetlink-backed tooling for deeper automation.
7. A sensible migration path
If you are unsure, start with the simplest interface that proves the operational value.
- Step 1: document the exact network state you need: interfaces, addresses, routes, neighbors, namespaces, or events.
- Step 2: prototype with
ip -jsonwhere available so your scripts avoid fragile plain-text parsing. - Step 3: measure whether process spawning, polling, or output parsing is actually causing trouble.
- Step 4: move the hot path into a rtnetlink library only when the benefit is clear.
- Step 5: keep human-readable diagnostics in the tool, because future operators still need to understand what happened.
That path keeps infrastructure automation maintainable. You get the clarity of iproute2 when it is enough, and the power of rtnetlink when you are truly building network-aware software.
Want weekly Linux health checks without another dashboard to watch?
DMCloud Architect sends weekly Linux and MySQL infrastructure health reports directly to your inbox, highlighting network checks, disk growth, load trends, database pressure, service restarts, and practical next steps.
Get the free starter plan for weekly infrastructure health reports.