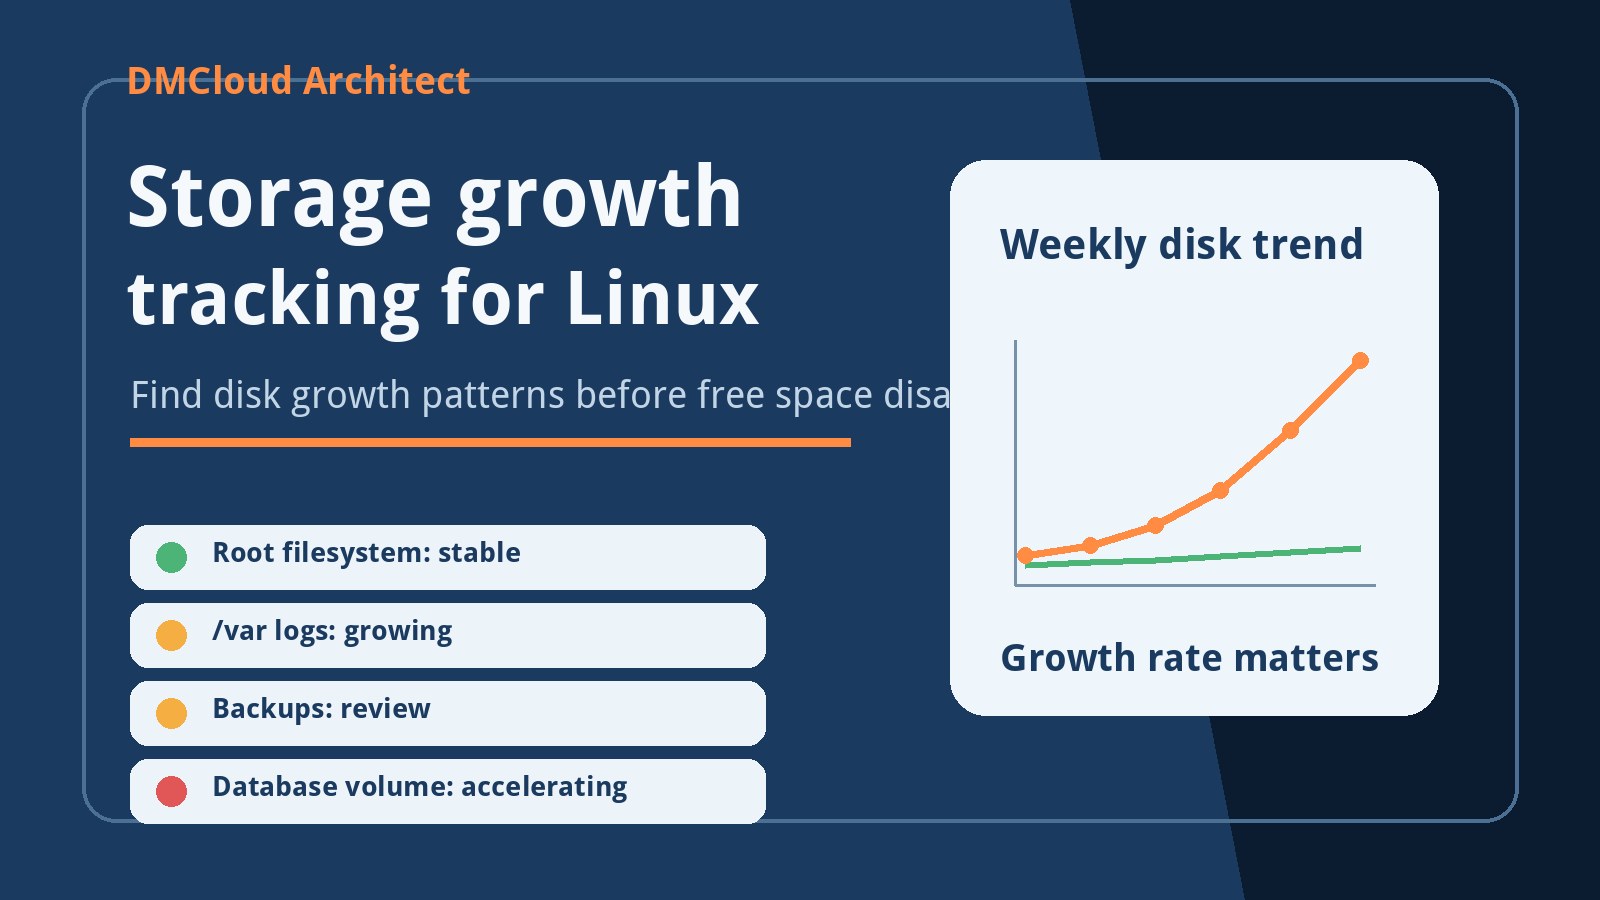
Disk problems on Linux servers rarely feel gradual when they finally reach users. A deploy fails, MySQL stops writing, logs explode, backups cannot complete, or uploads suddenly break. In many cases, the warning signs were visible for weeks. Storage growth tracking Linux routines help you catch those patterns before free space becomes an emergency.
For developers and small business owners, storage risk is easy to underestimate because a server can look healthy until one filesystem crosses the line. A weekly trend check shows more than the current percent used. It shows whether usage is stable, accelerating, or being pushed by logs, backups, databases, cache directories, or customer files.
Why storage growth matters more than one disk snapshot
A one-time df -h check tells you how much disk space is available right now. That is useful, but it does not answer the bigger operational question: when will this server run out of safe headroom if nothing changes? Disk usage trends on a Linux server turn a static number into a planning signal.
For example, 70% usage may be fine on a server that grows by 1% per month. The same 70% is risky if a database volume is growing by 5% each week. Tracking the slope helps you decide whether to clean up files, adjust retention, add storage, move backups, archive data, or investigate unexpected application behavior.
Start with filesystem-level trends
The first layer is simple: record each mounted filesystem, total size, used space, available space, and percent used. Include root, application volumes, database volumes, upload directories, backup mounts, and any separate log or cache partitions. Do not only monitor the largest disk. The small filesystem is often the one that causes the outage.
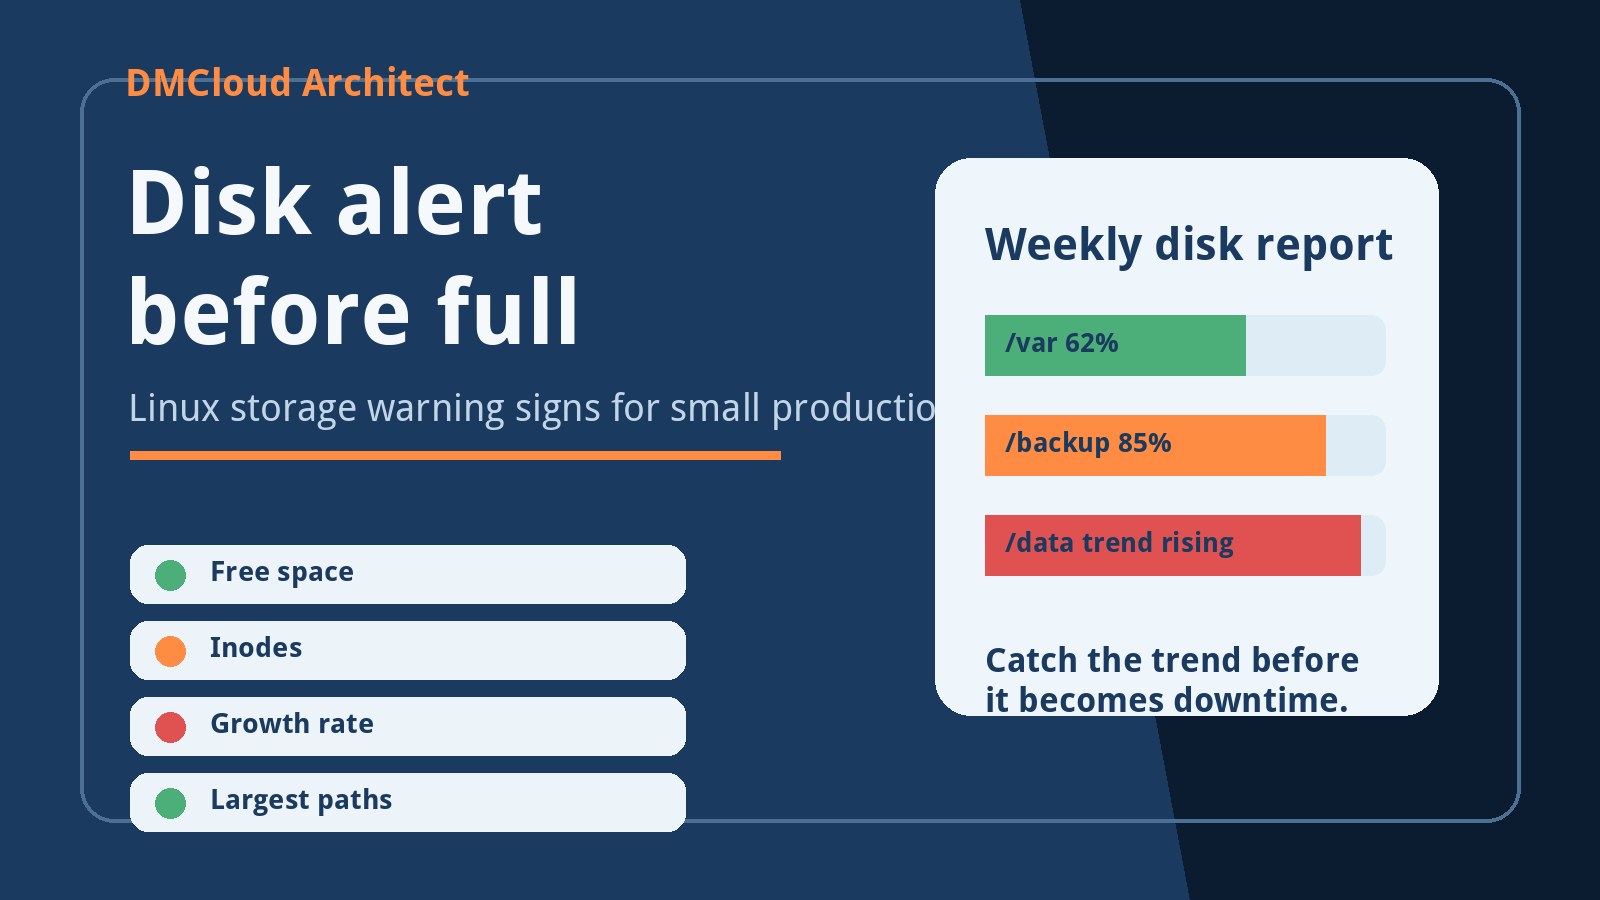
Compare the numbers with the previous week and the previous month. A useful weekly report should highlight both current risk and growth rate. If /var jumped from 45% to 72% while the application volume stayed flat, you know to inspect logs, package caches, mail queues, containers, or temporary files before blaming normal customer growth.
Measure growth rate, not just warning thresholds
Traditional disk alerts often fire at 80%, 90%, or 95%. Those thresholds are helpful, but they can arrive too late for small teams that need time to investigate and schedule work. Monitor disk growth on Linux by calculating change per day or per week. The trend tells you how much response time you really have.
If a filesystem has 80 GB free but is growing by 2 GB per week, you have plenty of room. If it has 80 GB free and is growing by 15 GB per day, you may have only a few business days before the server is in trouble. Growth rate makes storage monitoring practical because it turns “disk is high” into “we need action by this date.”
Separate normal growth from suspicious growth
Not every upward line is bad. Customer uploads, order history, audit records, analytics tables, and backups all grow naturally. The key is to know which directories are supposed to grow and which ones should be mostly steady. A disk growth trend on Linux becomes useful when it points to the source of change.
- Expected growth: customer files, database tables, media uploads, and retained backups.
- Review growth: logs, temporary files, cache directories, container images, package caches, and old release folders.
- Urgent growth: runaway error logs, failed backup loops, core dumps, queue backlogs, or database binary logs with missing retention.
Check logs before they become the incident
Logs are one of the most common sources of surprise disk usage. A new error loop can write thousands of lines per minute. A debug flag left on after troubleshooting can create large files. Web access logs can spike after bot traffic. Application logs can grow fast when a third-party API fails repeatedly.
Storage growth tracking should include log directory size, largest log files, recent log rotation status, and whether compressed archives are accumulating as expected. If logs are driving the trend, the answer is not always “delete files.” The better answer may be fixing the noisy error, tightening rotation, changing retention, or moving verbose diagnostics out of production.
Watch database files and binary logs
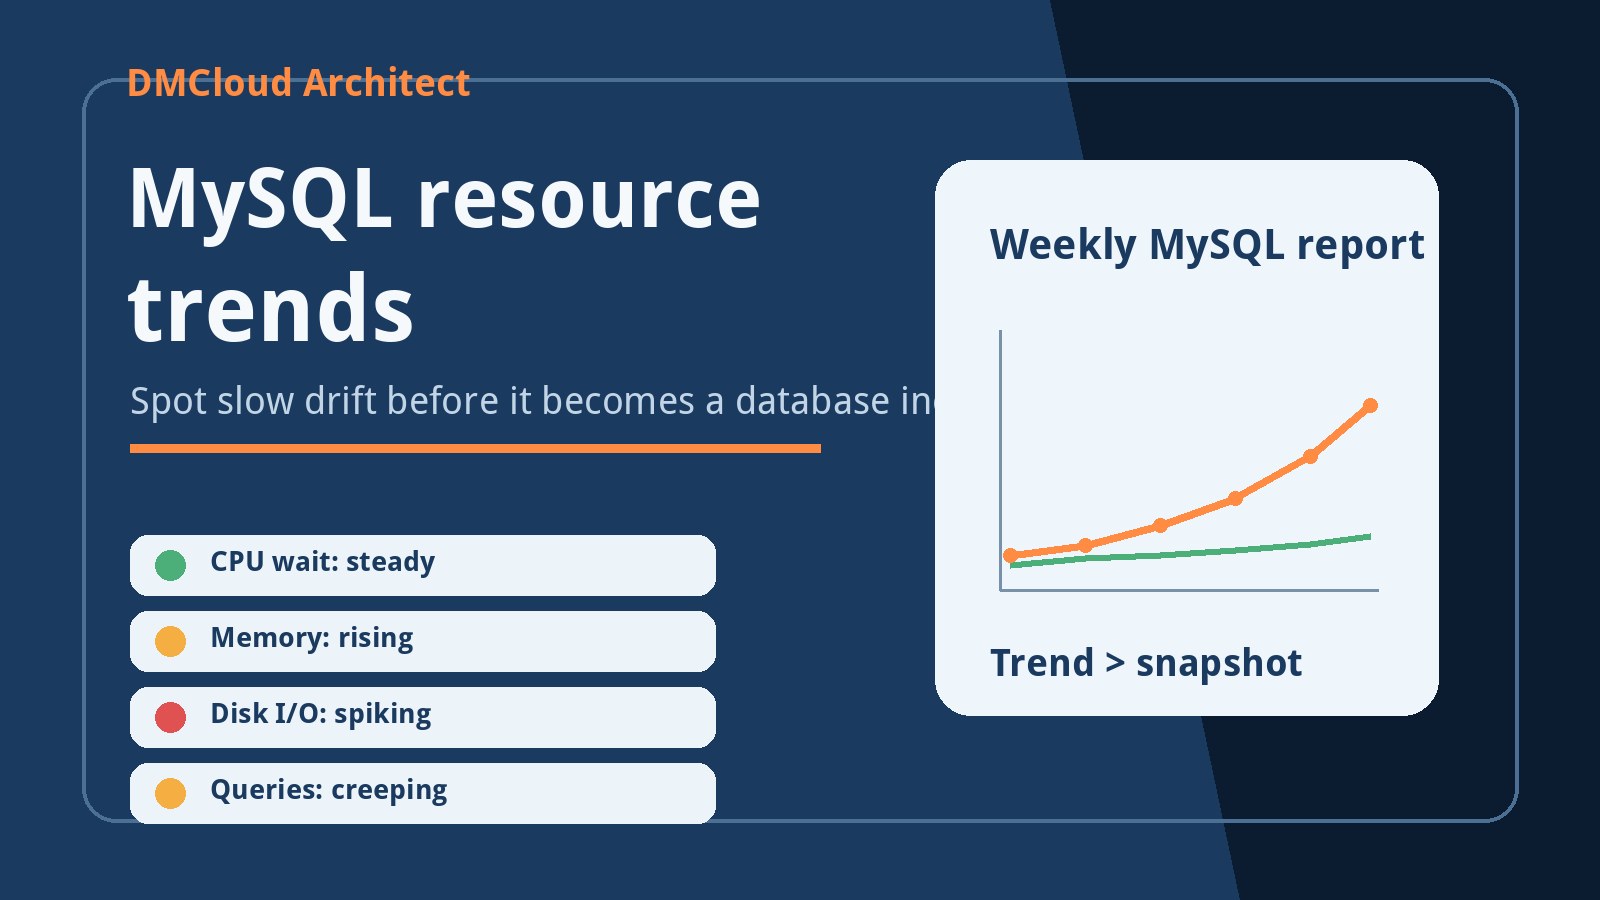
Database storage growth deserves its own line in a weekly Linux server report. MySQL data files, indexes, temporary tables, binary logs, and backups can each grow for different reasons. A database volume may look safe today while its growth rate signals that maintenance or capacity planning is overdue.
Track the largest databases, fastest-growing tables, binary log retention, backup size, and backup duration. If binary logs are expanding faster than expected, confirm retention settings and replication requirements before deleting anything. If one table is responsible for most growth, review application retention rules, archiving options, and whether old rows are still useful to the business.
Include backups in the storage picture
Backups protect the business, but backup files can create storage pressure when retention is unclear. A server may have enough space for the application and still fail because local backups fill a partition. Disk space usage over time should show backup size, backup count, backup age, and whether old backup files are being removed or moved off the server.
This is also a recovery signal. If backups are getting larger and slower every week, restore time may be increasing too. A weekly storage report should flag that before a real recovery is needed. Disk monitoring is not just about avoiding full partitions; it is also about keeping recovery plans realistic.
A practical weekly Linux storage checklist
Use this checklist as a starting point for a lightweight storage review:
- Record each filesystem with total, used, available, and percent used.
- Compare weekly and monthly growth rate for important volumes.
- List the top growing directories under application, log, database, upload, and backup paths.
- Check log rotation and identify unusually large or fast-growing logs.
- Review database data, indexes, temporary files, and binary log retention.
- Confirm backup size, freshness, retention, and location.
- Estimate days or weeks until the next warning threshold at the current growth rate.
- Write one clear next action for every storage warning.
Turn disk data into decisions
A good report should not leave you with a wall of numbers. Convert storage signals into simple statuses: healthy, watch, action needed, or critical. Add a short reason and a practical next step. “/var grew 18 GB this week because app errors increased” is much more useful than “/var is 81% used.”
Small teams benefit from this because the same person may be writing code, handling support, managing hosting, and checking backups. A weekly summary reduces dashboard fatigue. It gives the team a short list of storage risks to review before they turn into a failed deploy, broken upload, or database write error.
Make Linux disk growth visible before it hurts
The best time to fix disk growth is before the alert becomes urgent. Storage growth tracking on Linux gives you the context to choose the right fix: cleanup, retention changes, query or log fixes, storage expansion, backup changes, or migration planning. It also makes recurring risk visible enough to discuss before it becomes customer-facing downtime.
DMCloud Architect provides weekly Linux and MySQL infrastructure health reports for teams that want early warnings without another dashboard to stare at. If you want a simple way to track storage growth, server health, backups, and next actions, start with the Infrastructure Health Reporting page.