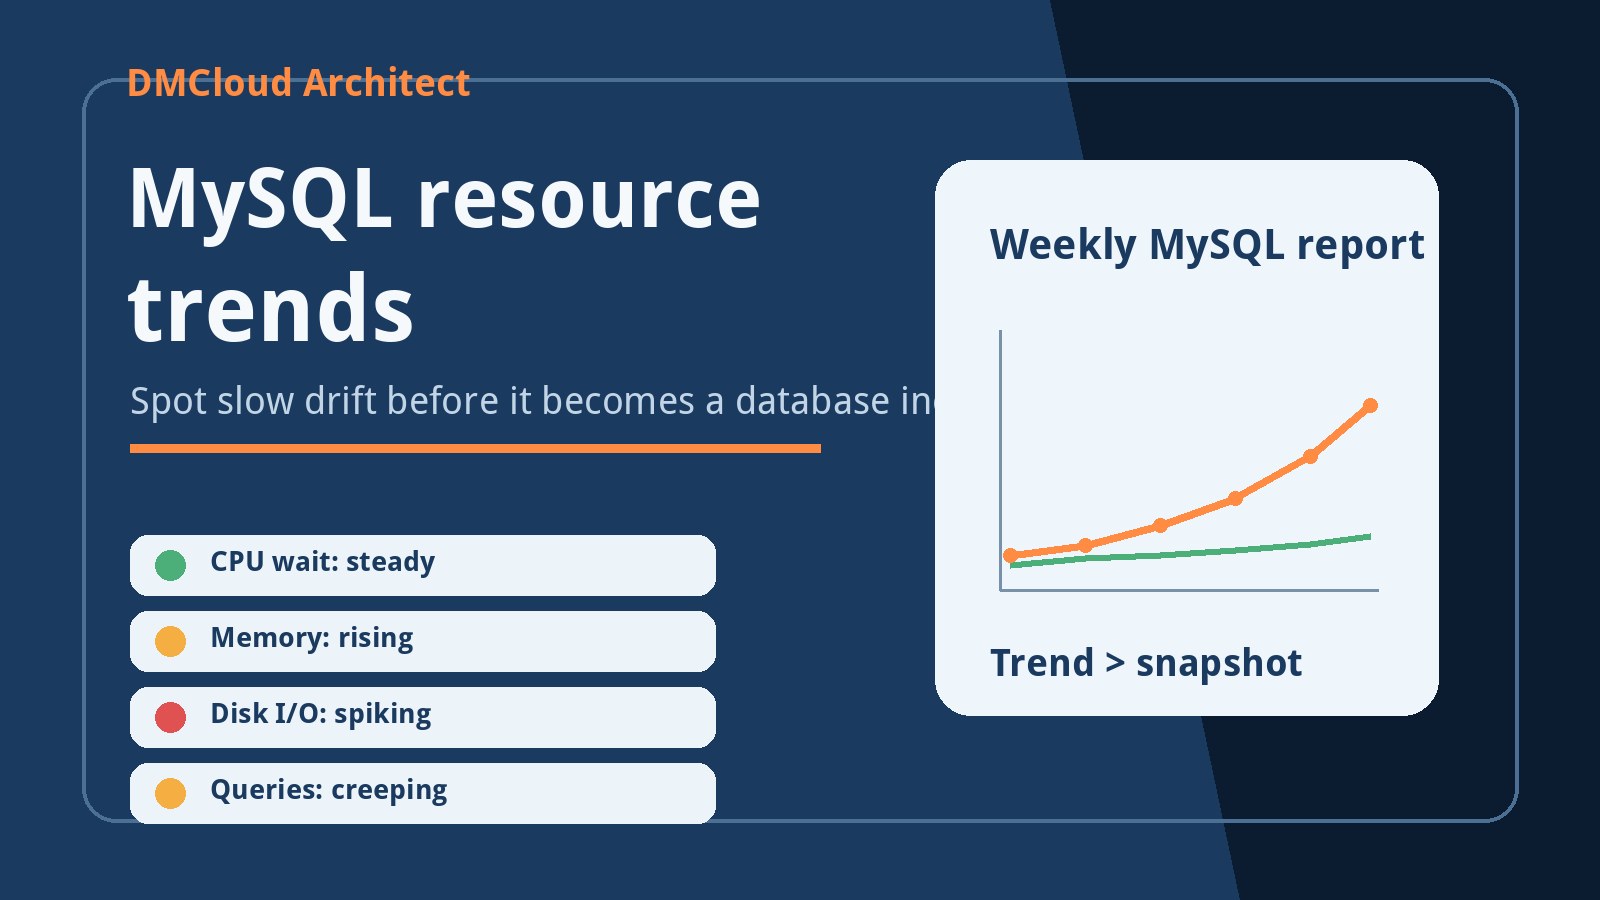
MySQL performance problems often look sudden from the outside. A page starts loading slowly, checkouts take longer, reports timeout, or an admin screen feels stuck. Inside the server, those problems usually build gradually. MySQL resource trends help you see that drift while there is still time to tune, clean up, or plan capacity.
This matters for developers and small business owners because a single MySQL server can quietly become the bottleneck for the whole application. One snapshot might show that the database is healthy right now. A trend shows whether CPU wait, memory pressure, disk I/O, connection count, slow queries, and data growth are moving in the wrong direction week after week.
Why trends beat one-time MySQL checks
A one-time check answers a narrow question: what is happening at this moment? That is useful during an incident, but it can miss the slow changes that create the incident. If a server usually runs at 10% CPU and now sits at 45% every morning, the database may still be online, but the pattern deserves attention.
MySQL performance trends turn monitoring into comparison. Instead of asking whether a number is technically below a limit, you ask whether it is normal for this server, this workload, and this time of week. That context is what helps small teams spot MySQL performance degradation before it becomes visible to users.
Start with CPU and load patterns
CPU is a useful trend, but it should not be read alone. A rising CPU graph can mean more traffic, inefficient queries, missing indexes, background jobs, reporting workload, or a noisy neighbor on a shared host. The first goal is not to guess the cause. The first goal is to notice when the normal baseline has changed.
Track average CPU usage, load average, and CPU wait over the same period each week. If CPU usage is rising while traffic is stable, check query patterns and recent application changes. If CPU wait is high, the database may be spending time waiting on disk or another resource rather than simply needing more processor capacity.
Watch memory before swapping starts
Memory issues can turn a manageable database into a slow one quickly. MySQL uses memory for buffers, connections, temporary tables, sorting, and query execution. The server also needs enough memory for the operating system and other services. When memory pressure grows slowly, the first signs may be subtle: more disk activity, longer query times, or irregular latency.
A weekly MySQL trend monitoring routine should record total memory, available memory, swap usage, and whether swap activity changed since the previous report. Swap being configured is not the problem. Regular swap activity on a busy database server is the warning sign. Once MySQL is forced to lean on disk for memory pressure, performance can become inconsistent.
Measure disk I/O, not just disk space
Disk space tells you whether there is room for data, logs, and backups. Disk I/O tells you whether the storage layer is keeping up with the workload. Both belong in a MySQL resource trends report. A server can have plenty of free space and still perform poorly if reads and writes are queueing behind slow storage.
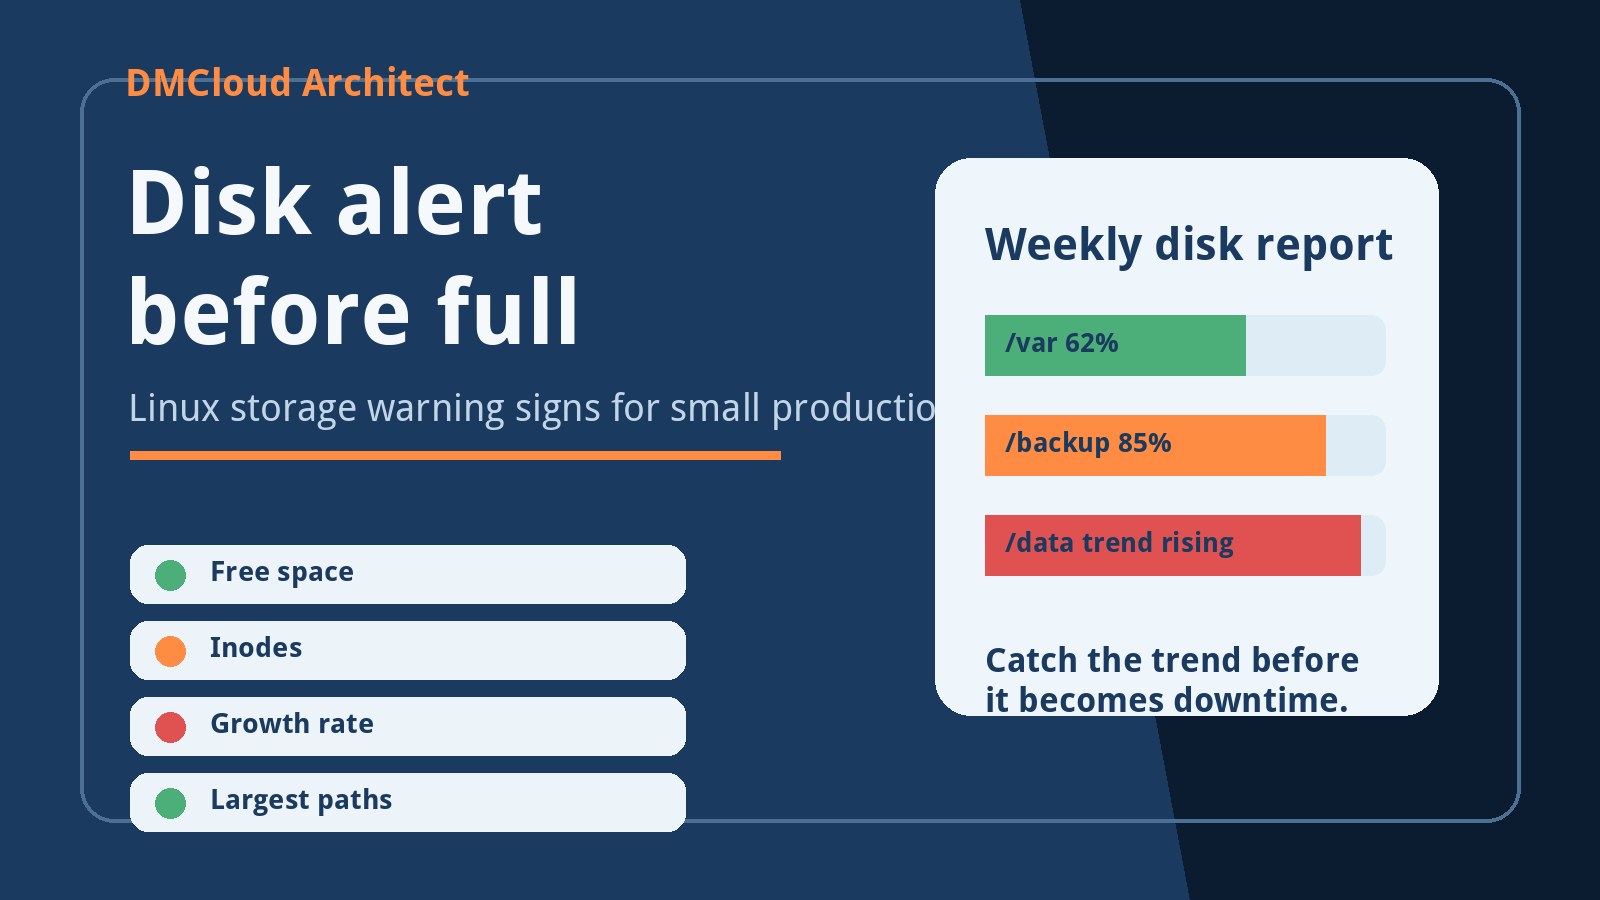
Track disk utilization, read and write throughput, I/O wait, and database volume growth. Sudden spikes matter, but slow drift matters too. If the database files grow steadily and I/O wait rises over several weeks, the server may need query tuning, index cleanup, storage review, or a planned migration before a busy period arrives.
Compare connection counts with real workload
Connection trends are a practical early-warning signal. A rising connection count can mean healthy growth, but it can also point to connection leaks, inefficient pooling, stuck workers, bots, or pages that open more database sessions than expected. The key is to compare connections with actual traffic and application changes.
Record current connections, peak connections, aborted connections, and any repeated connection errors. If connections climb but sales, bookings, or user activity do not, investigate before simply raising limits. Increasing a limit can buy time, but it can also hide the pattern until memory or CPU becomes the next bottleneck.
Use slow queries as a trend, not a blame list
The slow query log is most useful when it shows direction. One slow query may be an edge case. A growing count of slow queries each week is a workload trend. The query may need an index, a limit, a cached summary, or a code change. The report should help you prioritize, not just list the longest query from last night.
For a small weekly database health check, group slow-query findings by frequency and business impact. A query that runs slowly once per month may not matter. A query that runs 2,000 times a day and gets slower every week can explain customer-facing delays even if each individual execution is only slightly over the threshold.
Include table, index, and binary log growth
MySQL workload trends often show up as growth. Tables grow, indexes grow, binary logs accumulate, temporary files increase, and backups take longer. These are not automatically bad. Growth becomes a risk when nobody can explain it, retention rules are missing, or the server is approaching a storage or maintenance window limit.
Track the largest tables, fastest-growing tables, binary log retention, backup size, and backup duration. This helps you find problems such as old audit rows never being archived, sessions stored in the database forever, unexpected file uploads tracked in database metadata, or reporting tables that need a cleanup policy.
Turn database signals into status levels
A useful MySQL report should not leave the reader with a pile of numbers. Convert the numbers into clear status levels: healthy, watch, action needed, or critical. The status should be based on trend, business impact, and next action rather than a generic threshold copied from another environment.
- Healthy: resource usage is stable and matches normal workload.
- Watch: one or two signals are drifting but there is no immediate customer impact.
- Action needed: trends suggest a likely bottleneck, cleanup, or tuning task.
- Critical: database stability, backups, or customer-facing performance may be at risk.
A weekly MySQL resource trend checklist
Use this checklist as a starting point for a practical weekly database review:
- Compare CPU usage, load average, and CPU wait with the previous report.
- Check available memory and any swap activity.
- Review disk usage, database volume growth, and I/O wait.
- Record current and peak MySQL connections.
- Summarize slow-query count, frequency, and repeated patterns.
- List largest and fastest-growing tables.
- Confirm backup freshness, backup size, and binary log retention.
- Write one next action for every warning.
When a trend deserves immediate attention
Not every upward line is an emergency. Some trends reflect normal growth. Pay closer attention when several signals move together: CPU rises while slow queries rise, memory drops while swap activity appears, connections climb while traffic stays flat, or disk I/O wait increases while table growth accelerates. Combined signals are often more meaningful than one metric by itself.
Also treat any backup-related trend seriously. If backups are taking longer, failing more often, or consuming unexpected storage, the database risk is no longer just performance. It is recovery risk. A database health report should make that visible before the team needs the backup.
Make MySQL monitoring easier to act on
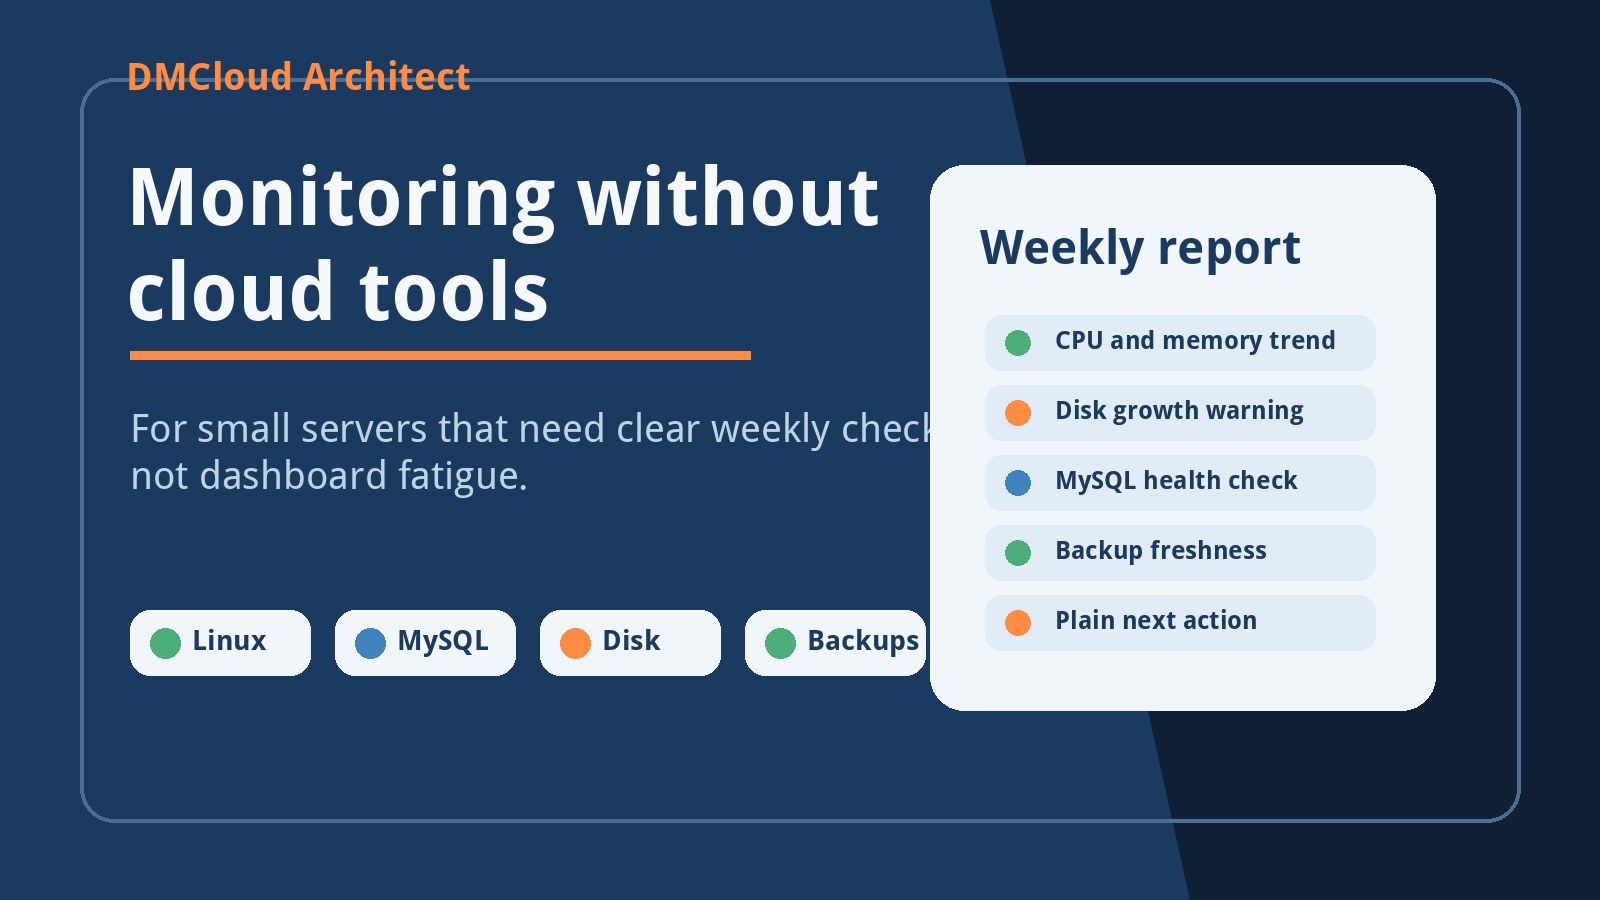
The goal of MySQL resource trends is not to build another dashboard that someone must stare at all day. The goal is a repeatable check that says what changed, why it matters, and what action should happen next. That is especially valuable for small teams where the same person may handle code, hosting, backups, and customer support.
DMCloud Architect provides weekly Linux and MySQL infrastructure health reports for teams that want early warnings without dashboard fatigue. If you want a simple way to review database drift, server health, backups, and next actions, start with the Infrastructure Health Reporting page.