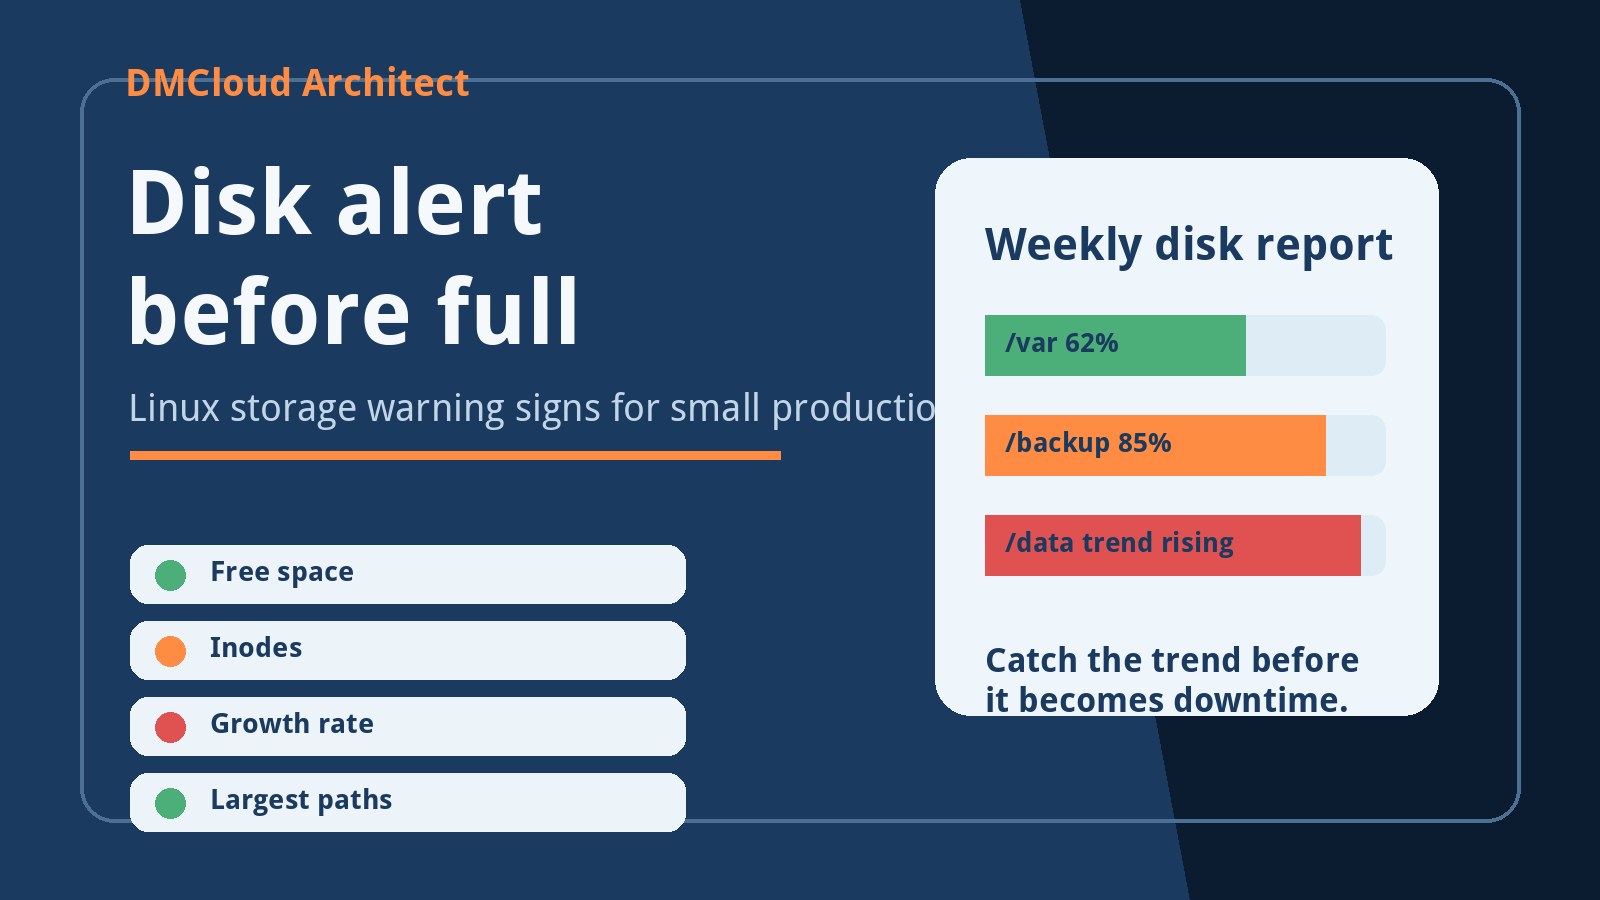
A Linux server usually gives you plenty of warning before a disk becomes full. The problem is that many small teams only notice storage when uploads fail, MySQL stops writing, log rotation breaks, or a customer reports an error. A useful disk alert before full Linux routine turns those early warning signs into a scheduled check instead of an emergency.
This matters for developers and small business owners because disk pressure can break more than one service at once. A full root partition can stop package updates and logging. A full database volume can interrupt orders, bookings, or client portals. A full backup directory can make the next recovery harder. The good news is that disk monitoring does not need to be complicated to be effective.
Why a simple percent-full alert is not enough
The classic disk warning is a threshold such as 80% or 90% used. That is useful, but it is not the whole picture. A quiet server at 88% might be stable for months, while a busy server at 72% might run out of space by Friday because logs, backups, uploads, or database files are growing quickly.
A better disk full warning for Linux combines the current number with the trend. You want to know the filesystem usage, inode usage, the fastest-growing directories, and how much space changed since the last report. That makes the alert actionable instead of noisy.
Start with the filesystems that matter
Begin by listing the mounted filesystems that can affect the application. On a small server this often includes the root filesystem, a data volume, a database volume, an uploads directory, and a backup location. Do not treat temporary system mounts as business-critical just because they appear in command output.
A practical weekly report should capture the mount point, total size, used size, available space, percent used, and filesystem type. The important part is consistency. If you record the same fields every week, you can detect disk full before failure because the trend becomes visible.
- Root filesystem usage for operating system stability.
- Application upload and media directories.
- Database storage, especially MySQL data directories.
- Log directories for web, application, and system logs.
- Backup directories and retention folders.
Check inode usage, not just gigabytes
A filesystem can fail even when it still has disk space if it runs out of inodes. This is common on servers with many small cache files, sessions, thumbnails, mail queue files, or temporary job artifacts. The symptom looks confusing because the server may say there is space available while writes still fail.
Your disk alert before full Linux checklist should include inode usage for every important filesystem. If inode usage is high, the next action is usually different from adding more storage. You may need to clean cache directories, rotate session files, fix a job that creates too many small files, or move a workload to a filesystem better suited to that file count.
Measure growth rate so the alert arrives early
Storage risk is easier to manage when you know the rate of change. A report that says a volume is 78% full is helpful. A report that says it grew from 62% to 78% in seven days is much more useful. The second version gives you a timeline and a reason to act before the next busy period.
For small infrastructure monitoring, weekly growth is often enough. Record used gigabytes this week, compare it with last week, and calculate the approximate time to reach a threshold if the current trend continues. This is how you prevent a disk full outage on a server without needing a large observability platform.
Find the directories causing the change
When disk usage rises, the next question is simple: what grew? A useful report should show the largest directories and, when possible, the directories that changed most since the previous check. That keeps the alert from turning into a guessing game.
- Logs may grow after a new error, bot traffic, or debug mode left enabled.
- Backups may pile up when retention rules are missing or broken.
- Uploads may grow after a marketing campaign, form change, or import job.
- Database files may expand because of table growth, temporary files, or binary logs.
- Cache directories may grow when cleanup jobs fail.
The report does not need to include every file. It should identify enough of the pattern to make the next maintenance step clear.
Set warning levels that match the server
Generic thresholds are a starting point, not a policy. Many teams use warning at 75% or 80%, urgent at 90%, and critical at 95%. That is reasonable for some servers, but the right threshold depends on disk size, write rate, recovery time, and business impact.
A 20 GB server with 5 GB free may have very little room for backups, package updates, and log spikes. A 2 TB volume with 200 GB free may still have time if growth is slow. The best disk saturation detection on Linux combines percent used, absolute free space, and growth rate.
Do not forget backups and logs
Backups are supposed to reduce risk, but badly configured backups can create storage risk. If backups are stored on the same disk they protect, or if old archives are never removed, the backup process can fill the server it was meant to save. Log files can cause the same problem when rotation fails or an application starts repeating an error thousands of times.
Your weekly disk health check should confirm backup freshness and backup retention. It should also look for unusually large logs and repeated errors. If a single log file is growing quickly, the disk alert is also an application health signal.
Turn alerts into an action report
The difference between useful monitoring and noise is the action attached to the alert. A disk warning should not just say that storage is high. It should say what changed, why it matters, and what to do next.
A simple format works well:
- Status: healthy, watch, action needed, or critical.
- Evidence: current usage, inode usage, and weekly change.
- Likely cause: logs, backups, uploads, database growth, cache, or unknown.
- Impact: what could break if the trend continues.
- Next action: clean up, adjust retention, investigate errors, expand storage, or schedule maintenance.
This is especially helpful for small business systems where one person may handle development, hosting, and support. The report turns technical signals into decisions.
A practical weekly Linux disk checklist
Use this checklist as a starting point for a weekly disk report:
- Record percent used and free space for important filesystems.
- Record inode usage for the same filesystems.
- Compare used space with the previous report.
- List the largest directories under logs, backups, uploads, application storage, and database paths.
- Flag any filesystem with high usage, low absolute free space, or fast growth.
- Check whether backup retention and log rotation are working.
- Write one recommended action for every warning.
That routine is small enough to repeat and strong enough to detect storage issues early on most Linux servers. It also creates a record you can review when planning cleanups, migrations, or storage upgrades.
When a disk alert should become urgent
Some storage warnings can wait for normal maintenance. Others should be handled quickly. Treat the alert as urgent when free space is very low, usage is rising quickly, a database volume is affected, backups are failing, logs are growing from repeated errors, or the server has no clear rollback path.
The point is not to panic earlier. The point is to have enough evidence to act calmly before the disk fills. Catching a storage trend on Monday morning is very different from discovering a full disk during a customer checkout or a client login.
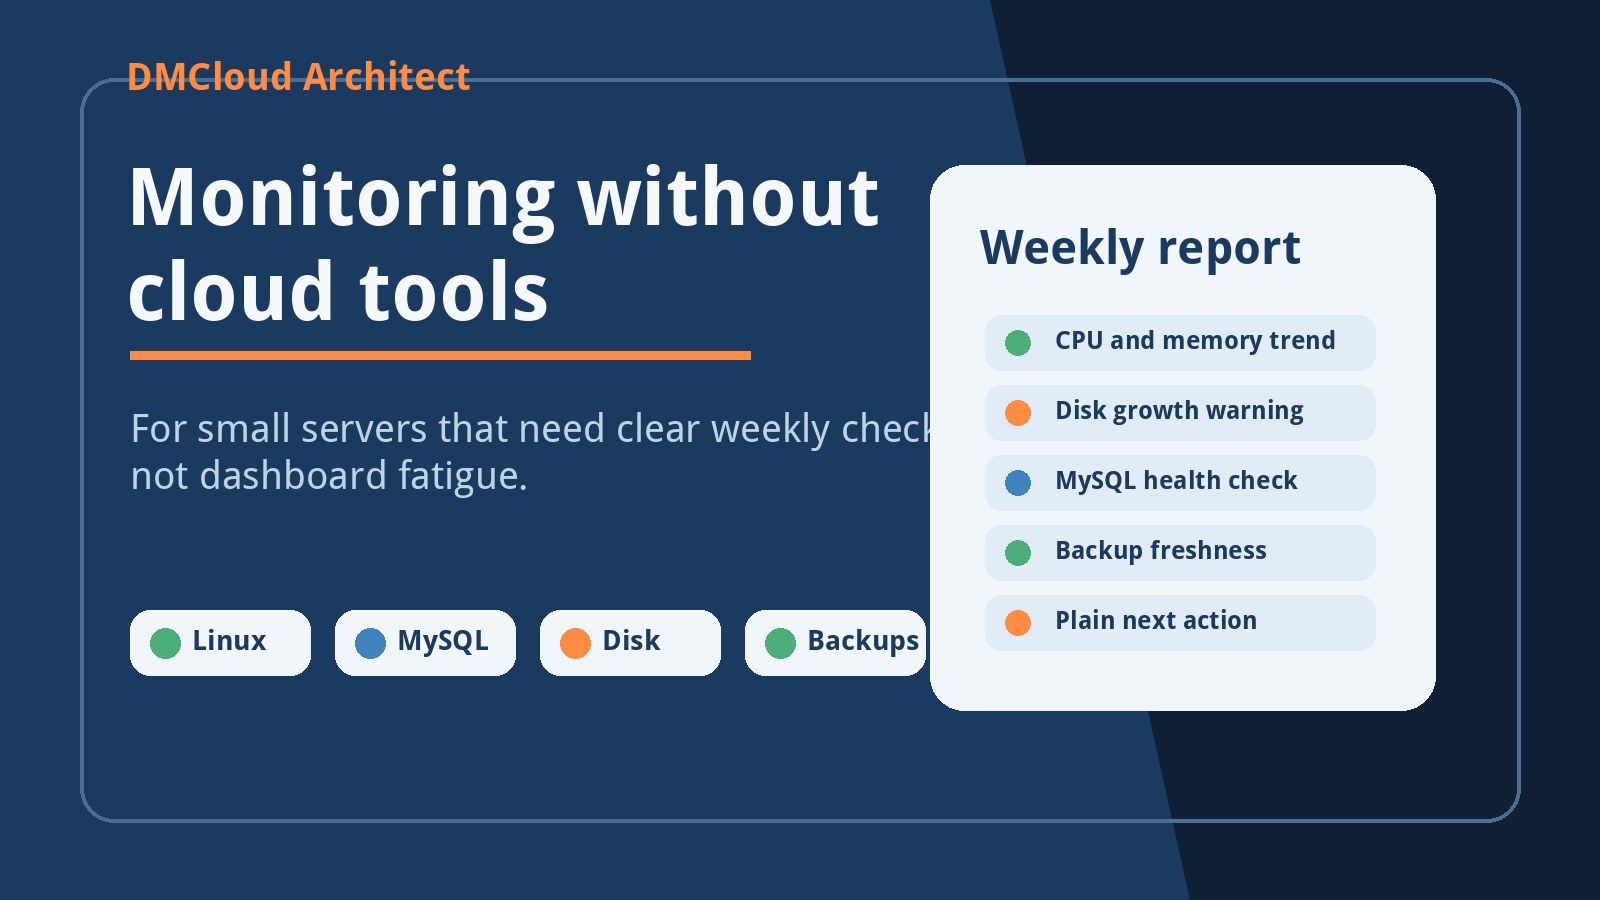
DMCloud Architect provides weekly Linux and MySQL infrastructure health reports for small teams that want early warnings without dashboard fatigue. If you want a practical review of disk, database, backups, and server health, start with the Infrastructure Health Reporting page.