Back to Blog
CPU Performance Trends on Linux: Spot Slow Drift Before Users Notice

CPU Performance Trends on Linux: Spot Slow Drift Before Users Notice

   Mariusz Antonik    Automation    5 min read    19 views

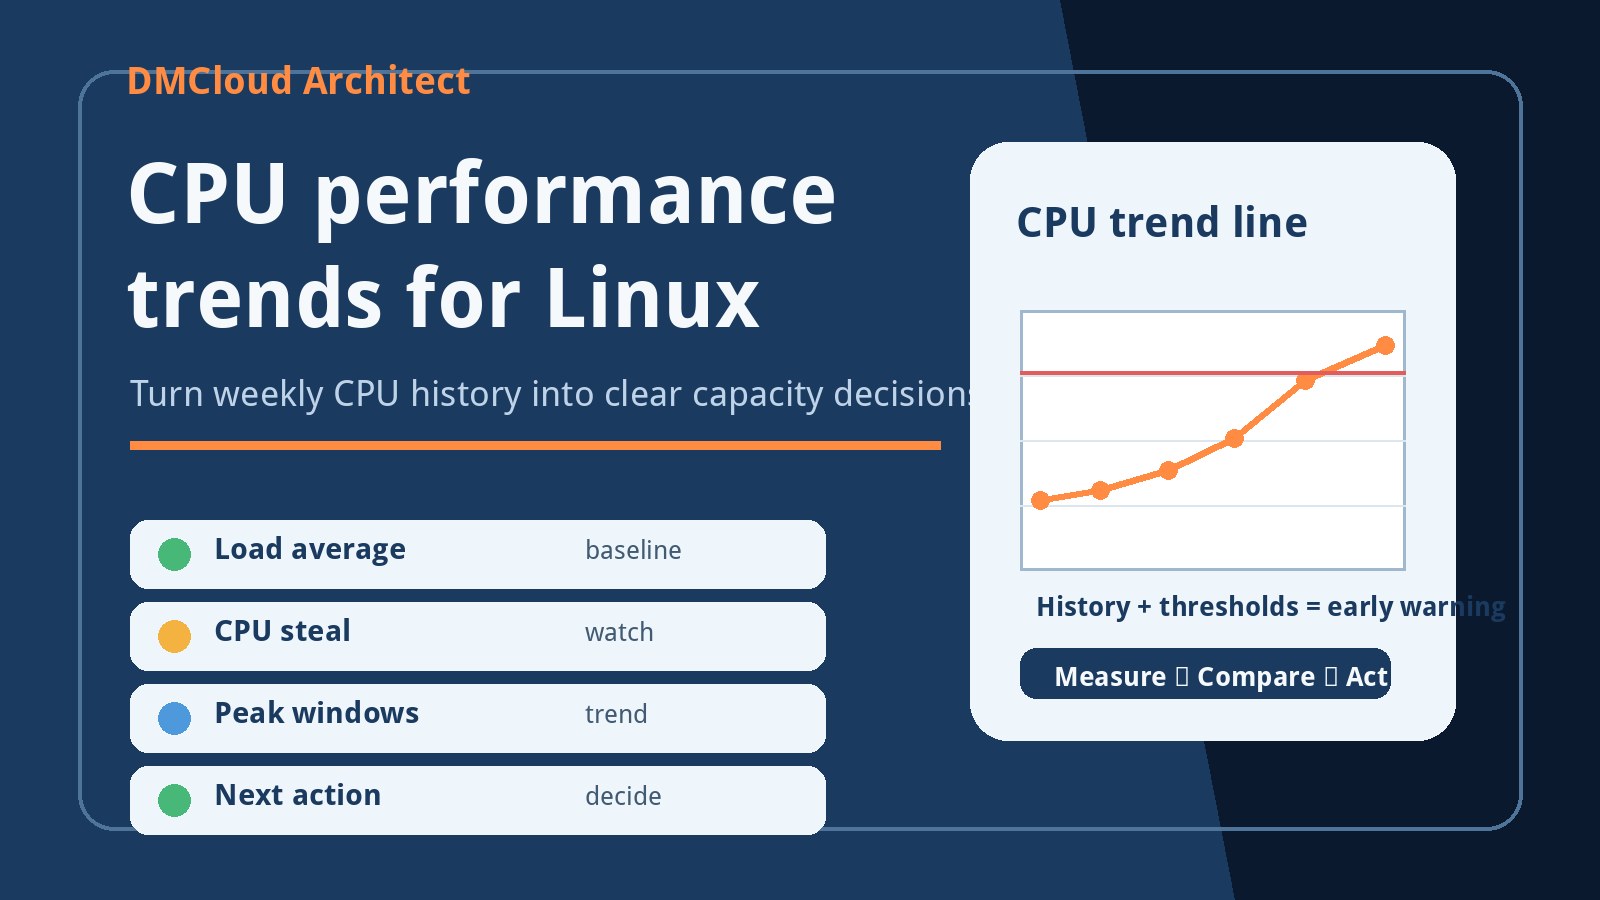
Linux servers often slow down gradually before they fail loudly. A web app may feel fine most days, then become sluggish during imports, backups, report generation, or busy customer hours. Tracking cpu performance trends linux signals helps small teams notice that drift early, when there is still time to tune workloads or plan capacity.

The goal is not to stare at live charts all day. The goal is to keep a simple weekly history of CPU behavior, compare it with previous weeks, and decide whether the pattern is stable, improving, or moving toward a problem.

Start with the CPU signals that explain real user impact

CPU usage alone is useful, but it can be misleading without context. A server at 80% CPU during a scheduled job may be healthy if the queue clears quickly. A server at 35% CPU can still feel slow if load average is high, processes are waiting, or virtual CPU steal time is rising.

A practical Linux CPU report should include load average, CPU utilization, idle percentage, I/O wait, steal time for cloud instances, process-level top consumers, and the time windows when peaks happen. These values help explain whether the server is busy, blocked, undersized, noisy-neighbor affected, or simply running a predictable workload.

Compare load average with CPU count

Load average becomes more useful when it is compared with the number of available CPU cores. On a two-core server, a sustained load of 2 may be expected during busy periods, while a sustained load of 6 means work is queueing. On an eight-core server, the same number tells a different story.

Record the one, five, and fifteen minute load averages each week, but focus on sustained movement rather than one short spike. If the fifteen minute average is climbing across several reports, the server may be spending more time under pressure even if nobody has complained yet.

Track CPU utilization over time, not as a one-off snapshot

One command output shows what is happening now. A trend shows what is changing. CPU usage trends on Linux are strongest when the same checks run at the same cadence and are summarized in a consistent format. That makes it easier to see whether normal workload, scheduled jobs, database queries, or background services are slowly consuming more headroom.

For a small server, a weekly report can be enough. Record average utilization, peak utilization, and the most expensive processes. If a process was responsible for 20% of CPU last month and is regularly responsible for 55% now, that is a useful clue for developers before the server becomes a customer-facing issue.

Watch CPU steal time on cloud servers

CPU steal time is especially important on virtual machines. It represents time when your instance wanted CPU but the host did not provide it. A small amount may be normal, but a rising trend can explain slow application behavior even when your own processes do not look unusually expensive.

If steal time increases at the same time as user-facing latency, the next action may not be code tuning. It may be moving instance shape, changing tenancy, resizing, or reviewing the cloud provider environment. Without the trend, teams often waste time blaming the application for a host-level pressure signal.

Map peak windows to real workloads

CPU trend monitoring is most helpful when peaks are tied to real activity. Backups, cron jobs, imports, report exports, log processing, and batch email tasks can all create predictable CPU pressure. If those peaks overlap with customer traffic, the server may feel slow even though each job is reasonable in isolation.

Keep a short note beside each peak: what was running, how long it lasted, and whether the server recovered quickly. This makes capacity planning practical. You may decide to move a cron job, throttle a background worker, optimize a query, or add CPU capacity before the next busy season.

Separate short spikes from capacity risk

Not every spike needs action. Short CPU bursts are normal when an application compiles assets, rotates logs, compresses backups, or handles a temporary traffic increase. The warning sign is not a single high number; it is a repeated pattern of longer peaks, rising baselines, or reduced idle headroom.

A useful report should label the status clearly. Stable means CPU is behaving like previous weeks. Watch means utilization or load is trending upward and should be reviewed. Action needed means the trend is likely to affect users, backups, database performance, or maintenance windows if nothing changes.

Use a simple weekly Linux CPU checklist

For developers and small business owners, the checklist can stay compact:

  • Record CPU core count, one/five/fifteen minute load averages, and average utilization.
  • Note peak CPU windows and the jobs or traffic patterns behind them.
  • Track top CPU-consuming processes and whether their share is rising.
  • Check I/O wait so storage delays are not mistaken for pure CPU pressure.
  • Check steal time on cloud instances and flag sustained increases.
  • Compare current values with the last four to eight weekly reports.
  • Write one clear next action when the status is watch or action needed.

Turn CPU history into decisions

The value of monitoring CPU usage over time on Linux is the decision it supports. If the trend is stable, you can leave the server alone. If one job is growing, you can tune or reschedule it. If the whole baseline is rising, you can plan capacity before customers notice slow pages or failed background tasks.

DMCloud Architect helps small teams review Linux, MySQL, backups, and server performance without dashboard fatigue. If you want weekly infrastructure health reporting that turns CPU history into clear next steps, visit the Infrastructure Health Reporting page.
About the Author
Mariusz Antonik

Oracle Cloud Infrastructure expert and consultant specializing in database management and automation.

All Tags
#Advanced #agent-visibility #agentless-monitoring #alerts #amazon-linux-2023 #argo-cd #atop #auditd #automation #backend-infrastructure #backup-setup #backup-verification #backups #bandwidth-monitoring #bare-metal-server #Bash #bash cpu monitoring script #bash monitoring #bash scripting #bash-automation #bash-scripts #Beginner #Best Practices #bind-dns #block volume backup #brute-force-protection #Capacity Planning #centos-7 #centos-ftp-migration #centralized-logging #chromebook-linux #cifs-mounts #cloud backup strategy #cloud-costs #cloud-database-setup #cloud-networking #cloudflare-workers #cluster-administration #compute #container-monitoring #control-panel-security #cpu bottleneck #CPU Monitoring #cpu monitoring linux #cpu monitoring script linux #cpu trends #cpu usage trends #cpu usage trends linux #cpu-monitoring-script #cpu-monitoring-without-tools #cpu-performance-decline-server #cpu-performance-degradation-linux #cpu-performance-trends-linux #cpu-reporting-linux-server #cpu-usage-history-linux #create oracle db system in oci #cron #cron cpu monitoring #cron cpu monitoring linux #cron jobs #cron-monitoring #custom-linux-distribution #cve-advisory #database #database monitoring #database performance #database-health #database-migration #database-setup #debian #deployment-checklist #detect slow queries mysql #devops #devops-checklist #devops-help #devops-learning #disk capacity planning server #disk forecasting linux #disk growth trend linux #Disk Monitoring #disk usage #disk usage script linux #disk usage trends #disk-capacity #disk-growth #disk-saturation-detection-linux #disk-scaling-planning-linux #disk-usage-history-linux #dns-migration #dnssec #Early Detection #easy infrastructure monitoring #egress-monitoring #elasticsearch #exposed-port-monitoring #fail2ban #field-server-checklist #firewall-rules #fleet-ops #free-tier #freelance-sysadmin #gitops-security #growth-trends #Guide #health dashboards #Health Reporting #historical server monitoring #historical-monitoring #home-lab #how to monitor cpu usage linux #hpc #https-certificates #incident-response #infiniband #infrastructure #infrastructure health #infrastructure health dashboard #infrastructure health reporting #infrastructure monitoring #infrastructure monitoring report #infrastructure trends #infrastructure trends monitoring #Infrastructure Visibility #infrastructure-automation #infrastructure-checklist #infrastructure-reporting #interview-prep #ip-allowlist #iproute2 #journald #kubernetes-security #latency-checks #lightweight linux monitoring #lightweight monitoring #lightweight-monitoring-solution #linux #linux administration #linux cpu monitoring #linux cpu usage #linux disk capacity planning #linux disk usage #Linux monitoring #linux monitoring setup #linux monitoring tools #linux performance #linux performance monitoring #linux server #linux server monitoring #linux servers #linux storage #linux tools #linux-admin #linux-disk-monitoring #linux-file-sharing #linux-hardening #linux-hotspot #linux-monitoring-for-small-business #linux-networking #linux-performance-tuning #linux-remote-desktop #linux-security #linux-server-health #lmod #local-dns #local-network #log-management #log-retention #logrotate #loki #low maintenance monitoring #mkcert #monitor cpu usage over time linux #monitor linux server health #monitor server trends #monitor small production server #monitor-server-trends-over-time #monitoring #monitoring without complexity #monitoring-agent #monitoring-for-lean-teams #monitoring-without-devops-team #MySQL #mysql health reporting #MySQL monitoring #mysql optimization #MySQL Performance #mysql performance degradation #mysql performance monitoring #mysql performance trends #mysql query performance issues #mysql server monitoring #mysql slow queries #mysql slow query analysis #mysql slow query monitoring #mysql trends #mysql-health #mysql-heatwave #mysql-indexing #mysql-monitoring-lightweight #mysql-slow-query #mysql-workload-trends #network-automation #network-monitoring #networking #networkpolicy #node-express #nsg #OCI #oci backup #oci bastion tutorial #oci block volume #oci infrastructure as code #OCI monitoring #oci networking #oci oracle database private subnet setup #oci oracle database tutorial #oci security #oci setup guide #oci terraform tutorial #oci tutorial for beginners #oci vcn terraform #oci virtual machine db system guide #oci-database #oci-mysql-heatwave #oci-mysql-heatwave-tutorial #oci-subnets #offline-pwa #openhpc #operations-checklist #oracle base database service tutorial #oracle cloud bastion #oracle cloud free tier tutorial #oracle cloud infrastructure step by step #oracle cloud infrastructure tutorial #oracle cloud storage #oracle database on oci setup #oracle-cloud #oracle-cloud-mysql-database-service #oracle-cloud-mysql-setup #oracle-cloud-vcn-setup #oracle-linux-9 #outbound-connections #patch-management #path-mtu-discovery #Performance #Performance Degradation #performance monitoring #performance trend monitoring #performance trends #ping-monitoring #plan disk growth server #plesk #practical server monitoring #predict disk usage growth #private instance access #process-monitoring #production-database #production-troubleshooting #prometheus #proxmox #query optimization #query-trends #remote-workstation-security #rhel-tuned #rollback #route-tables #rsyslog #rtnetlink #samba-server #Security #security lists #security-hardening #security-monitoring #selinux #server #server health #server health reporting #server health weekly report #server monitoring #Server Performance #server trend analysis #server-administration #server-audit #server-checklist #server-diagnostics #server-hardening #server-health-checklist #server-health-insights #server-security #server-security-audit #server-security-checklist #server-throughput #server-trends #server-troubleshooting #servers #service-worker #siem #simple cpu monitoring linux #simple linux monitoring #simple monitoring small business #simple monitoring system #simple ops monitoring #slow queries #slow query reporting mysql #slow-query-log #slurm #small business infrastructure #small business IT #small business servers #small infrastructure monitoring #small server monitoring #small-business-monitoring #small-business-security #small-business-tech #sosreport #source-built-linux #ssh #ssh bastion #ssh-security #storage capacity planning linux #storage monitoring #subnets #sysadmin-checklist #sysadmin-lab #syscall-monitoring #sysstat #System Health #system health reporting #systemd #tcp-mtu-probing #tcp-tuning #terraform oci compute #terraform oracle cloud infrastructure #track-disk-growth-linux #Trend Monitoring #trend-analysis #trends #tuned-adm #Tutorial #ufw #uptime-checks #uptime-monitoring #vcn #vcn-design #vector #vps-management #vps-setup #vsftpd #vulnerability-response #wazuh #weekly-reports #weekly-server-report #windows-admin #windows-agent #xrdp