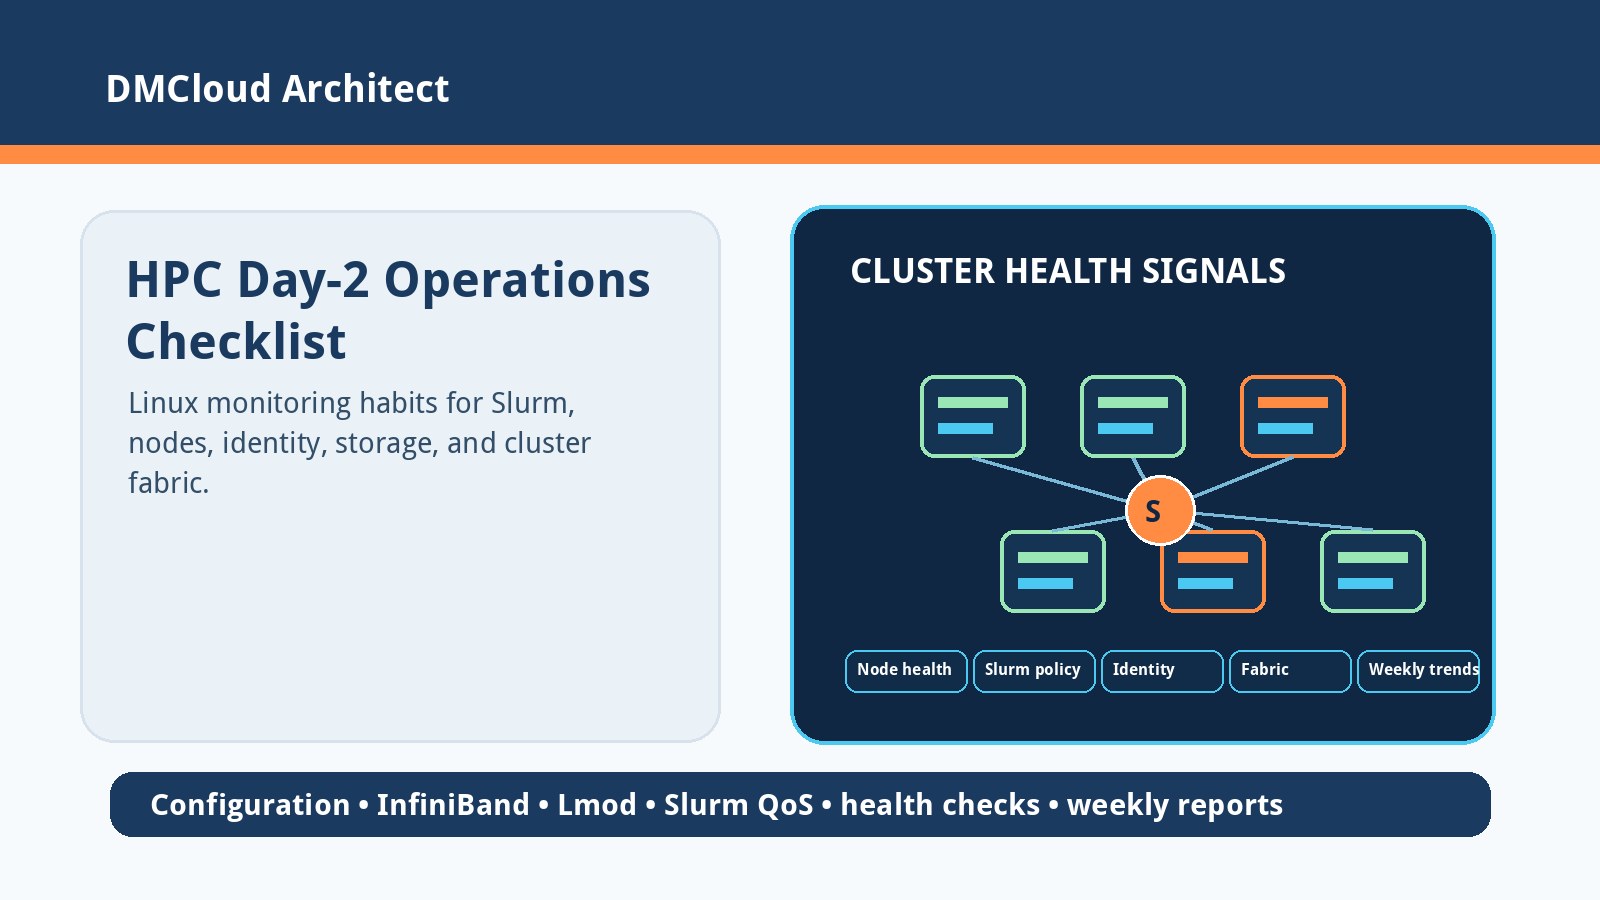
Moving from general Linux administration into HPC cluster administration is a familiar jump: the operating system is still Linux, but the failure modes are now multiplied across login nodes, compute nodes, schedulers, shared storage, identity systems, and high-speed networks. A home lab built with OpenHPC is a strong start, but day-2 operations need a repeatable checklist that covers tuning, access, scheduling, scaling, and linux server monitoring without turning every node into a dashboard project.
This checklist is for Linux admins, developers, and small technical teams who need production habits for a small or growing HPC environment. It is not a replacement for vendor documentation or site-specific performance testing; it is a practical operating baseline for knowing what to review first.
1. Separate build success from operational readiness
A cluster that boots and runs basic jobs is not automatically ready for users. Day-2 readiness means you can explain how the cluster changes, who can access it, what normal performance looks like, and what happens when a node drifts.
- Record the baseline: OS version, kernel, firmware, OFED or network stack versions, Slurm version, OpenHPC packages, storage mounts, and node roles.
- Track configuration sources: keep image builds, kickstart files, Ansible roles, Warewulf/Perceus profiles, and manual exceptions under review.
- Define production states: ready, drained, down, maintenance, burn-in, and retired should mean specific operator actions.
- Document break-glass access: console, out-of-band management, local root recovery, and scheduler-safe maintenance steps matter before the first urgent outage.
The goal is to make the cluster boring to operate. If the only trusted documentation is shell history from the install, production support will be fragile.
2. Tune Linux and hardware with measurable before-and-after tests
Kernel tuning and performance settings should be tied to workload evidence. HPC folklore travels fast, but a setting that helps one workload can hurt another.
- Start with vendor and OpenHPC guidance: align BIOS, CPU governor, NUMA, huge pages, cgroups, and driver recommendations with the hardware platform.
- Use repeatable benchmarks: STREAM, HPL, OSU Micro-Benchmarks, fio, and representative application tests give you a baseline to compare after changes.
- Control one variable at a time: change a single kernel, network, storage, or scheduler setting, then measure and record the result.
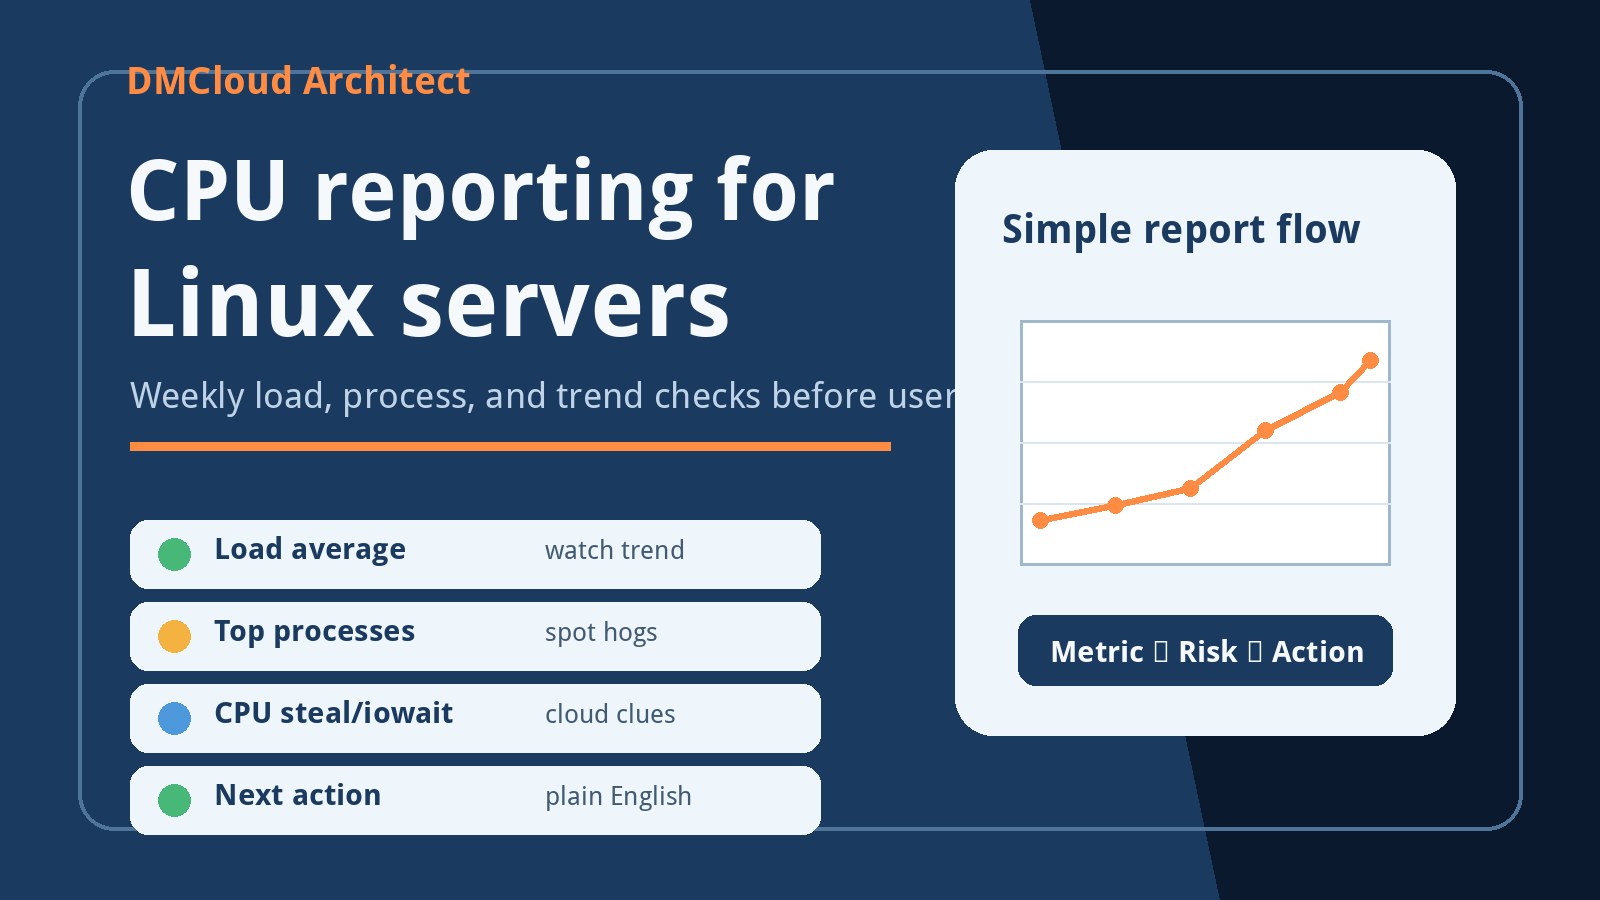
- Watch ordinary Linux health too: disk pressure, inode usage, failed services, load averages, memory errors, clock drift, and package update status still cause cluster problems.
For a small cluster, the best tuning program is disciplined measurement. Guessing at sysctl values is less useful than knowing which change improved the workload you actually run.
3. Treat InfiniBand and high-speed networking as a first-class service
Cluster networking is not just connectivity. It is part of the compute fabric, so link health, latency, MTU, subnet manager behavior, and firmware consistency deserve regular checks.
- Verify fabric health: inspect link state, error counters, width, speed, and flapping ports before blaming applications.
- Keep firmware and drivers aligned: mixed versions can produce intermittent performance problems that look like workload issues.
- Test latency and bandwidth: run node-to-node checks after maintenance, expansion, or cable changes.
- Monitor management and storage paths separately: failures on Ethernet, storage networks, and InfiniBand can present differently.
A simple weekly fabric health summary can catch creeping errors before users report that jobs are mysteriously slower.
4. Build identity and environment control early
User management becomes harder once people depend on the cluster. Even a small team benefits from a clear identity source and predictable software environments.
- Pick a central identity pattern: LDAP, FreeIPA, Active Directory integration, or another source of truth should control users, groups, sudo, and lifecycle.
- Define project groups: map Unix groups to labs, applications, queues, storage areas, and data access boundaries.
- Use Lmod modulefiles deliberately: module names, versions, compiler stacks, MPI builds, and defaults should be documented and tested.
- Avoid hidden environment drift: login-node shell customizations should not be the only way a job gets the right libraries.
For production, the important question is not only “can the user log in?” It is “can the user get the same software behavior next month?”
5. Make Slurm policy explicit before capacity becomes contested
Slurm starts simple, but production operations depend on policy choices: fair sharing, QoS, limits, partitions, preemption, reservations, and accounting. Those choices should be written down before users compete for resources.
- Separate partitions by purpose: debug, general, GPU, high-memory, long-running, and maintenance partitions can have different limits.
- Set safe defaults: default time limits, memory limits, job size limits, and submission guidance prevent accidental cluster-wide misuse.
- Use accounting data: SlurmDBD, sacct, and reports help explain usage instead of relying on anecdotes.
- Plan maintenance windows: draining nodes, reservations, and user communication should be routine, not improvised.
Scheduler policy is both technical and social. Clear defaults reduce conflict because users can see how capacity is shared.
6. Combine node health checks with weekly trend reports
Node Health Check, Slurm health scripts, Prometheus exporters, logs, and simple SSH checks all have a place. The trap is collecting metrics without a review rhythm that turns them into action.
- Run pre-job and periodic checks: verify mounts, GPUs, scratch space, memory, network state, clocks, and critical services before nodes accept work.
- Drain nodes automatically but review why: automatic protection is useful only if the cause is visible and corrected.
- Summarize trends: failed nodes, recurring drains, storage growth, package drift, job failures, load, uptime, and network errors should be reviewed together.
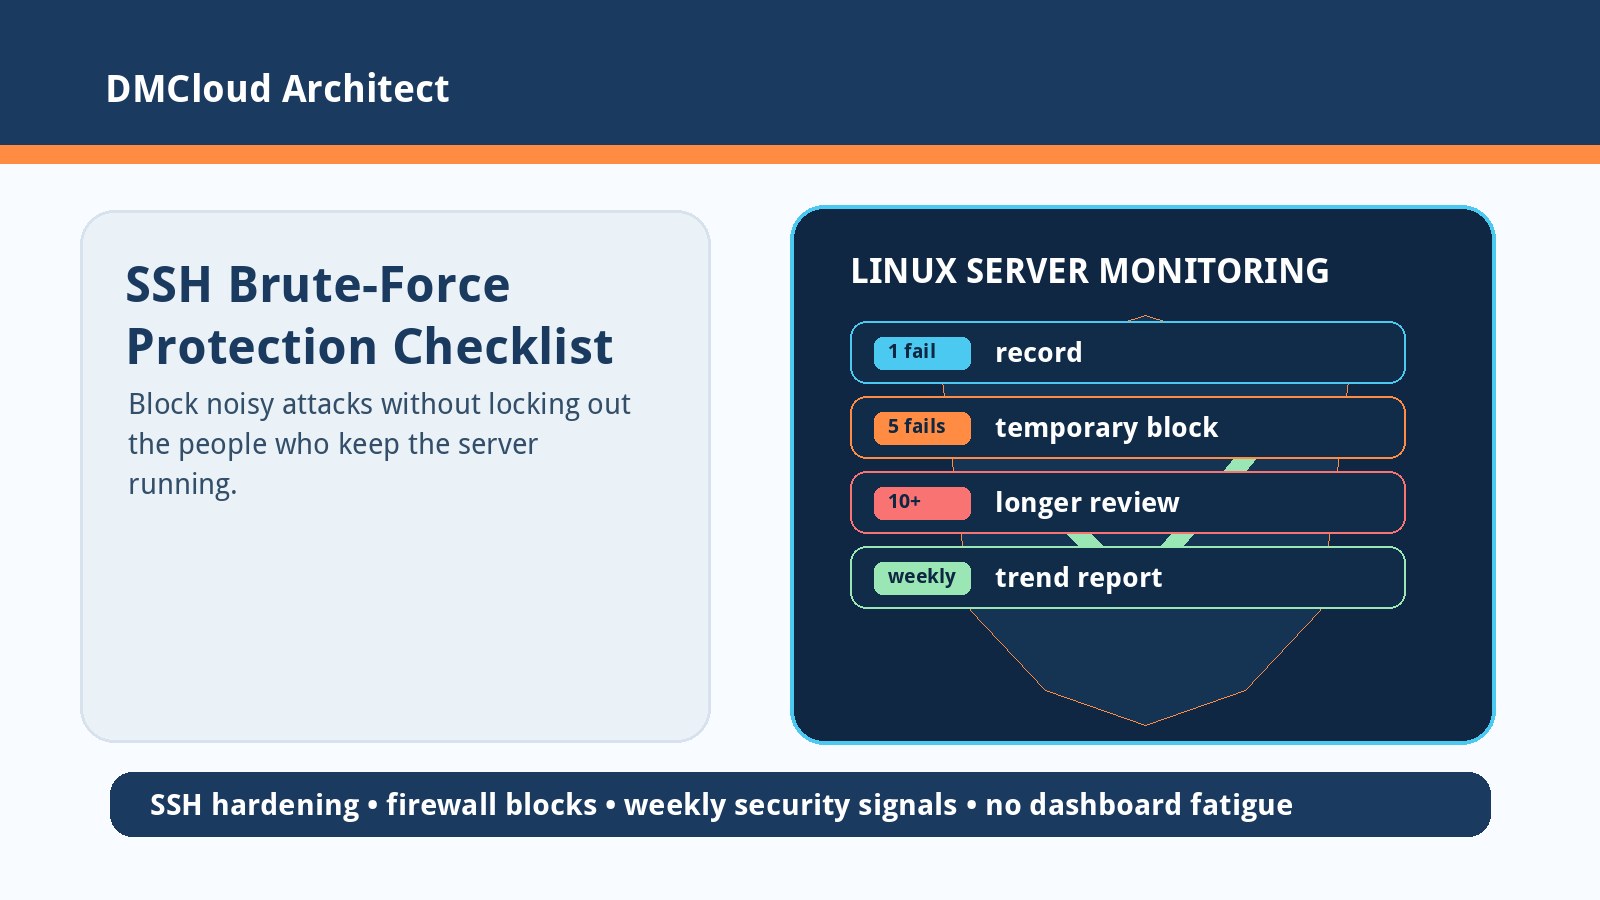
- Keep alerting narrow: page people for urgent failures; summarize non-urgent drift in scheduled reports.
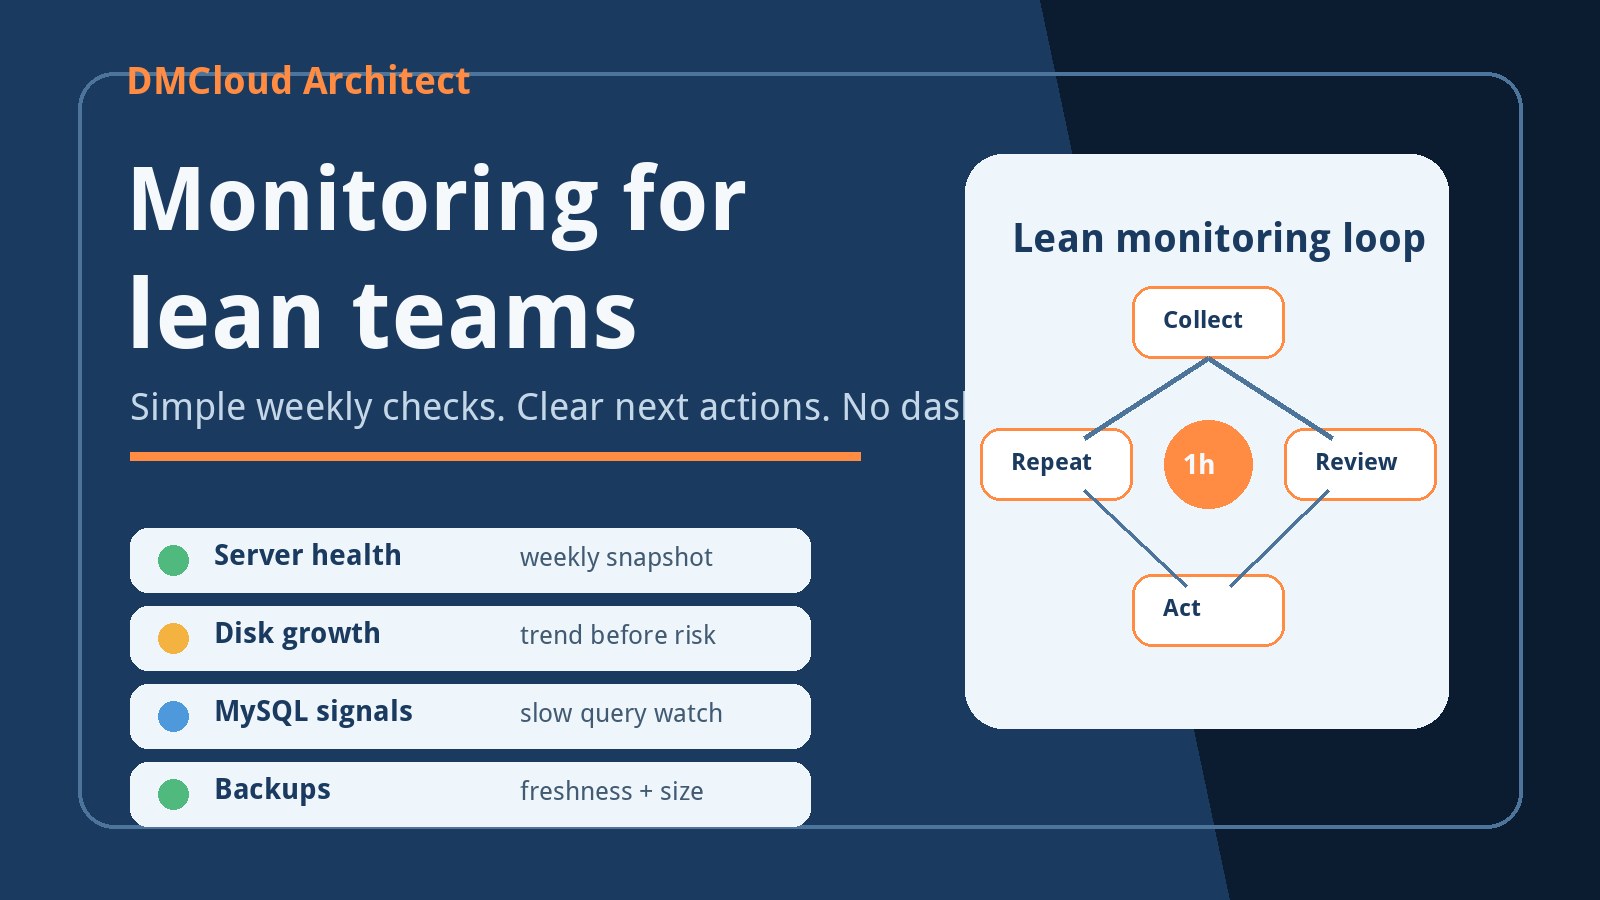
For small teams, weekly infrastructure reports often work better than another live dashboard. They show which Linux server monitoring signals are getting worse without asking someone to watch graphs all day.
7. Know where to learn and what to validate locally
Good HPC resources are usually split across project documentation, scheduler manuals, vendor guides, and community experience. Use them as starting points, then validate against your hardware and workloads.
- OpenHPC documentation: useful for installation patterns, package choices, and cluster component relationships.
- Slurm documentation: essential for scheduling, accounting, limits, QoS, cgroups, reservations, and troubleshooting.
- Lmod documentation: useful for module hierarchy, compiler/MPI stacks, and reproducible user environments.
- FreeIPA and LDAP docs: helpful for identity, access control, sudo rules, and host enrollment.
- Vendor and network guides: necessary for InfiniBand, storage, firmware, BIOS, GPU, and driver tuning.
The practical habit is to turn each resource into a local runbook entry: what setting you chose, why it matters, how to check it, and what action to take when it fails.
8. Use a first-month operations checklist
When a lab cluster moves toward real users, start with a short first-month checklist. This creates enough discipline to avoid surprises without overbuilding enterprise process.
- Week 1: record baselines, verify backups, centralize identity, confirm emergency access, and test Slurm accounting.
- Week 2: add node health checks, define drain reasons, test reboot behavior, and verify modulefile consistency.
- Week 3: benchmark compute, storage, and network paths; document tuning changes and rollback steps.
- Week 4: review trends, queue behavior, failed jobs, storage growth, service restarts, security updates, and user onboarding gaps.
That rhythm turns a home lab exercise into production muscle memory. You do not need a giant observability stack on day one; you need reliable checks, clear ownership, and a weekly habit of reviewing what changed.
Want weekly Linux and MySQL health checks without dashboard fatigue?
DMCloud Architect sends weekly infrastructure health reports to your inbox, highlighting Linux server monitoring signals like disk growth, uptime, package drift, service failures, database pressure, and practical next steps.
Get the free starter plan for weekly infrastructure health reports.