Back to Blog
Disk Scaling Planning for Linux: Forecast Capacity Before It Breaks

Disk Scaling Planning for Linux: Forecast Capacity Before It Breaks

   Mariusz Antonik    Automation    5 min read    23 views

Disk space problems rarely start as dramatic outages. They usually begin as a slow trend: logs grow a little faster, backups take more room, uploads increase, database files expand, and one day the server has only a few gigabytes left. Disk scaling planning Linux work is the habit of noticing that trend early enough to make a calm decision instead of a rushed cleanup.

For developers and small business owners, the goal is not to become storage engineers. The goal is to know how much disk is being used, how quickly it is growing, when it will become risky, and what action should happen before a server runs out of room.

Start with a clear disk baseline

The first step in Linux disk capacity planning is a baseline. Record the size, used space, available space, filesystem mount points, and the largest directories that explain most of the usage. Commands such as df -h, du -sh, and targeted checks under application, database, log, backup, and upload directories are enough for a useful first view.

Do not stop at a single percentage. A filesystem at 78% used might be fine if it grows by one gigabyte per month, and dangerous if it grows by ten gigabytes per day. A capacity report should include both the current usage and the reason it changed since the last report.

Measure growth by category, not only by total size

Total disk usage tells you whether the server is filling. Category-level usage tells you why. Split the report into practical buckets such as database files, uploads, logs, backups, package caches, temporary files, and application releases. This makes disk capacity planning for a server much easier to act on.

If database files are growing, the next action may be retention, indexing review, or storage resizing. If logs are growing, the next action may be rotation and compression. If backups are growing on the same server they protect, the next action may be moving retention off-host. Each cause has a different fix, so the report should avoid lumping everything into one vague disk number.

Forecast runway in days or weeks

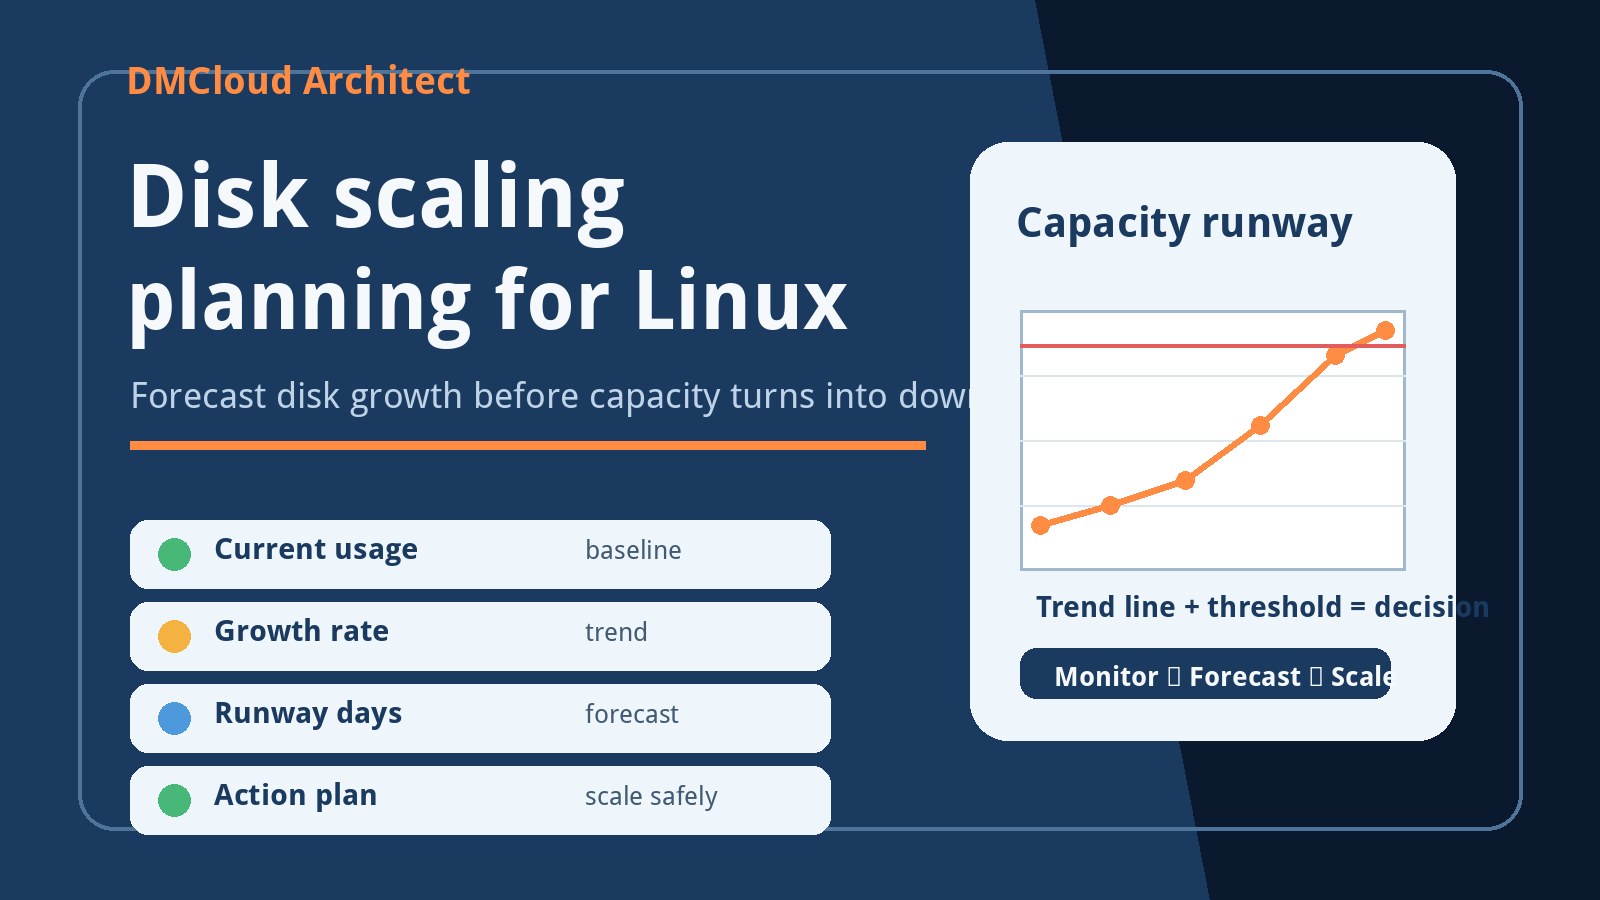
Disk forecasting on Linux becomes useful when the trend is converted into runway. Runway is the estimated time before a filesystem reaches a warning or critical threshold. For example, if a server has 120 GB free and is growing by 4 GB per week, the team has roughly 30 weeks before free space is gone, and much less time before a sensible warning threshold.

A simple report can calculate runway from recent growth. Compare this week with last week, then compare the latest four to eight weeks to avoid overreacting to one unusual upload or cleanup. The forecast does not need to be perfect. It needs to be good enough to say, “We should resize this volume this month,” or “This is stable, keep watching.”

Use thresholds that trigger decisions

Disk thresholds should map to actions. A warning at 75% might mean review the largest directories. A watch status at 85% might mean schedule cleanup or retention changes. A critical status at 90% or 95% might mean resize storage, move data, or pause risky jobs before they fail.

The exact thresholds depend on the workload. A busy database server needs more free space for maintenance, logs, temporary tables, and recovery operations. A static site with predictable uploads may tolerate a different runway. The important point is to write down the threshold and the action so the response is not invented during an incident.

Plan scaling before the emergency cleanup

Emergency cleanup can save a server for the day, but it is not the same as disk scaling planning. Deleting old logs, clearing package caches, and removing temporary files may buy time. Scaling decisions ask a bigger question: should this server get more storage, should data move elsewhere, or should the application store less on the local disk?

Common scaling choices include resizing a cloud block volume, adding a separate mount for uploads, moving backups to object storage, archiving old application data, improving log rotation, or splitting database storage from web storage. The right choice depends on the growth source and the operational risk.

Watch databases, backups, and logs together

Storage capacity planning on Linux is strongest when database, backup, and log signals are reviewed together. A database may grow because the product is successful, because cleanup jobs stopped, or because a new feature writes more history than expected. Backups may grow because retention increased, compression changed, or failed jobs are leaving partial files behind.

A weekly health report should connect those dots. If disk growth accelerated at the same time as a new import job, that is a useful clue. If free space drops every night during backup and recovers later, the server may need temporary working space rather than permanent capacity. If logs grow after an error spike, fixing the application can reduce storage pressure.

A practical Linux disk scaling checklist

Use this checklist for a small production server:

  • Record total, used, available, and percentage used for each important filesystem.
  • List the largest directories under database, uploads, logs, backups, and application paths.
  • Compare current usage with the previous weekly report.
  • Calculate recent growth rate and estimated runway to warning and critical thresholds.
  • Separate temporary cleanup actions from real scaling actions.
  • Confirm backup retention is not consuming the same disk it is meant to protect.
  • Write one recommended next action for every warning or critical filesystem.

Keep the report short enough to use

A disk report should help someone decide what to do next. It does not need every inode, every directory, or every historical datapoint in the main summary. Start with status, current usage, growth rate, runway, cause, and next action. Keep the deeper command output available for follow-up.

DMCloud Architect helps small teams review Linux, MySQL, backups, and disk capacity without dashboard fatigue. If you want weekly infrastructure health reporting that turns disk growth into clear capacity decisions, visit the Infrastructure Health Reporting page.
About the Author
Mariusz Antonik

Oracle Cloud Infrastructure expert and consultant specializing in database management and automation.

All Tags
#Advanced #agent-visibility #agentless-monitoring #alerts #amazon-linux-2023 #argo-cd #auditd #automation #backend-infrastructure #backup-setup #backup-verification #backups #bandwidth-monitoring #bare-metal-server #Bash #bash cpu monitoring script #bash monitoring #bash scripting #bash-automation #bash-scripts #Beginner #Best Practices #bind-dns #block volume backup #brute-force-protection #Capacity Planning #centos-7 #centos-ftp-migration #centralized-logging #chromebook-linux #cifs-mounts #cloud backup strategy #cloud-costs #cloud-database-setup #cloud-networking #cloudflare-workers #cluster-administration #compute #container-monitoring #control-panel-security #cpu bottleneck #CPU Monitoring #cpu monitoring linux #cpu monitoring script linux #cpu trends #cpu usage trends #cpu usage trends linux #cpu-monitoring-script #cpu-monitoring-without-tools #cpu-performance-decline-server #cpu-performance-degradation-linux #cpu-reporting-linux-server #cpu-usage-history-linux #create oracle db system in oci #cron #cron cpu monitoring #cron cpu monitoring linux #cron jobs #cron-monitoring #custom-linux-distribution #cve-advisory #database #database monitoring #database performance #database-health #database-migration #database-setup #debian #deployment-checklist #detect slow queries mysql #devops #devops-checklist #devops-help #devops-learning #disk capacity planning server #disk forecasting linux #disk growth trend linux #Disk Monitoring #disk usage #disk usage script linux #disk usage trends #disk-capacity #disk-growth #disk-saturation-detection-linux #disk-scaling-planning-linux #disk-usage-history-linux #dns-migration #dnssec #Early Detection #easy infrastructure monitoring #egress-monitoring #elasticsearch #exposed-port-monitoring #fail2ban #field-server-checklist #firewall-rules #fleet-ops #free-tier #freelance-sysadmin #gitops-security #growth-trends #Guide #health dashboards #Health Reporting #historical server monitoring #historical-monitoring #home-lab #how to monitor cpu usage linux #hpc #https-certificates #infiniband #infrastructure #infrastructure health #infrastructure health dashboard #infrastructure health reporting #infrastructure monitoring #infrastructure monitoring report #infrastructure trends #infrastructure trends monitoring #Infrastructure Visibility #infrastructure-automation #infrastructure-checklist #infrastructure-reporting #interview-prep #ip-allowlist #iproute2 #journald #kubernetes-security #latency-checks #lightweight linux monitoring #lightweight monitoring #lightweight-monitoring-solution #linux #linux administration #linux cpu monitoring #linux cpu usage #linux disk capacity planning #linux disk usage #Linux monitoring #linux monitoring setup #linux monitoring tools #linux performance #linux performance monitoring #linux server #linux server monitoring #linux servers #linux storage #linux tools #linux-admin #linux-disk-monitoring #linux-file-sharing #linux-hardening #linux-hotspot #linux-monitoring-for-small-business #linux-networking #linux-performance-tuning #linux-remote-desktop #linux-security #linux-server-health #lmod #local-dns #local-network #log-management #log-retention #logrotate #loki #low maintenance monitoring #mkcert #monitor cpu usage over time linux #monitor linux server health #monitor server trends #monitor small production server #monitor-server-trends-over-time #monitoring #monitoring without complexity #monitoring-agent #monitoring-for-lean-teams #monitoring-without-devops-team #MySQL #mysql health reporting #MySQL monitoring #mysql optimization #MySQL Performance #mysql performance degradation #mysql performance monitoring #mysql performance trends #mysql query performance issues #mysql server monitoring #mysql slow queries #mysql slow query analysis #mysql slow query monitoring #mysql trends #mysql-health #mysql-heatwave #mysql-indexing #mysql-monitoring-lightweight #mysql-slow-query #mysql-workload-trends #network-automation #network-monitoring #networking #networkpolicy #node-express #nsg #OCI #oci backup #oci bastion tutorial #oci block volume #oci infrastructure as code #OCI monitoring #oci networking #oci oracle database private subnet setup #oci oracle database tutorial #oci security #oci setup guide #oci terraform tutorial #oci tutorial for beginners #oci vcn terraform #oci virtual machine db system guide #oci-database #oci-mysql-heatwave #oci-mysql-heatwave-tutorial #oci-subnets #offline-pwa #openhpc #operations-checklist #oracle base database service tutorial #oracle cloud bastion #oracle cloud free tier tutorial #oracle cloud infrastructure step by step #oracle cloud infrastructure tutorial #oracle cloud storage #oracle database on oci setup #oracle-cloud #oracle-cloud-mysql-database-service #oracle-cloud-mysql-setup #oracle-cloud-vcn-setup #oracle-linux-9 #outbound-connections #patch-management #path-mtu-discovery #Performance #Performance Degradation #performance monitoring #performance trend monitoring #performance trends #ping-monitoring #plan disk growth server #plesk #practical server monitoring #predict disk usage growth #private instance access #process-monitoring #production-database #production-troubleshooting #proxmox #query optimization #query-trends #remote-workstation-security #rhel-tuned #rollback #route-tables #rsyslog #rtnetlink #samba-server #Security #security lists #security-hardening #security-monitoring #selinux #server #server health #server health reporting #server health weekly report #server monitoring #Server Performance #server trend analysis #server-administration #server-audit #server-checklist #server-hardening #server-health-checklist #server-health-insights #server-security #server-security-audit #server-security-checklist #server-throughput #server-trends #server-troubleshooting #servers #service-worker #siem #simple cpu monitoring linux #simple linux monitoring #simple monitoring small business #simple monitoring system #simple ops monitoring #slow queries #slow query reporting mysql #slow-query-log #slurm #small business infrastructure #small business IT #small business servers #small infrastructure monitoring #small server monitoring #small-business-monitoring #small-business-security #small-business-tech #source-built-linux #ssh #ssh bastion #ssh-security #storage capacity planning linux #storage monitoring #subnets #sysadmin-checklist #sysadmin-lab #syscall-monitoring #System Health #system health reporting #systemd #tcp-mtu-probing #tcp-tuning #terraform oci compute #terraform oracle cloud infrastructure #track-disk-growth-linux #Trend Monitoring #trend-analysis #trends #tuned-adm #Tutorial #ufw #uptime-checks #uptime-monitoring #vcn #vcn-design #vector #vps-management #vps-setup #vsftpd #vulnerability-response #wazuh #weekly-reports #weekly-server-report #windows-admin #windows-agent #xrdp