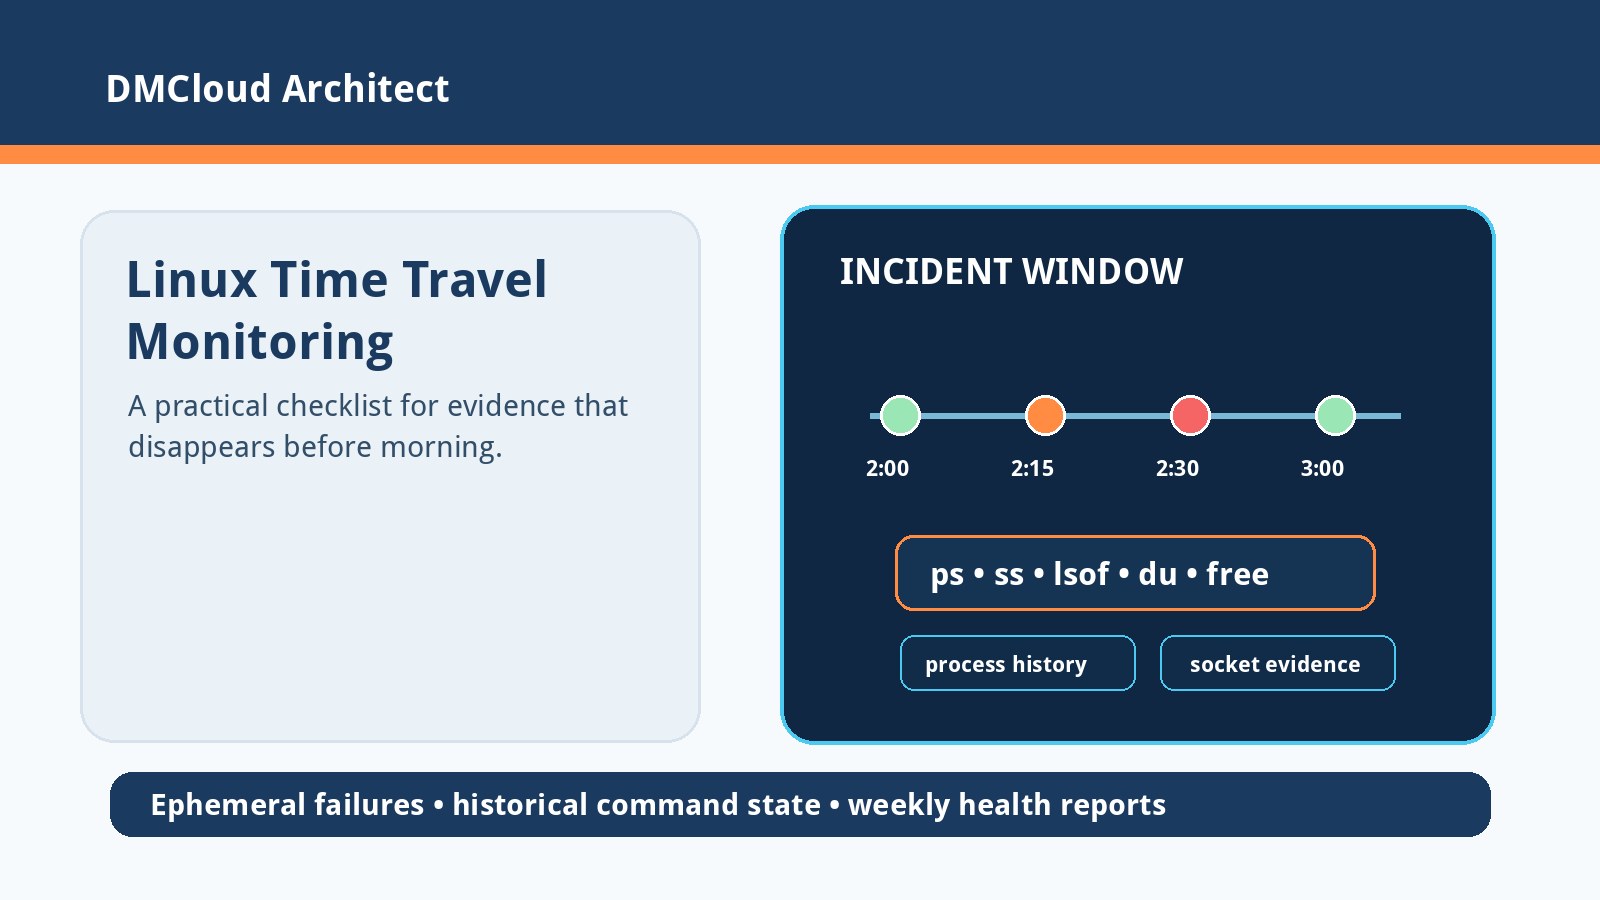
When a Linux server breaks overnight and looks healthy by morning, the hardest question is not “what is the CPU usage now?” It is “what was happening when the failure was active?” That is the real pain behind time travel diagnostics, and it is one of the clearest gaps in practical linux server monitoring.
A time travel tool for Linux can be worth building, but only if it answers questions that logs, Prometheus graphs, sosreports, sar, atop, and current-state commands cannot answer cleanly. Use this checklist to decide where historical command state would help, where existing tools are enough, and where a weekly infrastructure health report is the better operating rhythm.
1. Start with the incident types where evidence disappears
Time travel diagnostics are most valuable when the interesting state is brief, local, and gone before an operator connects. If the problem leaves a clear application error, audit event, crash dump, or metric spike, a new agent may not add much. If the problem is an ephemeral relationship between process, socket, file, mount, memory pressure, and time, historical command state becomes more compelling.
- Short-lived connection storms: which process opened hundreds of connections, entered CLOSE-WAIT, or exhausted a database pool at 2 a.m.?
- Temporary disk pressure: which directory or process filled a filesystem before cleanup removed the evidence?
- Memory spikes that exit: which job, cron script, export task, backup, or container consumed memory and then vanished?
- Open file leaks: which process held deleted files, log handles, or temporary files during the outage window?
- Node-level Kubernetes mysteries: what was running on the node when pods were evicted, networking failed, or storage briefly stalled?
If your last few incidents fit those patterns, the idea is not a gimmick. It addresses a real diagnostic blind spot.
2. Compare the tool against what teams already have
Most Linux teams already have partial time machines. The practical question is whether a new tool reduces investigation time enough to justify another production component.
- sar/sysstat: strong for historical CPU, load, memory, disk, and network counters, but weak for process-to-socket or process-to-file relationships.
- atop: useful for historical process resource usage, but not always deployed, retained, or configured with enough detail for every question.
- Prometheus and exporters: excellent for trends and alerting, but labels and cardinality limits often prevent “show me every process and socket at this moment.”
- logs: essential when applications record the event, but many kernel, socket, and file-handle states never become useful log lines.
- sosreport: great for a captured support snapshot, but a snapshot taken after recovery records the wrong moment.
- auditd/eBPF/PCP: powerful, but they require careful policy, overhead, retention, and operator skill.
The strongest product gap is not “graphs from the past.” It is a low-friction way to ask familiar Linux questions against the incident window: ps, ss, lsof, du, free, mount, lsblk, systemctl state, and similar evidence with timestamps.
3. Define the first five questions it must answer
A time travel diagnostic tool should be judged by concrete investigation questions, not by how many commands it can replay. Start with a small set of high-value questions that match real outages.
- Connections: which process owned connections to a specific host, port, or service during the alert window?
- Files: which process had a deleted, growing, or blocked file open?
- Disk growth: which paths grew fastest between two timestamps?
- Process ancestry: was the culprit an interactive shell, cron job, systemd unit, backup script, deployment, or application worker?
- Resource pressure: which processes were present when memory, swap, load, or IO wait changed?
If those five answers are fast, searchable, and trustworthy, the tool has operational value. If it only replays generic top-style metrics, teams may stay with existing linux server monitoring tools.
4. Keep overhead and retention boring
Production teams will reject a diagnostic agent if it feels risky. The adoption bar is not only technical accuracy; it is whether the tool can run quietly, explain its cost, and stay inside security boundaries.
- Sample deliberately: not every command needs one-second history. Use event-based capture where possible and sensible sampling where necessary.
- Bound storage: define retention by host role, incident value, and privacy risk. Seven to fourteen days may be enough for many small teams.
- Compress and summarize: store structured facts and deltas instead of raw command text when it reduces noise and sensitivity.
- Make overhead visible: report CPU, memory, IO, and disk impact from the agent itself so operators can trust it.
- Fail safely: if the recorder falls behind, it should drop low-value samples before it harms the machine being diagnosed.
“No significant performance impact” must be measured, not promised. The tool should publish its own health signals so admins know when it is helping and when it is getting in the way.
5. Treat security and privacy as product requirements
Historical process, socket, file, and command state can contain sensitive information. A central diagnostics server may be acceptable in one environment and blocked in another. Build the policy model before collecting rich evidence.
- Minimize secrets: avoid collecting command arguments, environment variables, file contents, or usernames unless there is a clear need and redaction path.
- Support local-only mode: some organizations will accept local retention but not off-host telemetry.
- Encrypt at rest and in transit: historical diagnostics can be as sensitive as logs.
- Control access: only operators with a need should query host history, and every query should be auditable.
- Offer redaction rules: paths, process names, usernames, network targets, and arguments may need masking by policy.
For small businesses, this matters too. The fastest way to lose trust is to install a monitoring tool that quietly captures more detail than anyone expected.
6. Decide where it fits beside dashboards and reports
Time travel diagnostics should not replace alerting, dashboards, logs, or weekly reports. It should fill a specific investigation gap after a symptom is detected.
- Alerts answer: something is wrong now or recently.
- Dashboards answer: what broad metric changed over time?
- Logs answer: what did the application or system choose to record?
- Time travel diagnostics answer: what process, socket, file, or command state existed during the window?
- Weekly reports answer: what is drifting before it becomes an incident?
This distinction is important for lean teams. A time travel tool is most useful during incident review. Weekly reports are better for recurring capacity, patching, disk, service, uptime, and database trend review because nobody has to watch dashboards all day.
7. Build the minimum useful version first
The first release should focus on a small set of trusted queries rather than a broad promise to recreate any historical command. Operators need confidence that the answer is accurate for the incident window.
- Start with ps, ss, lsof, df/du summaries, memory, and systemd state.
- Group by process identity: executable, service, parent, container or cgroup, user, and first/last seen timestamps.
- Preserve event boundaries: connect, close, process start, process exit, file open, and file close are more useful than random samples alone.
- Make output diff-friendly: operators should see what changed between the start, peak, and recovery moments.
- Integrate with incident notes: allow the team to save query results to the postmortem without exporting sensitive raw data.
If the minimum version can explain “what held these database connections between 2:00 and 3:00,” it has a clear reason to exist.
8. Use this go/no-go checklist
Before building or adopting a Linux time travel tool, answer these questions with your own incidents in mind.
- Do recent outages involve evidence that disappeared before investigation?
- Are the missing facts process, socket, file, mount, memory, or service-state facts?
- Would existing tools answer the same question with better configuration?
- Can you collect the needed state without unsafe overhead or sensitive data exposure?
- Can operators query it quickly without learning a whole new investigation language?
- Does it complement your current linux server monitoring instead of duplicating it?
If most answers are yes, the tool is worth prototyping. If not, your first improvement may be simpler: tune sysstat/atop retention, add a few targeted exporters, improve log context, and review weekly health trends before the next incident.
Want weekly Linux and MySQL health checks without dashboard fatigue?
DMCloud Architect sends weekly infrastructure health reports to your inbox, highlighting linux server monitoring signals like disk growth, uptime, service failures, package drift, database pressure, and practical next steps.
Get the free starter plan for weekly infrastructure health reports.