Back to Blog
CPU Reporting for Linux Servers: A Practical Weekly Guide

CPU Reporting for Linux Servers: A Practical Weekly Guide

   Mariusz Antonik    Automation    5 min read    18 views

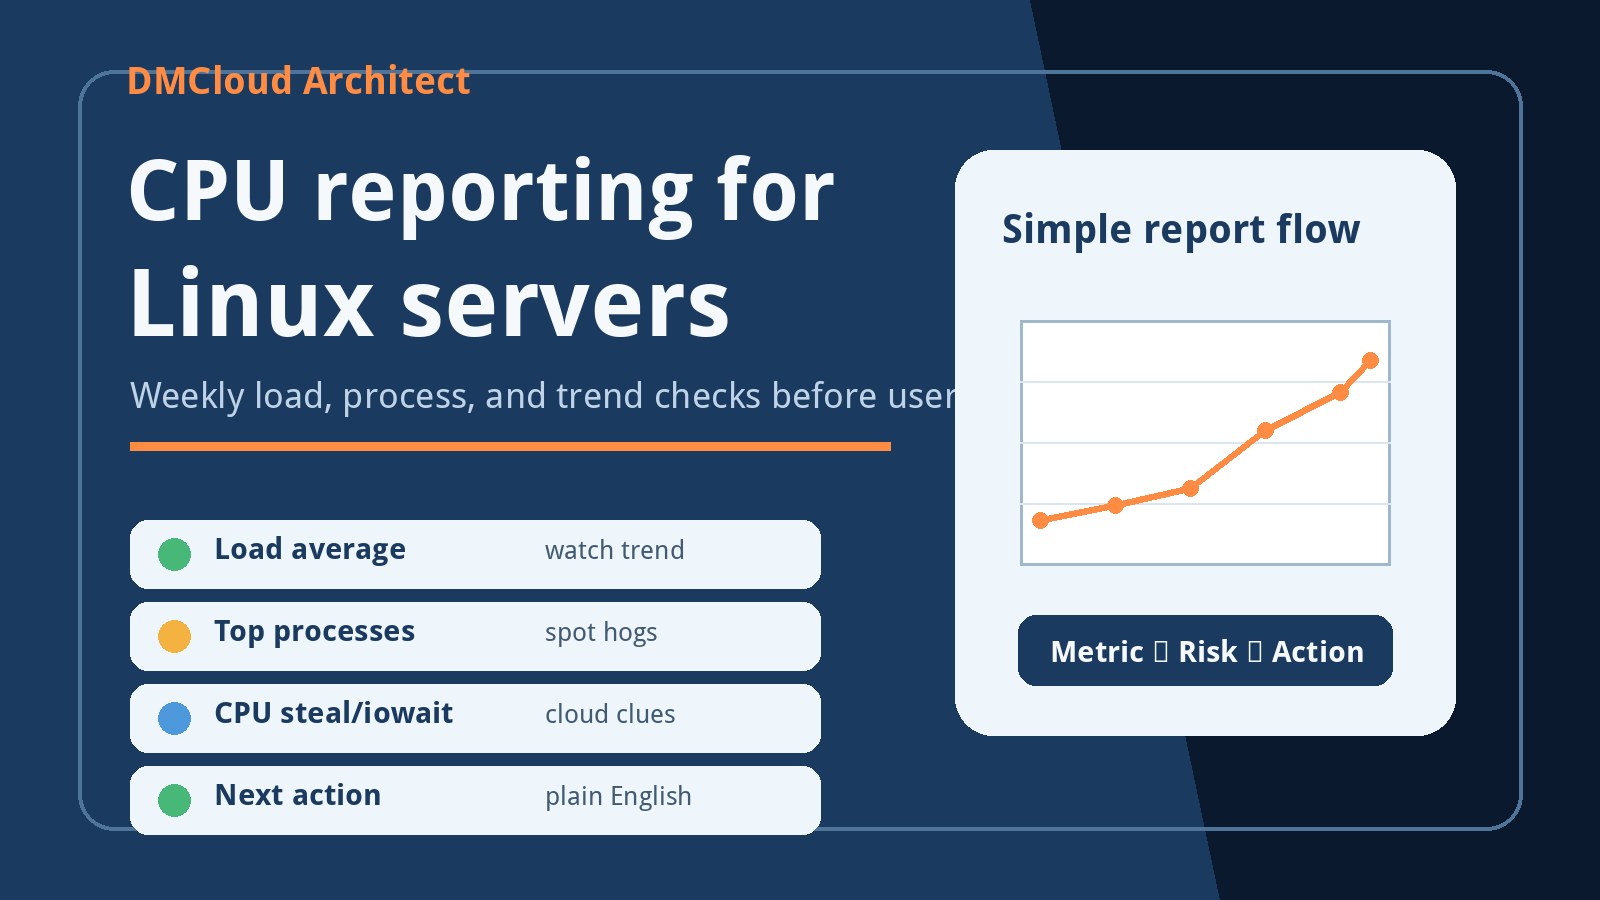
CPU numbers are easy to collect and surprisingly easy to misread. A Linux server can show a high percentage for a short burst and still be healthy, or it can look mostly quiet while slow database queries, background jobs, or virtual machine contention are creating real user pain. CPU reporting Linux server work should focus on patterns, context, and next actions rather than isolated snapshots.

For developers and small business owners, the practical question is simple: is the server getting slower, and do we need to act before customers notice? A weekly CPU report gives you a calm way to answer that question without staring at live dashboards all day.

Start with load average, not just CPU percentage

CPU percentage shows activity at a point in time. Load average shows how many tasks are running or waiting over one, five, and fifteen minutes. On Linux, that makes load average one of the fastest ways to see whether work is backing up.

A useful report records the one, five, and fifteen minute load values and compares them to the number of CPU cores. If a two-core server regularly has a fifteen minute load above two, the machine may be spending too much time with processes waiting. If that only happens during a backup or scheduled import, the next action may be scheduling. If it happens during normal traffic, it may be capacity or application tuning.

Capture the processes behind the spike

Load numbers are only the start. A CPU report should also show the top processes at the time of collection. This is where simple commands such as ps, top in batch mode, or a small bash CPU monitoring script become useful.

Record the command name, process owner, CPU share, memory share, and runtime for the top few processes. A MySQL process using CPU during business hours tells a different story than a backup compressor using CPU at midnight. The goal is to explain what caused the pressure in plain language.

Watch iowait and steal time on virtual servers

Not every CPU-looking problem is pure CPU demand. High iowait can mean the CPU is waiting on disk, storage, or database IO. High steal time on a virtual machine can mean the hypervisor is taking CPU time away from your instance. Both can make a Linux server feel slow even when application code has not changed.

Include these values in the weekly report if your collection method can capture them from tools such as mpstat, vmstat, or sar. When iowait rises alongside database slowdown, the next action may be storage review or query tuning. When steal time rises on a cloud VM, the next action may be moving instance shape, host, or workload timing.

Use cron for a lightweight reporting rhythm

You do not need a full monitoring platform to start. A small script can collect load average, process summaries, CPU counters, uptime, and recent application or database symptoms on a schedule. Cron CPU monitoring on Linux is often enough for a first weekly reporting habit.

The important part is to store each run so you can compare today with last week. A one-time command answers “what is happening now?” A weekly history answers “is this getting worse?” That second answer is much more useful for preventing avoidable downtime.

Turn raw values into readable statuses

Raw CPU output is not a business report. Convert it into short statuses such as healthy, watch, action needed, or urgent. Each status should include one reason and one suggested next action.

  • Healthy: load is below core count, no unusual long-running CPU-heavy processes, and trend is stable.
  • Watch: load is rising week over week, but the source is understood and not yet customer-facing.
  • Action needed: CPU pressure lines up with site slowness, database waits, failed jobs, or recurring high-load windows.
  • Urgent: the server is consistently overloaded, critical jobs are failing, or user-facing services are timing out.

This keeps the report useful for people who are not living inside Linux metrics every day. A founder or manager may not care about every counter, but they do need to know whether the risk is stable, growing, or ready for action.

Compare CPU with database and disk signals

CPU reporting is strongest when it is reviewed beside related server health checks. A rising CPU trend can be caused by traffic growth, a new feature, a slow query, backup compression, log processing, malware, or a batch job that no longer fits its schedule. Looking at CPU alone can send you toward the wrong fix.

Match CPU notes with MySQL slow query changes, disk growth, memory pressure, swap use, backup timing, and web response time. If CPU rises at the same time as slow queries, tune the database path first. If CPU rises during backups, adjust compression, retention, or timing before upgrading the server.

A weekly CPU reporting checklist

Use this practical checklist for a small Linux server:

  • Record one, five, and fifteen minute load averages.
  • Compare load to available CPU cores.
  • Capture top CPU processes and their owners.
  • Note iowait, steal time, and swap activity where available.
  • Compare this week's numbers with the previous report.
  • Check whether CPU changes line up with MySQL, disk, backup, or web response signals.
  • Write one next action for every warning.

Keep the report small enough to read

The best CPU report is not the longest one. It is the one someone will actually review. Start with a short weekly summary, a few trend numbers, the top process explanation, and one recommended action. Add detail only when it changes the decision.

DMCloud Architect helps small teams review Linux and MySQL server health without dashboard fatigue. If you want weekly infrastructure health reporting that turns CPU, disk, database, and backup signals into clear next actions, visit the Infrastructure Health Reporting page.
About the Author
Mariusz Antonik

Oracle Cloud Infrastructure expert and consultant specializing in database management and automation.

All Tags
#Advanced #agent-visibility #agentless-monitoring #alerts #amazon-linux-2023 #argo-cd #auditd #automation #backend-infrastructure #backup-setup #backup-verification #backups #bandwidth-monitoring #bare-metal-server #Bash #bash cpu monitoring script #bash monitoring #bash scripting #bash-automation #bash-scripts #Beginner #Best Practices #bind-dns #block volume backup #brute-force-protection #Capacity Planning #centos-7 #centos-ftp-migration #centralized-logging #chromebook-linux #cifs-mounts #cloud backup strategy #cloud-costs #cloud-database-setup #cloud-networking #cloudflare-workers #compute #container-monitoring #control-panel-security #cpu bottleneck #CPU Monitoring #cpu monitoring linux #cpu monitoring script linux #cpu trends #cpu usage trends #cpu usage trends linux #cpu-monitoring-script #cpu-monitoring-without-tools #cpu-performance-decline-server #cpu-performance-degradation-linux #cpu-reporting-linux-server #cpu-usage-history-linux #create oracle db system in oci #cron #cron cpu monitoring #cron cpu monitoring linux #cron jobs #cron-monitoring #custom-linux-distribution #cve-advisory #database #database monitoring #database performance #database-health #database-migration #database-setup #debian #deployment-checklist #detect slow queries mysql #devops #devops-checklist #devops-help #devops-learning #disk capacity planning server #disk forecasting linux #disk growth trend linux #Disk Monitoring #disk usage #disk usage script linux #disk usage trends #disk-capacity #disk-growth #disk-saturation-detection-linux #disk-usage-history-linux #dns-migration #dnssec #Early Detection #easy infrastructure monitoring #egress-monitoring #elasticsearch #exposed-port-monitoring #fail2ban #field-server-checklist #firewall-rules #fleet-ops #free-tier #freelance-sysadmin #gitops-security #growth-trends #Guide #health dashboards #Health Reporting #historical server monitoring #historical-monitoring #home-lab #how to monitor cpu usage linux #https-certificates #infrastructure #infrastructure health #infrastructure health dashboard #infrastructure health reporting #infrastructure monitoring #infrastructure monitoring report #infrastructure trends #infrastructure trends monitoring #Infrastructure Visibility #infrastructure-automation #infrastructure-checklist #infrastructure-reporting #interview-prep #ip-allowlist #iproute2 #journald #kubernetes-security #latency-checks #lightweight linux monitoring #lightweight monitoring #lightweight-monitoring-solution #linux #linux administration #linux cpu monitoring #linux cpu usage #linux disk capacity planning #linux disk usage #Linux monitoring #linux monitoring setup #linux monitoring tools #linux performance #linux performance monitoring #linux server #linux server monitoring #linux servers #linux storage #linux tools #linux-admin #linux-disk-monitoring #linux-file-sharing #linux-hardening #linux-hotspot #linux-monitoring-for-small-business #linux-networking #linux-performance-tuning #linux-remote-desktop #linux-security #linux-server-health #local-dns #local-network #log-management #log-retention #logrotate #loki #low maintenance monitoring #mkcert #monitor cpu usage over time linux #monitor linux server health #monitor server trends #monitor small production server #monitor-server-trends-over-time #monitoring #monitoring without complexity #monitoring-agent #monitoring-for-lean-teams #monitoring-without-devops-team #MySQL #mysql health reporting #MySQL monitoring #mysql optimization #MySQL Performance #mysql performance degradation #mysql performance monitoring #mysql performance trends #mysql query performance issues #mysql server monitoring #mysql slow queries #mysql slow query analysis #mysql slow query monitoring #mysql trends #mysql-health #mysql-heatwave #mysql-indexing #mysql-monitoring-lightweight #mysql-slow-query #mysql-workload-trends #network-automation #network-monitoring #networking #networkpolicy #node-express #nsg #OCI #oci backup #oci bastion tutorial #oci block volume #oci infrastructure as code #OCI monitoring #oci networking #oci oracle database private subnet setup #oci oracle database tutorial #oci security #oci setup guide #oci terraform tutorial #oci tutorial for beginners #oci vcn terraform #oci virtual machine db system guide #oci-database #oci-mysql-heatwave #oci-mysql-heatwave-tutorial #oci-subnets #offline-pwa #operations-checklist #oracle base database service tutorial #oracle cloud bastion #oracle cloud free tier tutorial #oracle cloud infrastructure step by step #oracle cloud infrastructure tutorial #oracle cloud storage #oracle database on oci setup #oracle-cloud #oracle-cloud-mysql-database-service #oracle-cloud-mysql-setup #oracle-cloud-vcn-setup #oracle-linux-9 #outbound-connections #patch-management #path-mtu-discovery #Performance #Performance Degradation #performance monitoring #performance trend monitoring #performance trends #ping-monitoring #plan disk growth server #plesk #practical server monitoring #predict disk usage growth #private instance access #process-monitoring #production-database #production-troubleshooting #proxmox #query optimization #query-trends #remote-workstation-security #rhel-tuned #rollback #route-tables #rsyslog #rtnetlink #samba-server #Security #security lists #security-hardening #security-monitoring #selinux #server #server health #server health reporting #server health weekly report #server monitoring #Server Performance #server trend analysis #server-administration #server-audit #server-checklist #server-hardening #server-health-checklist #server-health-insights #server-security #server-security-audit #server-security-checklist #server-throughput #server-trends #server-troubleshooting #servers #service-worker #siem #simple cpu monitoring linux #simple linux monitoring #simple monitoring small business #simple monitoring system #simple ops monitoring #slow queries #slow query reporting mysql #slow-query-log #small business infrastructure #small business IT #small business servers #small infrastructure monitoring #small server monitoring #small-business-monitoring #small-business-security #small-business-tech #source-built-linux #ssh #ssh bastion #ssh-security #storage capacity planning linux #storage monitoring #subnets #sysadmin-checklist #sysadmin-lab #syscall-monitoring #System Health #system health reporting #systemd #tcp-mtu-probing #tcp-tuning #terraform oci compute #terraform oracle cloud infrastructure #track-disk-growth-linux #Trend Monitoring #trend-analysis #trends #tuned-adm #Tutorial #ufw #uptime-checks #uptime-monitoring #vcn #vcn-design #vector #vps-management #vps-setup #vsftpd #vulnerability-response #wazuh #weekly-reports #weekly-server-report #windows-admin #windows-agent #xrdp