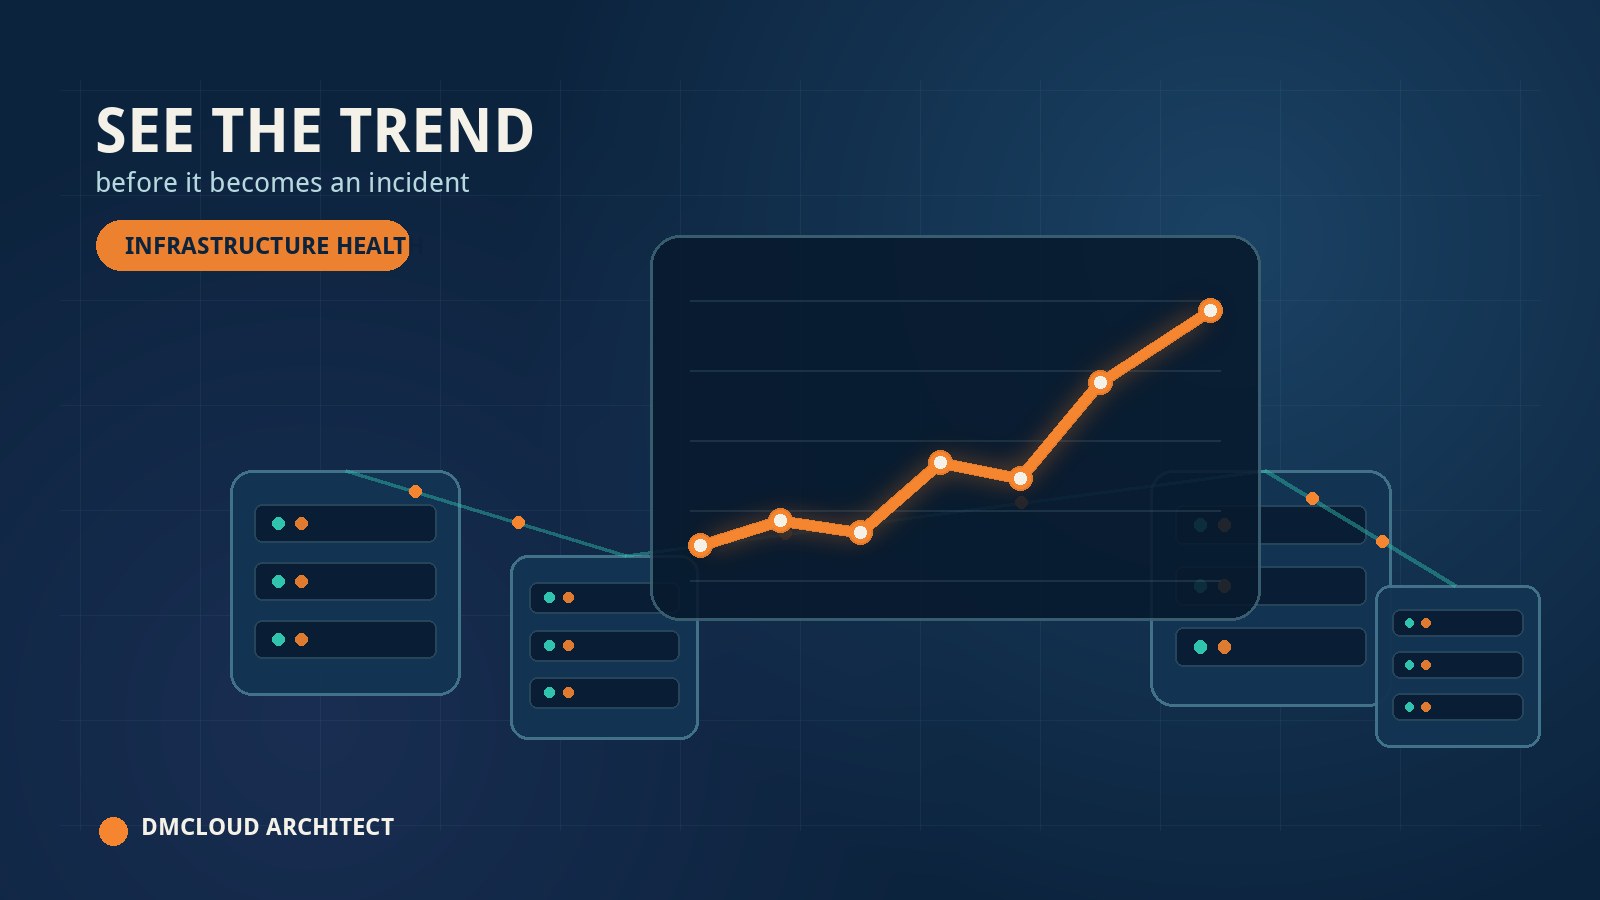
A server can look healthy today while moving steadily toward trouble. Disk use may rise by only a few percentage points each week, database queries may become slightly slower, or backup jobs may finish a little later every night. Each snapshot looks harmless on its own. Infrastructure trend visibility connects those snapshots so developers and small business owners can see the direction of travel before users feel the impact.
This does not require a complicated observability platform or another screen of live charts. A focused weekly review can show whether important Linux, database, storage, and backup signals are stable, drifting, or ready for action. The goal is not to predict every failure. It is to create enough historical context to make routine maintenance earlier, calmer, and less expensive.
Why a healthy snapshot can hide a growing risk
Thresholds answer a narrow question: is a metric beyond a fixed limit right now? Trends answer a more useful operational question: is the system moving toward a limit, and how quickly? A disk at 68 percent capacity may be fine if usage has stayed flat for six months. The same disk deserves attention if it was at 48 percent four weeks ago.
The same principle applies across a small production environment. CPU may remain below an alert threshold while its weekly peak keeps climbing. Available memory may shrink after every application release. A MySQL report may still complete successfully while its runtime doubles over two months. Historical server monitoring turns these quiet changes into visible evidence.
Choose trends that connect to real operational decisions
Collecting more data does not automatically create better visibility. Start with signals that can change a decision. If storage growth continues, will you archive files, rotate logs, or increase capacity? If database latency rises, will you inspect query plans or indexes? If backup duration expands, will it collide with business hours or other maintenance work?
A useful weekly set for many small teams includes CPU load, memory pressure, swap activity, disk usage, inode usage, database connections, slow-query patterns, service restarts, backup success, backup duration, and certificate expiry. Add application-specific signals only when someone can explain what action a change would trigger.
Build a baseline before labeling normal behavior
One week of readings is a snapshot, not a baseline. Keep measurements consistent for several reporting cycles and note expected events such as releases, imports, marketing campaigns, month-end jobs, or maintenance. Those annotations stop normal workload changes from being mistaken for unexplained degradation.
Baselines should also respect seasonality. A retail system may be busier on weekends. An accounting application may have month-end peaks. A backup server may show high I/O at the same time each night. Server trend analysis is most useful when the current period is compared with a genuinely similar period, not just an arbitrary average.
Track storage as a rate, not only a percentage
Free-space alerts often arrive too late because they focus on the current percentage. Infrastructure trends monitoring should record both remaining capacity and the rate of change. If a volume loses 4 GB per week, a team can estimate when it will cross a safe operating margin and plan work before an emergency cleanup.
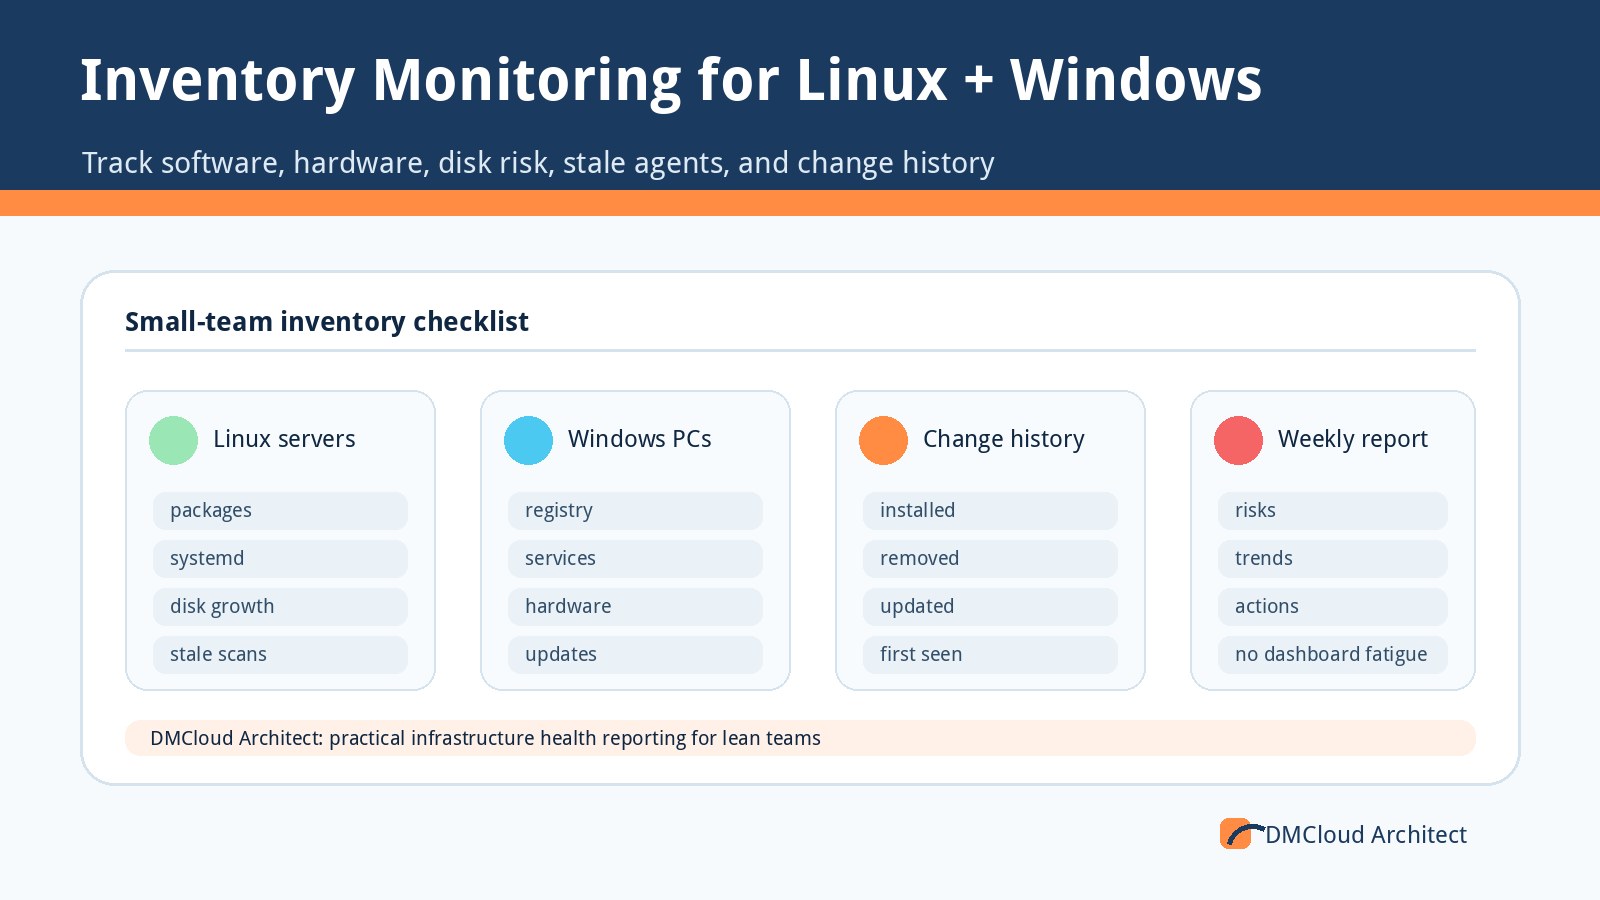
Break unexpected growth into likely causes. Check application uploads, database data files, binary logs, system journals, temporary files, package caches, and forgotten backups. Inode consumption matters too: a filesystem can fail to create files even when it still reports plenty of free bytes. A weekly view makes slow leaks and retention mistakes much easier to spot.
Compare CPU, memory, and workload together
CPU or memory charts without workload context can be misleading. A higher CPU peak may be perfectly healthy if the application served twice as many requests. The stronger warning is resource usage rising while workload stays flat, because that can point to inefficient code, a configuration change, a runaway process, or a growing dataset.
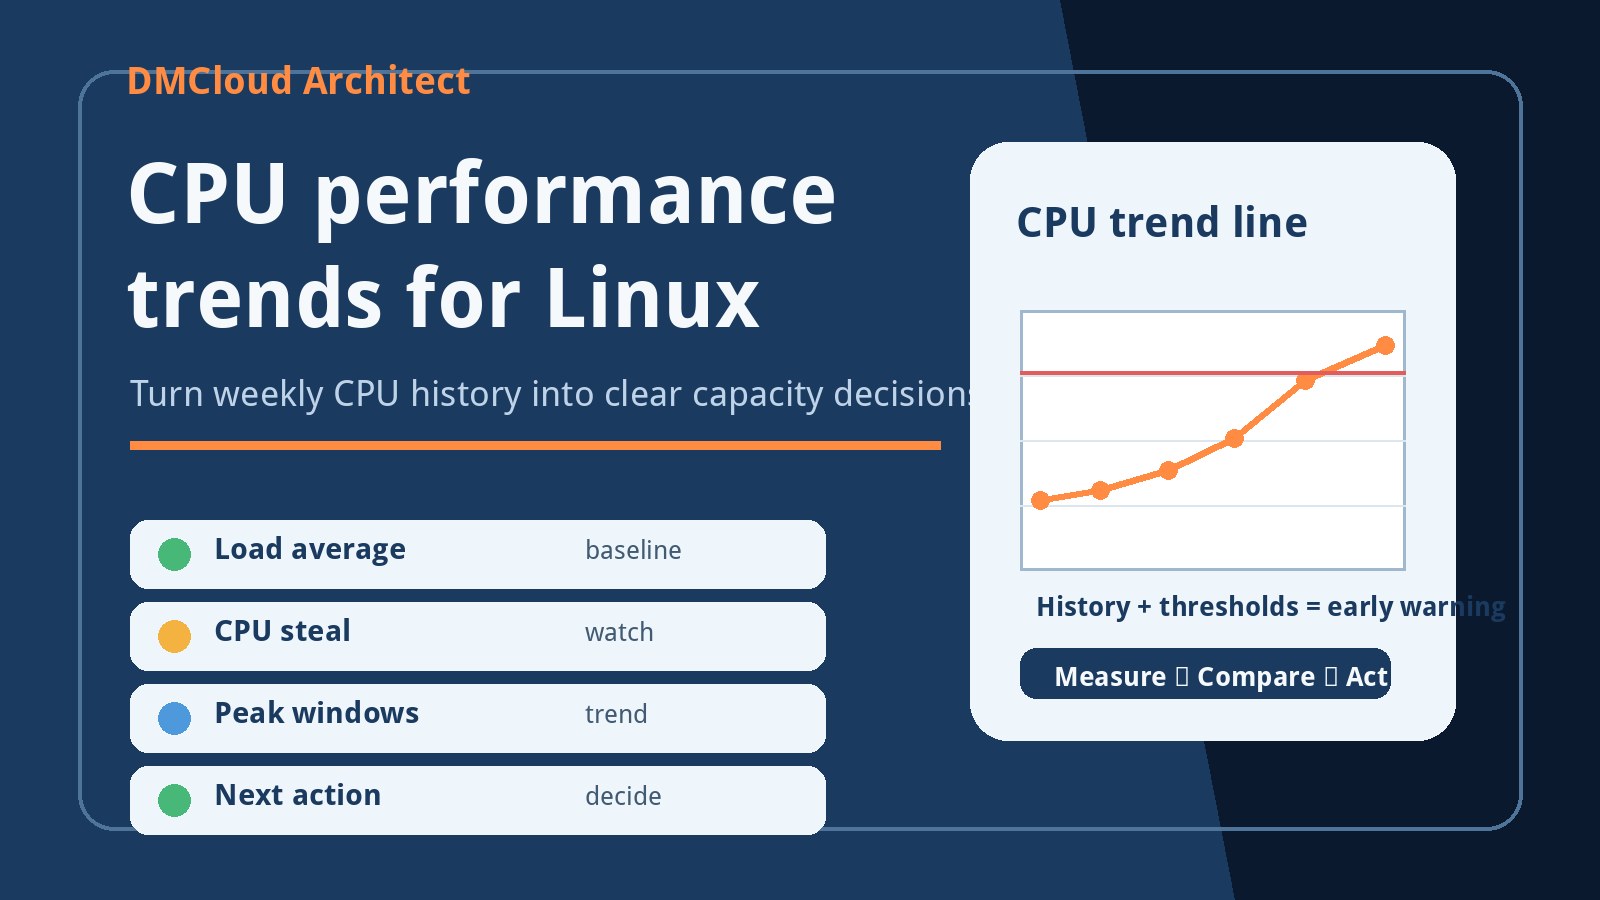
Review load average, CPU saturation, I/O wait, available memory, and swap alongside known application activity. Look for repeated timing patterns and changes after deployments. Performance trend monitoring should explain whether a resource increase reflects useful work, temporary maintenance, or unexplained pressure that needs investigation.
Use database trends to find gradual performance loss
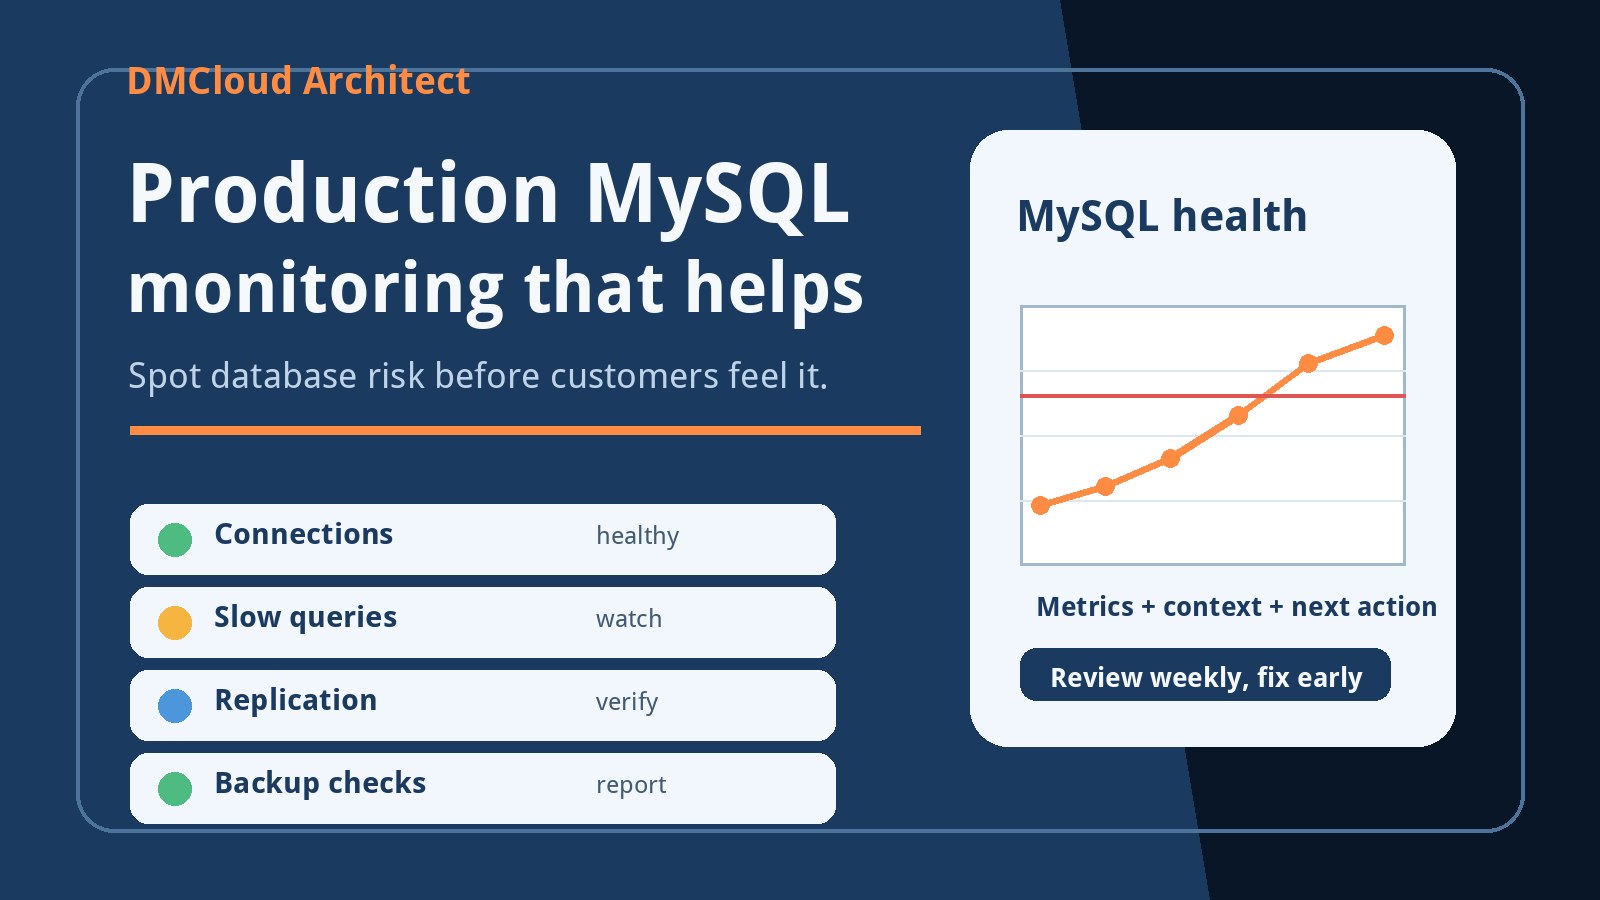
Database problems often develop gradually. Connection counts climb as an application scales, tables grow beyond the assumptions behind an old index, and once-fast reports begin reading much more data. A weekly review should compare connection peaks, repeated slow queries, query duration, lock waits, replication lag where relevant, and database storage growth.
Do not treat every slow query as equally urgent. A monthly report that takes a few seconds may matter less than a small query that now runs thousands of times per hour. Trend-based monitoring helps rank work by frequency, direction, and user impact rather than by one dramatic-looking number.
Watch backups for deterioration, not just failure
A successful status is not proof that a backup process is healthy. Record start time, finish time, duration, output size, destination capacity, and the age of the newest usable backup. An expanding duration can reveal database growth, slower storage, network congestion, compression changes, or a job that is approaching its maintenance window.
Output size also provides useful context. A sudden drop may indicate missing data or a changed scope. An unexplained jump may indicate duplication or retention problems. Restore testing remains essential, but historical trends can identify backup risks before the first outright failure.
Turn raw history into stable, watch, and action statuses
Small teams rarely benefit from a long list of unlabeled metrics. Summarize each important area with a simple status and a reason:
- Stable: behavior remains within the recent baseline and no meaningful adverse trend is visible.
- Watch: a metric is drifting, but there is enough capacity or time to investigate normally.
- Action: the current rate or repeated failure pattern is likely to affect reliability, security, backups, or user experience.
The explanation matters more than the color. “Watch: disk usage increased from 54 to 67 percent in four weeks, mostly in binary logs” gives someone a starting point. “Storage warning” does not.
A practical weekly trend review
Keep the review short enough to repeat. A useful routine can be completed in a few steps:
- Collect the same core measurements at the same interval.
- Compare this week with recent weeks and a similar workload period.
- Annotate releases, imports, maintenance, and unusual traffic.
- Highlight the few trends that changed meaningfully.
- Assign stable, watch, or action status with a plain-language reason.
- Record one owner and next step for every action item.
This process creates accountability without turning monitoring into a full-time job. It also builds a useful operational history for capacity planning, troubleshooting, budgeting, and conversations with hosting providers or developers.
Avoid false precision in forecasting
Trend lines are evidence, not promises. Workloads change, cleanup jobs run, new customers arrive, and application releases alter behavior. Use forecasts as planning ranges rather than exact dates. “Storage may cross our safety margin in four to six weeks” is more honest and useful than claiming a precise failure time.
When a trend changes suddenly, investigate the cause before extending the line. The objective is early attention, not mathematical certainty. Even a rough but well-explained direction can provide enough lead time to prevent rushed maintenance.
Make historical monitoring useful to the whole business
Developers need enough technical detail to investigate, while business owners need to understand urgency and impact. A good report serves both audiences: it names the affected system, shows the direction, explains the likely consequence, and recommends a next action. Raw telemetry can stay available for deeper analysis without dominating the weekly summary.
DMCloud Architect helps small teams turn Linux, MySQL, storage, backup, and performance history into clear weekly decisions without dashboard fatigue. For practical reporting that shows what is stable, what is drifting, and what needs attention, visit Infrastructure Health Reporting.