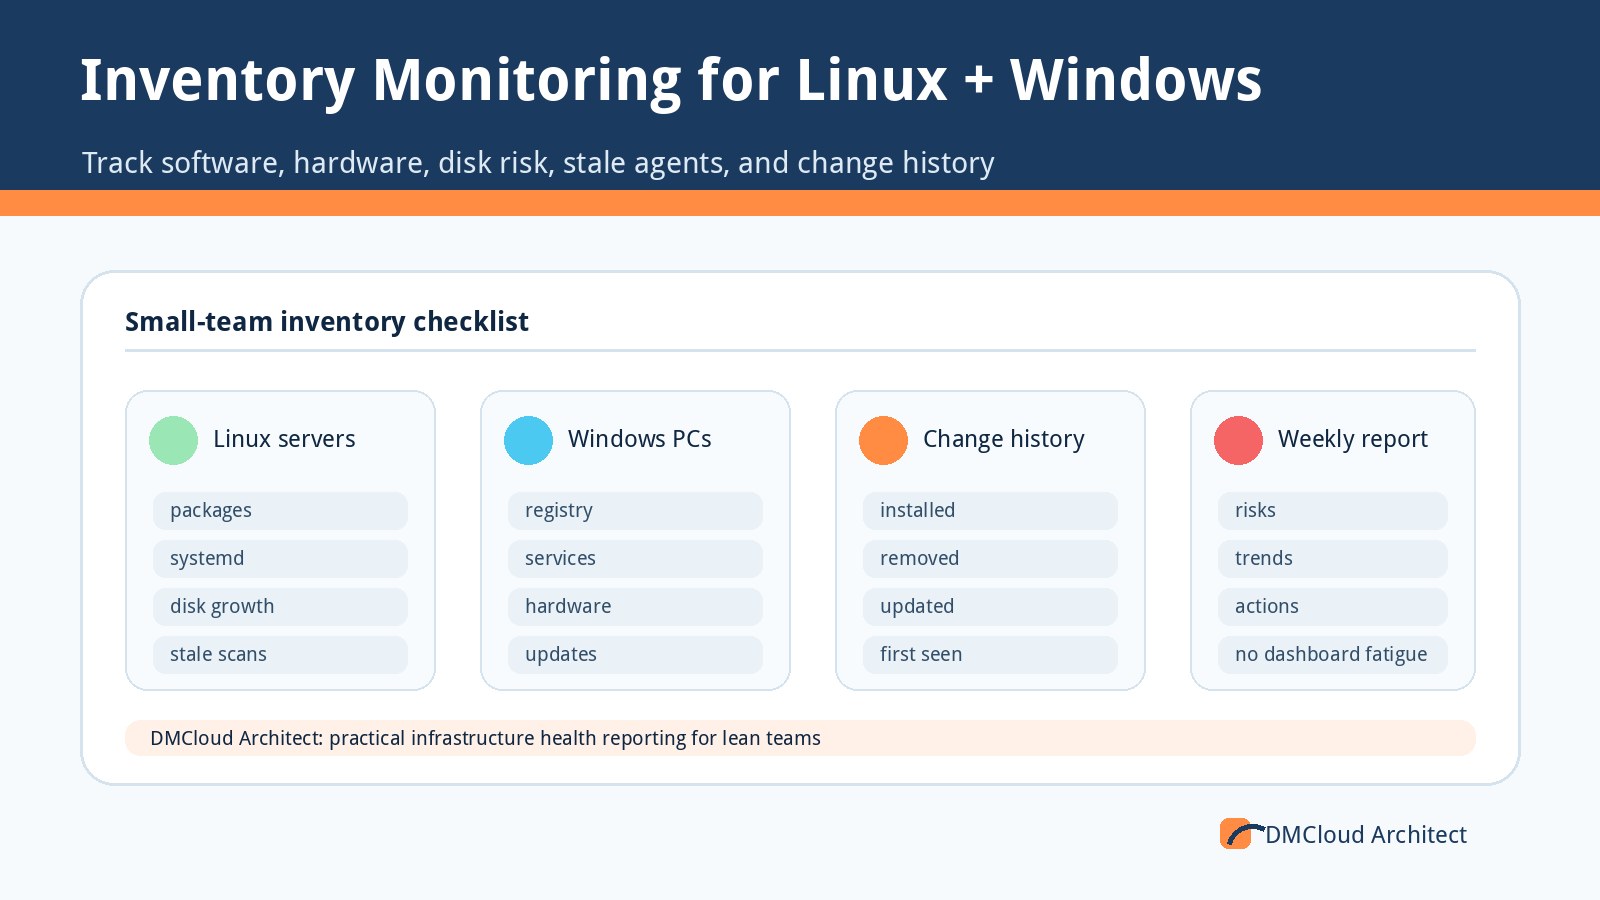
Inventory monitoring sounds simple until a small team has to answer practical questions across real Windows and Linux machines: what is installed, what changed, which disks are filling up, which devices stopped reporting, and whether anyone noticed before the next support call. That is why asset inventory belongs beside linux server monitoring, not in a forgotten spreadsheet.
For developers and small business owners, the right tool is not necessarily the biggest dashboard. It is the system that reliably shows useful changes, keeps agent overhead low, and turns inventory data into decisions. Use this checklist when building, buying, or evaluating software and hardware tracking for a mixed environment.
1. Start with the operating questions, not the feature list
A good inventory system should answer operational questions quickly. If it only collects a long list of packages and hardware facts, it will become another database nobody opens.
- What changed since the last scan? Installed, removed, and updated packages are more useful than a static list.
- Which machines are drifting? Compare versions across similar servers, desktops, or app nodes.
- Which machines stopped reporting? Stale agents often reveal powered-off systems, broken services, network issues, or retired devices that were never documented.
- Which disks need attention? Capacity and free-space trends should be visible without clicking through every host.
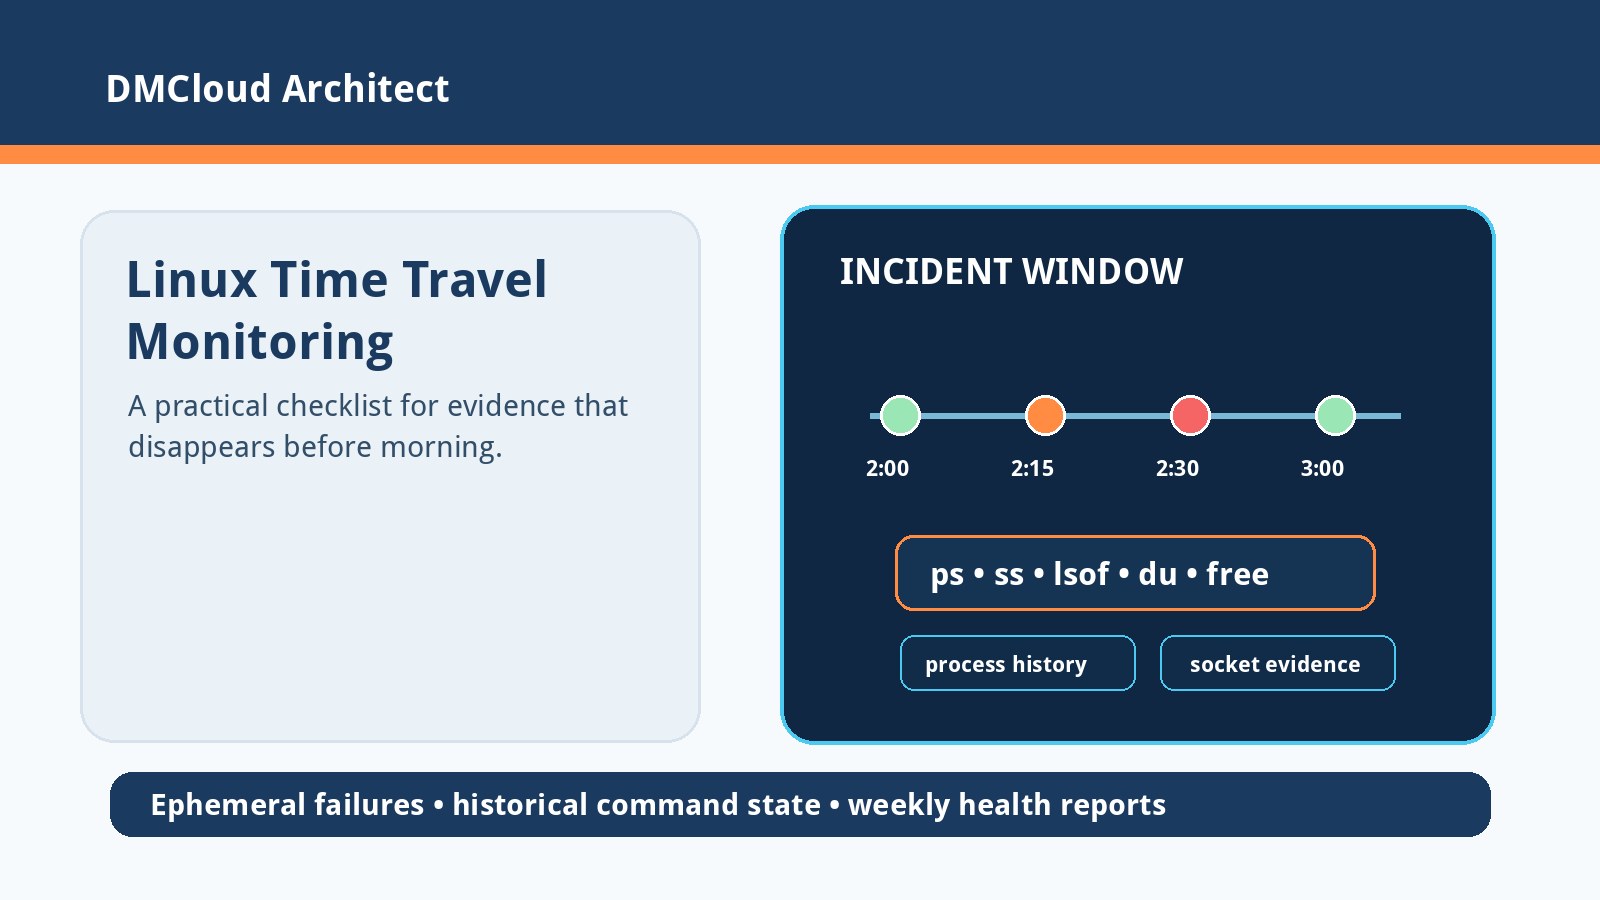
- What changed before the incident? A package update, driver change, service restart, or hardware difference can explain failures that raw CPU graphs miss.
If the product answers those questions clearly, it is already more valuable than a feature-heavy dashboard with no change narrative.
2. Treat Windows and Linux as different collection problems
Cross-platform inventory is useful, but Windows and Linux expose software data differently. The tool should normalize the result without hiding where each fact came from.
- Windows: Registry uninstall keys, WMI/CIM, services, drivers, installed updates, and vendor metadata can disagree. Show source and confidence.
- Linux: dpkg, rpm, pacman, Snap, Flatpak, manual installs, systemd services, kernel versions, and repo sources all matter in different ways.
- Containers and runtimes: Docker images, language package managers, and application dependencies may be more important than OS packages for some teams.
- Hardware: CPU, memory, disks, mount points, filesystem usage, serials, and virtualization details should be collected carefully and consistently.
The best experience is not pretending every platform is identical. It is making the differences searchable and easy to compare.
3. Make change history the core value
Most teams do not need to read an inventory report every day. They need to know when something meaningful changed and whether that change lines up with a problem.
- Record first seen, last seen, installed, removed, and updated timestamps.
- Group related changes into a scan summary instead of flooding users with one alert per package.
- Keep enough history to compare before and after deployments, patch windows, and incidents.
- Highlight unusual changes, such as a database server gaining unexpected desktop software or a production host missing a security update.
- Keep raw inventory available, but lead with a human-readable delta.
This is where inventory and monitoring overlap. A dashboard shows current state; change history explains why the current state may have become risky.
4. Decide when alerts are useful and when reports are better
Small teams often suffer from alert fatigue. Inventory systems can make that worse if every package update becomes urgent. Separate immediate alerts from scheduled review.
- Alert immediately for stale reports, offline agents on important servers, critical disk thresholds, failed scans, and high-risk unauthorized software.
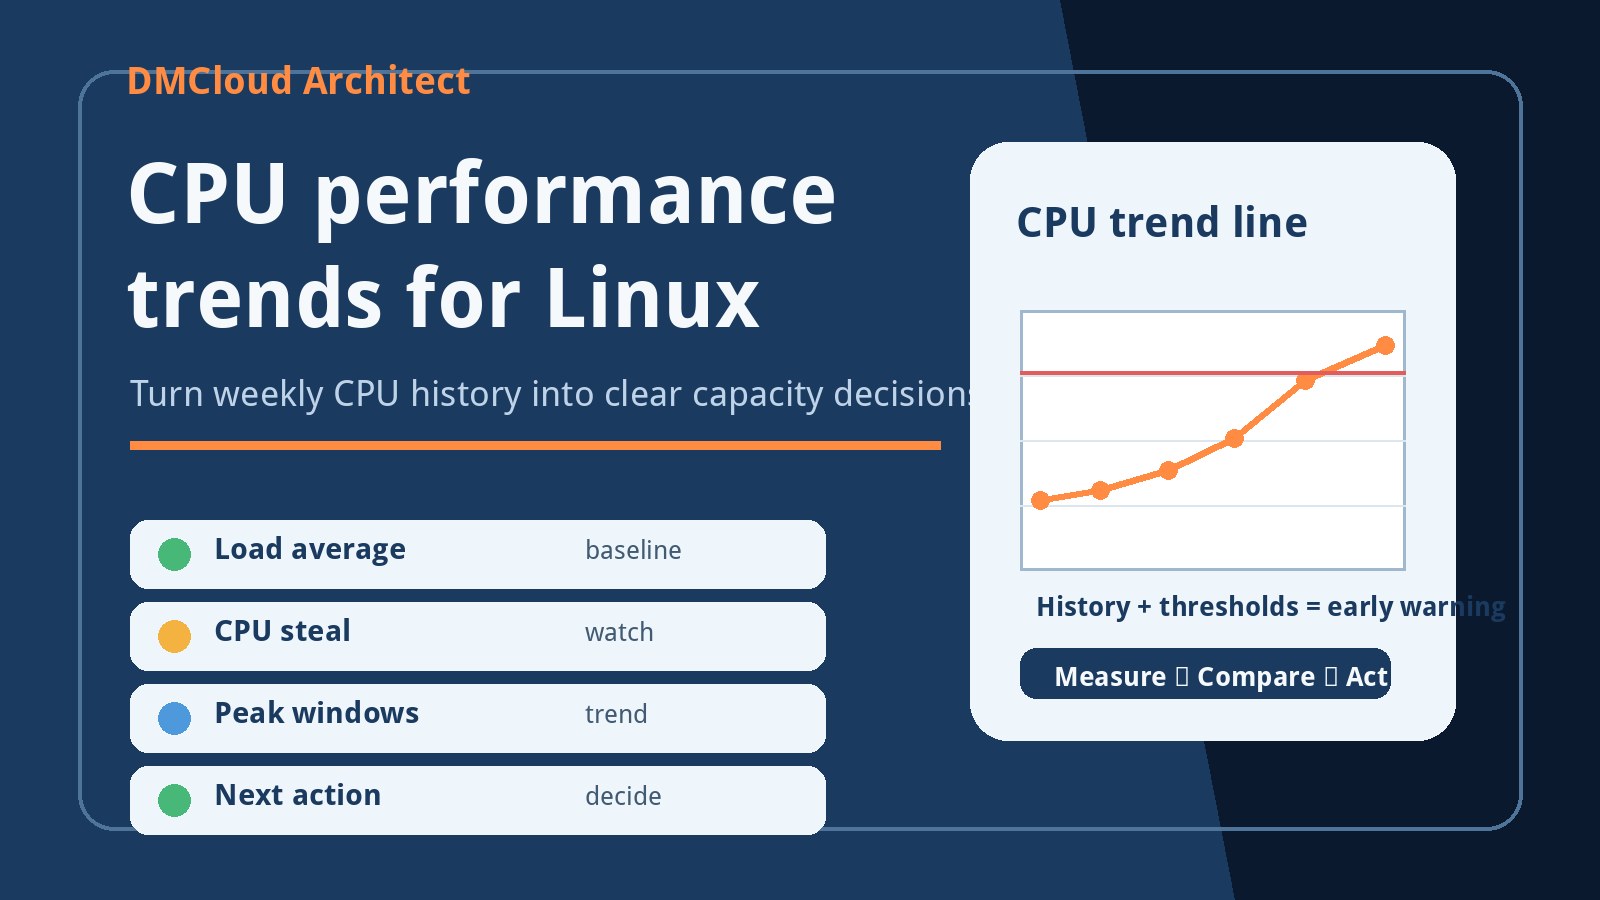
- Report weekly on package drift, OS versions, disk growth, service status, hardware changes, and low-priority cleanup items.
- Review monthly for licensing, lifecycle planning, replacement cycles, and machines that should be retired.
For many small businesses, a weekly infrastructure health report is more practical than another live dashboard. It keeps the signal visible without demanding constant attention.
5. Keep the agent boring, safe, and observable
An inventory agent should be boring software. It should start reliably, scan predictably, explain failures, and avoid surprising administrators with heavy resource use.
- Run as a normal service: systemd on Linux and Windows Service on Windows.
- Expose agent version, last scan time, last successful upload, last error, and scan duration.
- Throttle expensive scans and avoid repeated full inventory collection when a lightweight delta is enough.
- Fail safely when the server is unreachable; retry with backoff rather than consuming CPU or disk.
- Measure the agent itself: CPU, memory, disk writes, and network volume should be visible.
Trust is earned through predictable behavior. If an agent becomes the source of performance problems, teams will remove it even if the data is useful.
6. Be careful with remote commands
Remote scan, restart, and uninstall features are convenient, but they change the security model. Build approval, audit, and scope controls before treating remote actions as routine.
- Require explicit permissions for each remote action type.
- Log who requested the action, when it ran, which host it targeted, and the result.
- Protect production servers from bulk actions unless there is a deliberate maintenance window.
- Prefer safe commands first: rescan, refresh inventory, restart agent, and collect diagnostics.
- Make uninstall reversible only through normal deployment tooling, not a casual dashboard click.
For small teams, remote control can save time. It can also create outages if the tool makes powerful actions too easy.
7. Use categories and AI as helpers, not authority
Automatic software categorization can make reports easier to scan, especially when package names are cryptic. But it should never be the only source of truth.
- Show the original package name, version, publisher, source, and install path alongside any category.
- Let users correct categories and preserve those corrections.
- Flag uncertainty instead of presenting every AI label as fact.
- Use categories for summaries, filtering, and prioritization, not compliance decisions without review.
AI can reduce reading time, but operations teams still need auditable facts when they investigate a machine.
8. Connect inventory to practical linux server monitoring
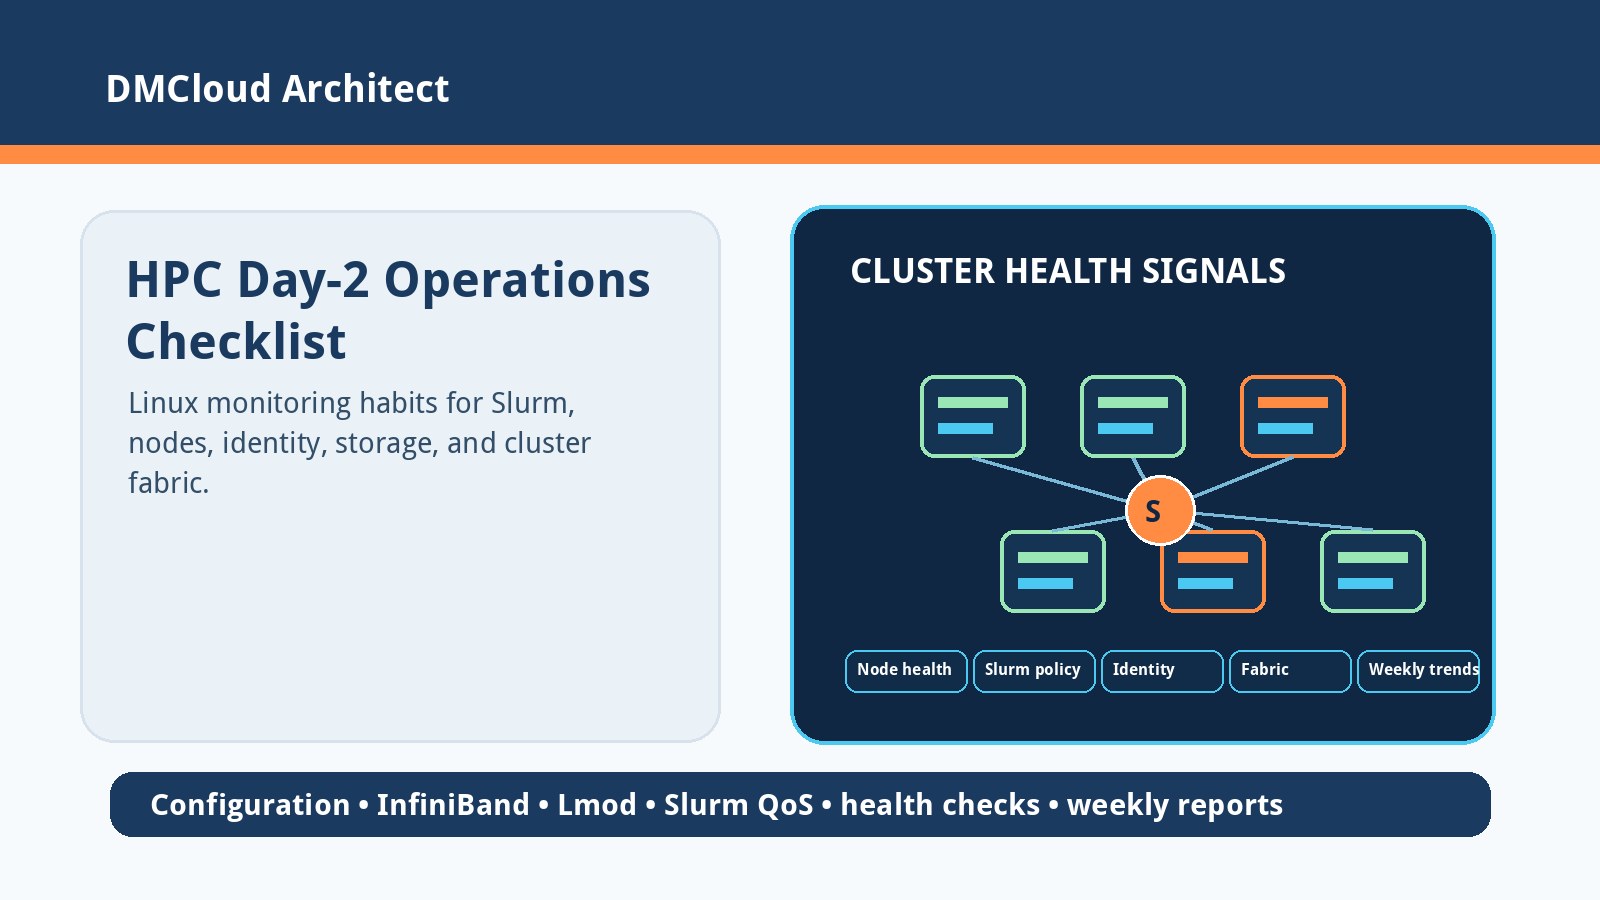
Inventory should not sit apart from monitoring. On Linux servers, software and hardware facts become more useful when they are connected to health signals.
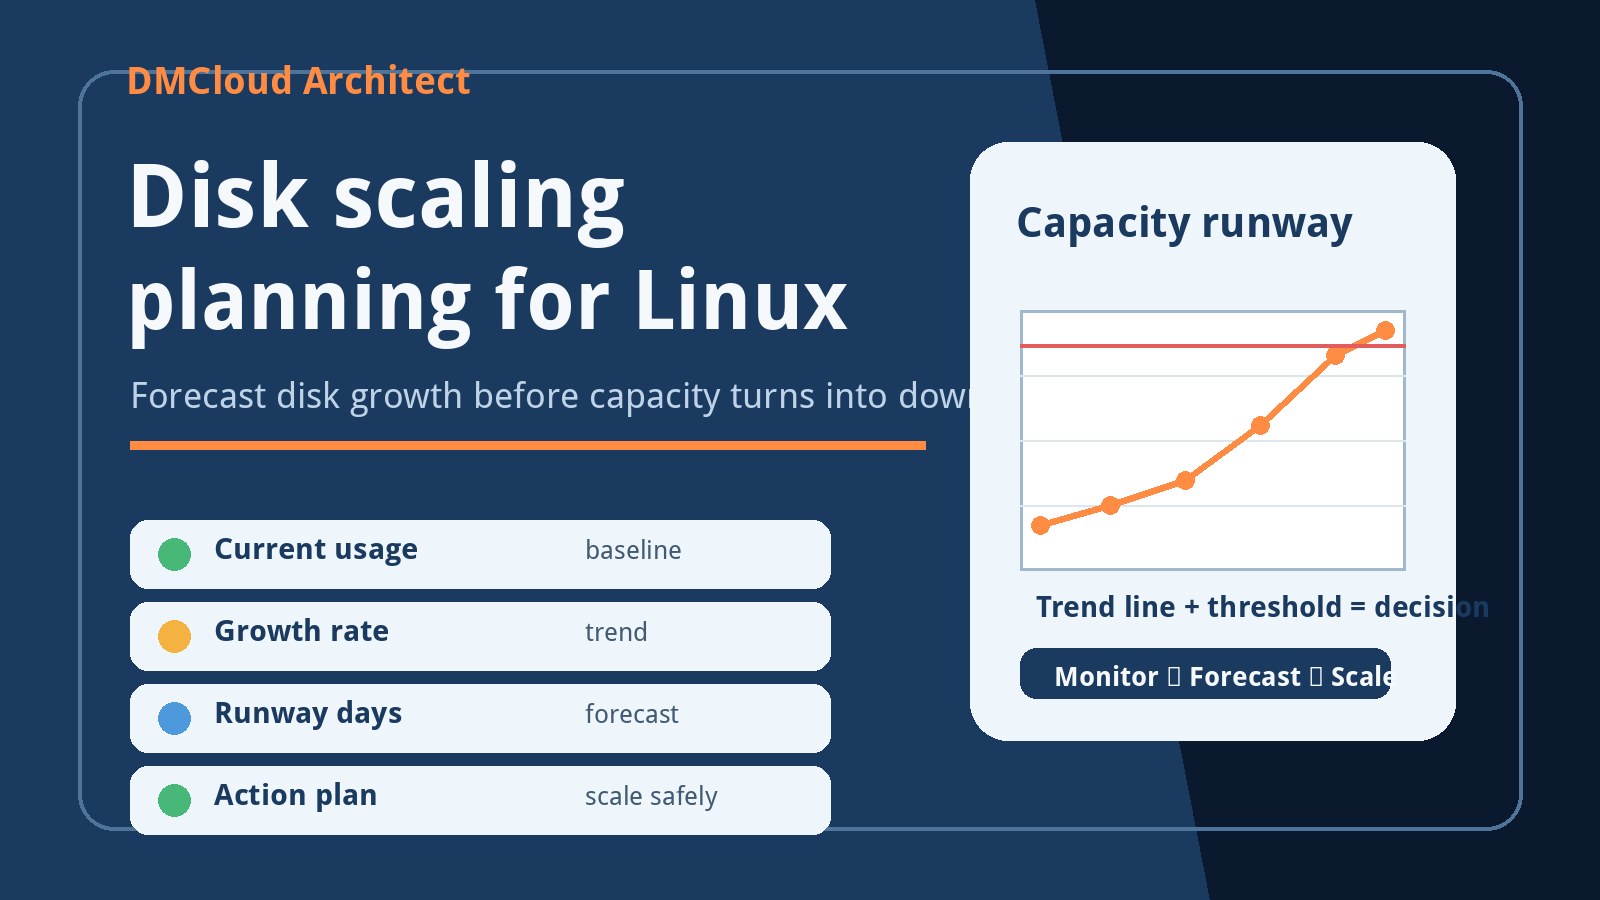
- Disk capacity should be tracked with growth rate, not only free space at scan time.
- Package and kernel changes should be visible beside uptime, reboots, and service failures.
- Database servers need extra context: MySQL service status, backup age, disk pressure, and slow growth trends.
- Stale scan reports should be treated as a monitoring signal, because silent hosts create blind spots.
- Weekly summaries should call out what changed, why it matters, and what to do next.
This is the difference between an asset list and an operations tool. The inventory tells you what exists; monitoring tells you whether it is healthy.
9. A simple evaluation checklist
Before adopting or building an inventory tool for a small mixed environment, test it against these questions.
- Can it show installed, removed, and updated software between two scans?
- Can it handle Windows and Linux sources without hiding important differences?
- Can it identify stale agents and offline systems clearly?
- Can it report disk capacity, free space, and growth trends?
- Does it avoid alerting on every low-value change?
- Are remote actions permissioned, logged, and safe by default?
- Can you export or review a weekly summary without living in the dashboard?
- Does it improve your existing linux server monitoring instead of duplicating it?
If the answers are yes, the approach makes sense for a small number of machines. If the answers are no, start smaller: collect reliable host facts, track changes, add stale-report alerts, and send a weekly health summary before building a complex command center.
Want weekly Linux and MySQL health checks without dashboard fatigue?
DMCloud Architect sends weekly infrastructure health reports to your inbox, highlighting linux server monitoring signals like disk growth, uptime, service failures, package drift, database pressure, and practical next steps.
Get the free starter plan for weekly infrastructure health reports.