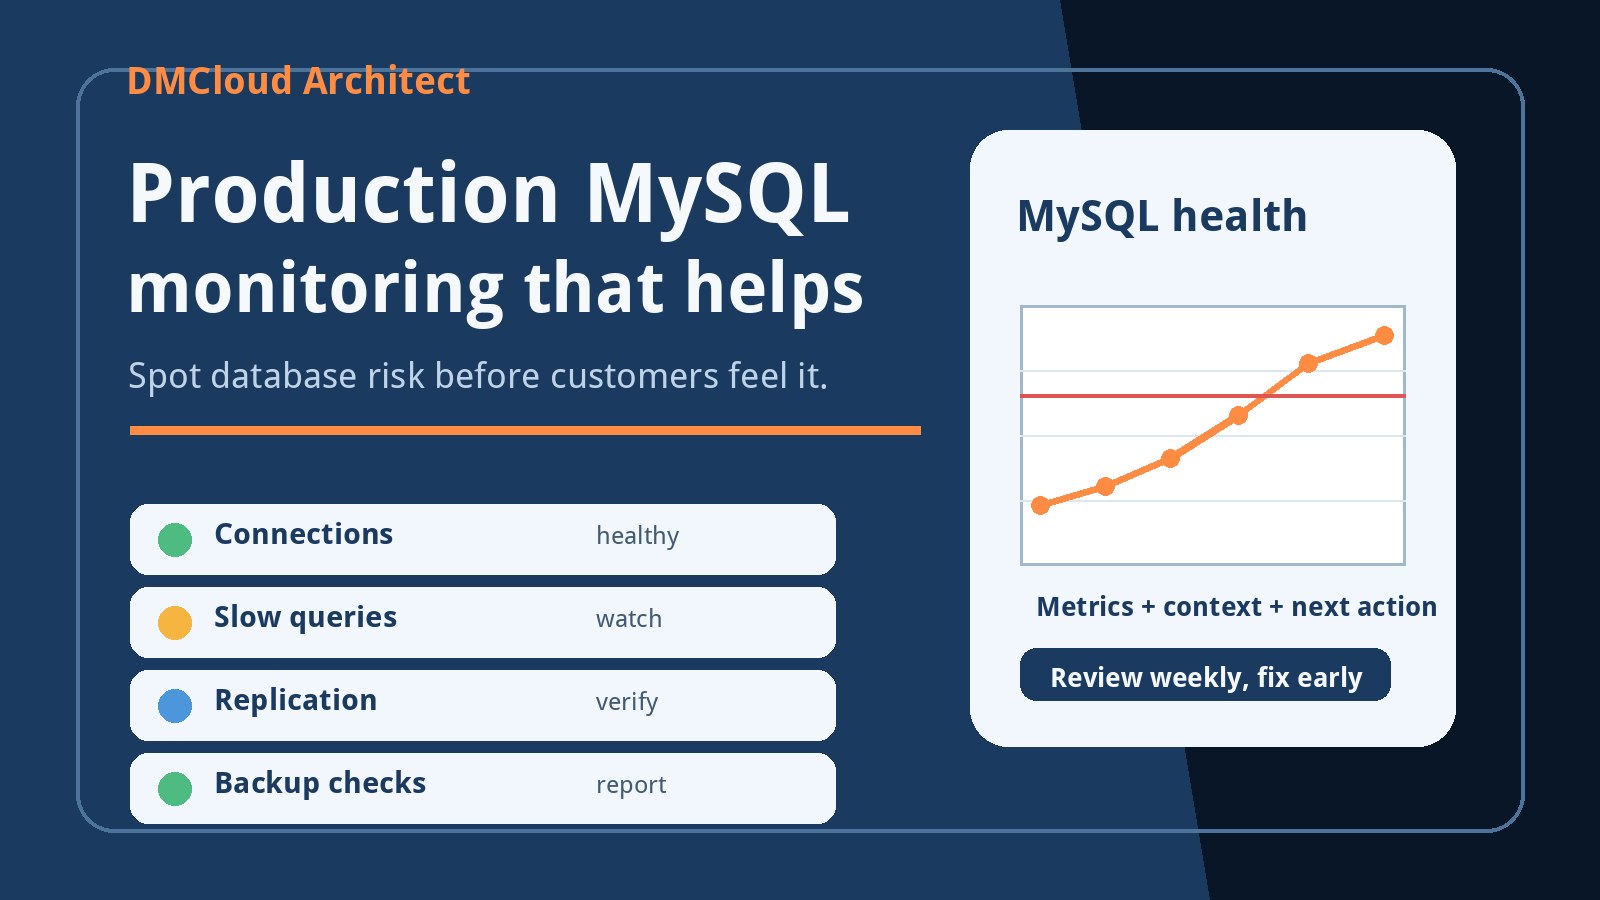
Production databases rarely fail at a convenient time. More often, MySQL starts sending quiet warning signs first: connection counts creep up, slow queries become normal, disk space falls faster than expected, or backups complete later than they used to. A practical mysql monitoring production routine helps developers and small business owners notice those patterns before they turn into support tickets.
The point is not to build another wall of dashboards. The point is to review the same useful signals every week, compare them with recent history, and leave each report with a clear next action. If MySQL is stable, the action may be "no change." If a trend is moving the wrong way, the team can tune, clean up, resize, or investigate while there is still breathing room.
Start with the questions production monitoring should answer
Good MySQL monitoring starts with business-facing questions, not just metrics. Can the application connect reliably? Are pages or background jobs getting slower? Is storage healthy? Are backups recent and restorable? Is replication keeping up? Are there obvious query or configuration problems that deserve attention this week?
When a report answers those questions plainly, it becomes useful to both technical and non-technical owners. Developers see where to investigate. Small business owners see whether the database is healthy, watching, or needs action.
Check connection usage and failed connection patterns
Connection counts are one of the easiest early warning signals. A growing number of active or sleeping connections can point to traffic growth, missing connection pooling, application bugs, long-running transactions, or jobs that do not close properly. A sudden spike can also explain why users see intermittent errors even if CPU and memory look acceptable.
Each weekly report should compare current connection usage with the configured maximum, recent peaks, and any failed connection messages. If the server is regularly close to its connection limit, increasing the limit may only hide the symptom. The better next step is to identify which application paths, workers, or integrations are holding connections open.
Review slow queries with enough context to act
Slow query volume matters, but the useful part is the pattern. A single expensive report may be acceptable if it runs once overnight. A query that runs thousands of times per day and gradually takes longer is a stronger production risk. MySQL performance monitoring should show the slowest repeated statements, how often they run, and whether their timing is getting worse.
Look for missing indexes, table scans on growing tables, queries that sort large result sets, and application changes that increased query frequency. The weekly action does not need to be dramatic. Sometimes the right action is to add one index, reduce a report date range, archive old rows, or schedule deeper query review before the next release.
Watch replication lag and background job pressure
If the environment uses replicas, replication lag belongs in every production MySQL checklist. Lag can make reports stale, break read-after-write assumptions, or hide a database that is working harder than expected. Even without replicas, background jobs can create similar pressure by competing with web traffic for database time.
Record whether replication is running, whether lag appeared, and whether the lag matched backups, imports, exports, or maintenance jobs. When the same job causes pressure every week, the fix may be scheduling, throttling, query tuning, or capacity planning rather than emergency troubleshooting.
Track storage, table growth, and binary logs
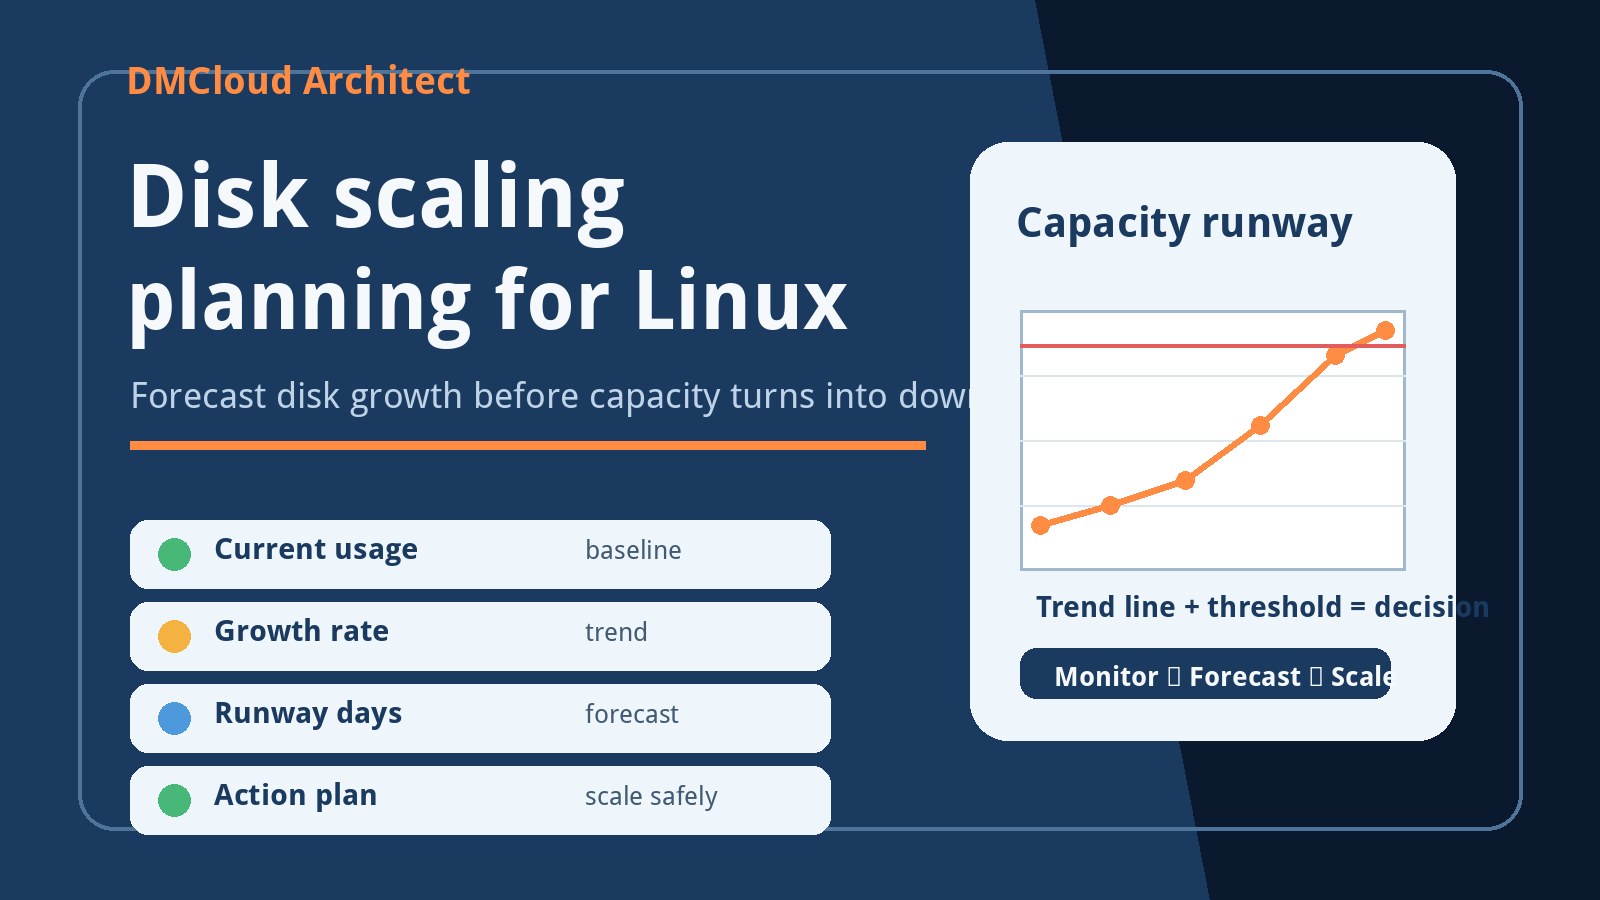
Disk problems are still one of the most avoidable database outages. Production MySQL monitoring should include free disk space, data directory growth, binary log growth, and unusually large tables. The important signal is not only how much space remains today, but how quickly it is being consumed.
If storage is declining faster than expected, check whether binary log retention changed, a table is growing unexpectedly, logs are not rotating, or a new feature is writing more data than planned. A weekly trend makes this visible early enough to clean up safely instead of deleting files during an incident.
Confirm backups are recent and believable
A backup timestamp is useful, but it is not the whole story. MySQL health reporting should confirm that backups ran, finished successfully, produced files of plausible size, and are still within the expected retention window. When possible, the report should also note whether restore testing is current.
This is where simple monitoring often fails. It may tell you that a backup job executed, but not whether the result is useful. A practical weekly review catches zero-byte files, stale backup directories, failed uploads, permissions changes, and jobs that now finish outside the maintenance window.
Include InnoDB and resource pressure signals
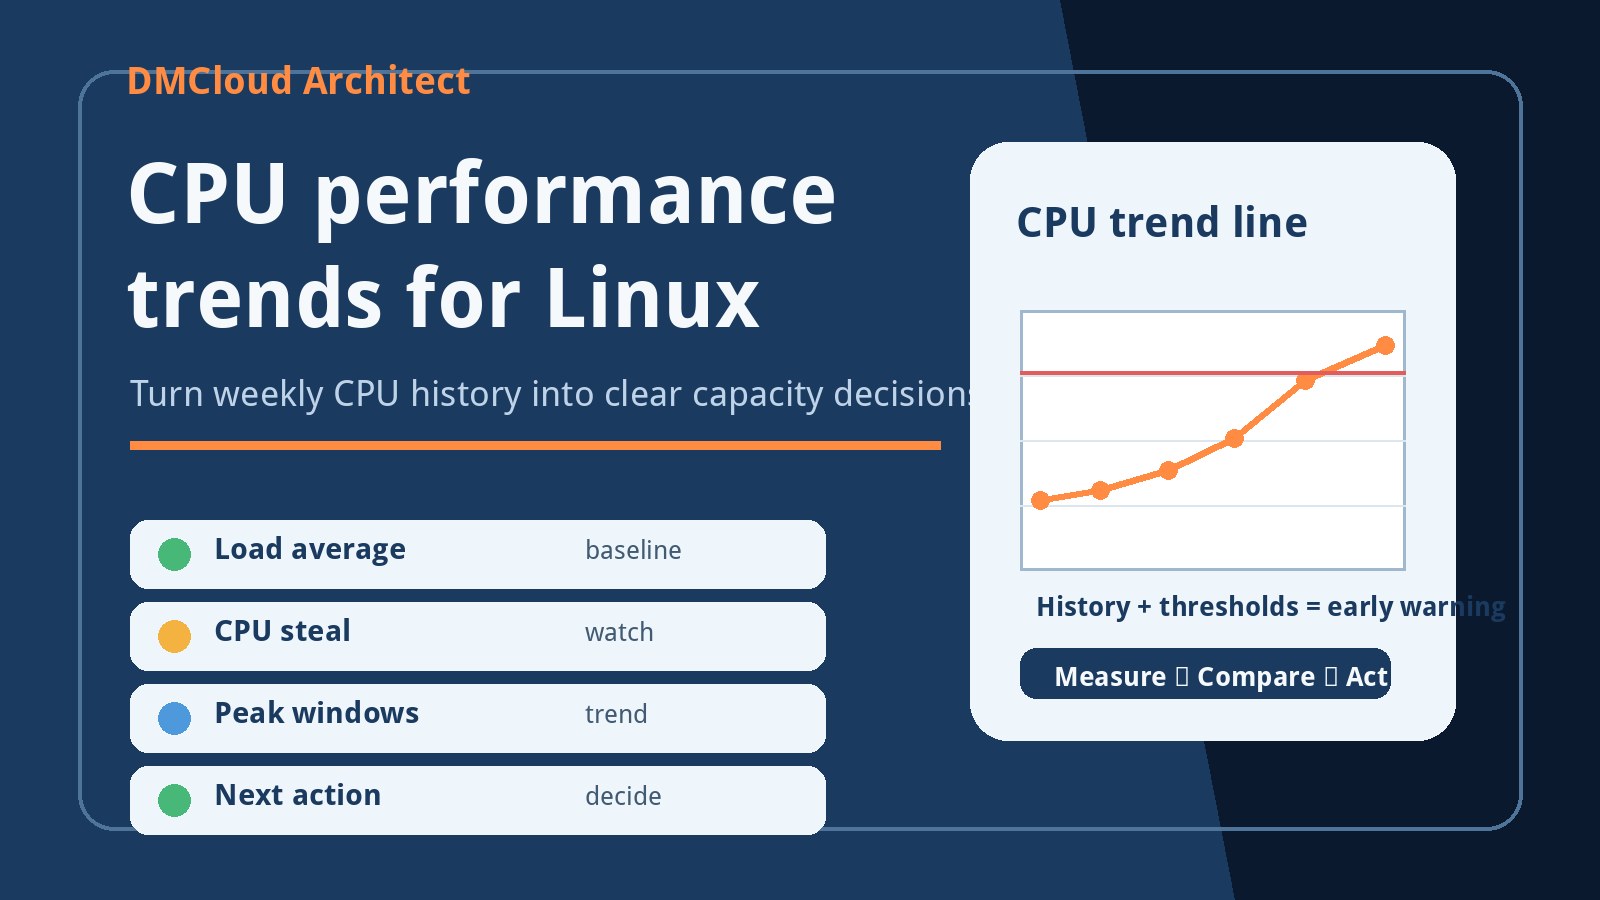
For many small production systems, a compact set of InnoDB and host-level checks is enough. Review buffer pool pressure, row lock waits, deadlocks, temporary table activity, CPU, memory, and I/O wait. These signals help separate database query problems from server resource limits.
If MySQL looks slow while CPU is low and I/O wait is high, storage may be the bottleneck. If CPU rises during specific queries, indexes or query design may be the next step. If memory pressure is high, configuration and workload growth deserve review before the operating system starts swapping.
Use simple status labels instead of vague alerts
Small teams do not need noisy alerts for every normal fluctuation. They need clear labels. Stable means the database is behaving like recent weeks. Watch means one or more signals are drifting and should be reviewed. Action needed means a trend is likely to affect users, backups, maintenance, or reliability if nobody responds.
Each label should include the reason. "Watch: slow queries increased after the new reporting job" is useful. "Warning: database metric high" is not. A useful report should connect the metric to the likely operational impact and the next recommended action.
A weekly MySQL monitoring checklist
For a practical weekly review, keep the checklist short enough that it actually gets used:
- Compare active, sleeping, failed, and peak connections with the configured maximum.
- Review the top repeated slow queries and whether their timing or frequency changed.
- Check replication status and lag if replicas are in use.
- Track data directory growth, binary logs, free disk space, and unusually large tables.
- Confirm backups completed, files look plausible, and retention is current.
- Review CPU, memory, I/O wait, swap, and storage pressure around database peaks.
- Record one next action when the status is watch or action needed.
Make monitoring useful without dashboard fatigue
The best MySQL server monitoring habit is consistency. Run the same checks, store the same summary, and compare the current week with the last several reports. Over time, that history becomes more valuable than any single snapshot because it shows what is normal for your application.
DMCloud Architect helps developers and small business owners review Linux, MySQL, backups, and server performance without dashboard fatigue. If you want weekly infrastructure health reporting that turns database signals into clear next steps, visit the Infrastructure Health Reporting page.