A tool that promises to monitor and manage every Linux system from one place sounds attractive, especially when a developer or small business owner is already switching between shell sessions, uptime checks, log files, and cloud consoles. The real question is not whether the interface can display many signals. It is whether the system produces trustworthy, actionable information when something changes.
Use this checklist to evaluate a new linux server monitoring platform, compare an open-source project with an established service, or decide what your own lightweight setup actually needs. The goal is not to collect every possible metric. It is to reduce operational uncertainty without creating a second system that demands constant attention.
1. Define the decisions the tool must support
Start with decisions, not screenshots or feature counts. A useful monitoring system should help you answer a short set of recurring operational questions.
- Is each important host reachable and reporting fresh data?
- Are CPU, memory, disk, and network conditions healthy for the workload?
- Did a critical service stop, restart unexpectedly, or begin failing?
- Which condition changed since the last healthy period?
- What needs action now, and what can wait for a weekly review?
- Can another person understand the evidence without reconstructing the incident from raw logs?
If a platform cannot answer these questions clearly, adding more charts will not make it operationally useful. Write down the five or six decisions your team makes most often and test the product against those decisions.
2. Check the host-health fundamentals
Every candidate should collect the basics reliably. Coverage matters, but freshness, units, labels, and history matter just as much.
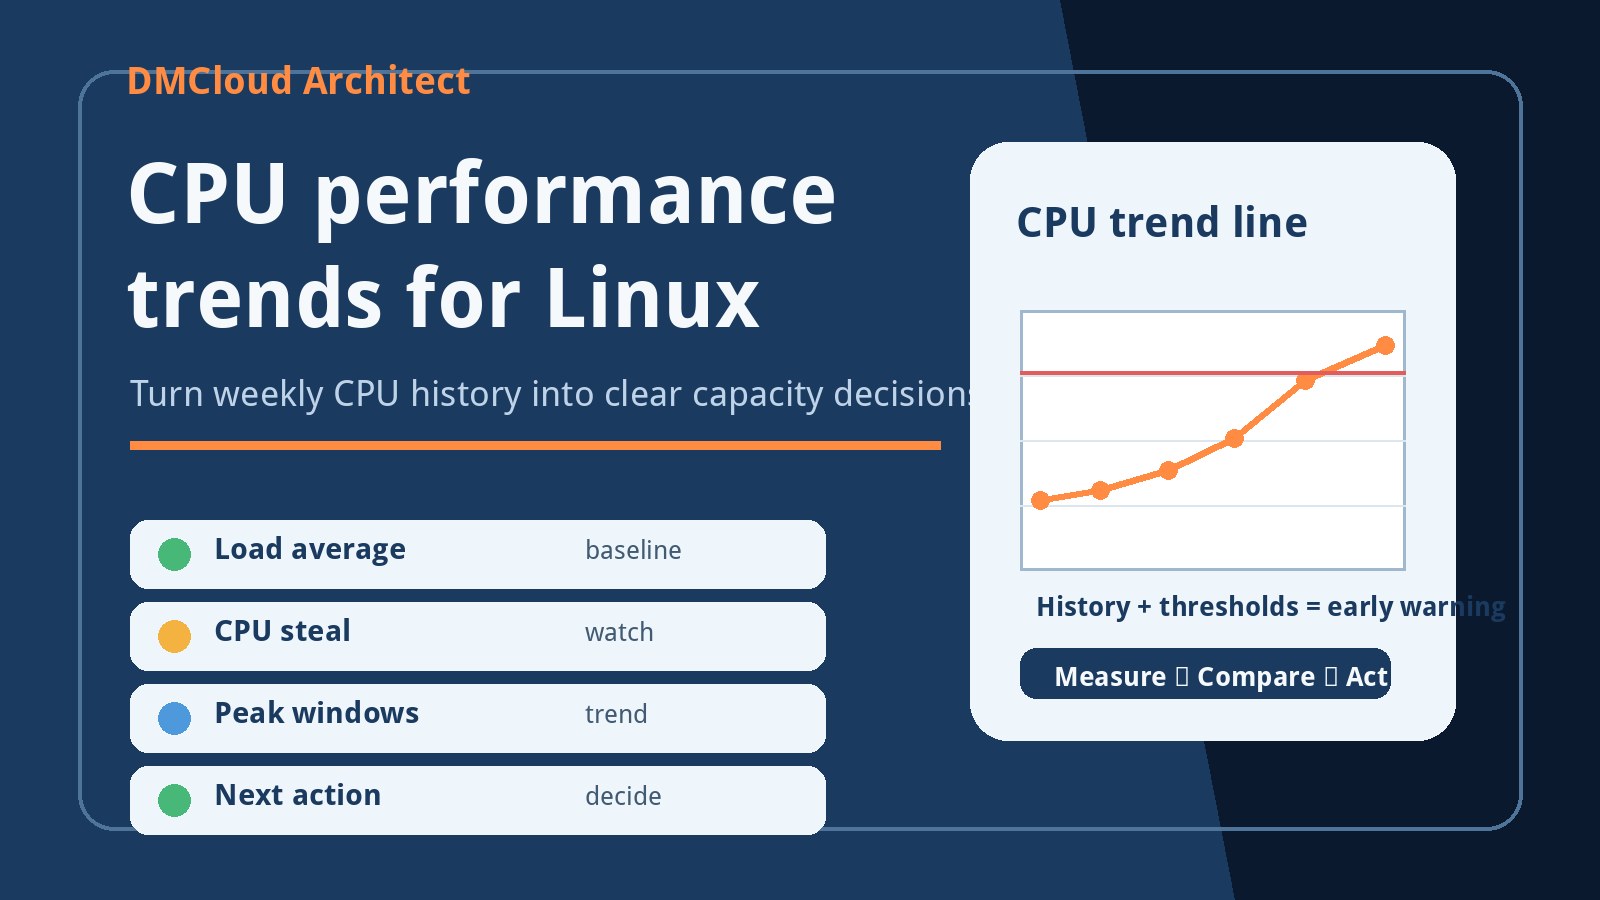
- CPU: utilization, load average, saturation, steal time on virtual machines, and sustained trends rather than isolated spikes.
- Memory: available memory, swap activity, pressure, and out-of-memory events instead of a simplistic percentage-used warning.
- Disk: free space, inode usage, filesystem errors, I/O latency, and capacity growth by mount point.
- Network: interface state, errors, dropped packets, throughput changes, and basic reachability.
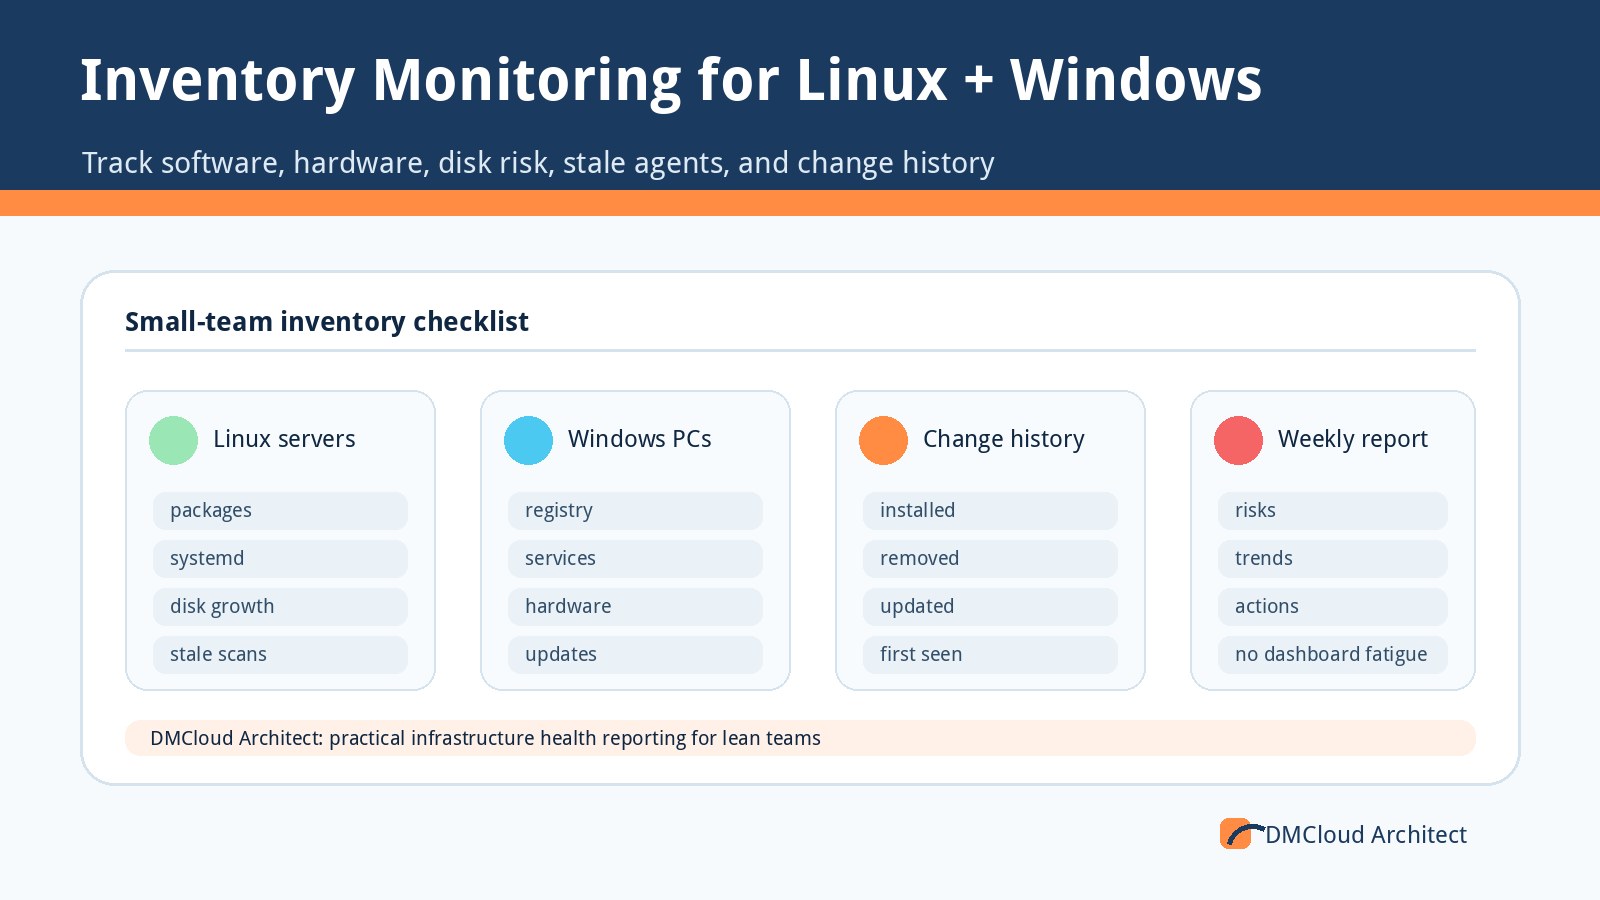
- System: uptime, reboot history, kernel version, clock synchronization, pending updates, and recent package changes.
During a trial, disconnect an agent, fill a test filesystem, stop a service, and create a brief CPU load. Confirm that timestamps and recovery states are accurate. A polished dashboard is less important than knowing the data can be trusted.
3. Evaluate service monitoring, not only machine monitoring
A server can look healthy while the application is unavailable. Good Linux server monitoring connects host metrics with service and application state.
- Track systemd units that matter and distinguish inactive, failed, restarting, and intentionally disabled states.
- Test the real endpoint where possible: an HTTP response, database connection, queue depth, certificate expiry, or expected process behavior.
- Record restart counts and recent failure messages so a flapping service does not appear healthy between restarts.
- Allow different checks for web servers, MySQL hosts, backup nodes, development machines, and scheduled jobs.
- Show dependencies when practical, such as an application failure caused by a full database volume.
For a small team, a short list of carefully chosen service checks is better than automatically monitoring every process. The system should reflect what customers and internal users actually depend on.
4. Confirm that history explains change
Current-state views help during an outage, but history helps prevent the next one. The platform should preserve enough context to show slow drift and meaningful configuration changes.
- Can you compare this week with last week without exporting data manually?
- Does it show disk growth, memory pressure, and load trends over useful time windows?
- Can you see when a package, kernel, service definition, or monitored threshold changed?
- Are maintenance windows and deployments visible beside the metrics?
- Does retention match your planning cycle, or will the evidence disappear before quarterly review?
Slow-moving problems are common in small environments: a backup directory grows, query volume rises, a certificate approaches expiry, or one node accumulates more work than its peers. Trend history should make those patterns obvious before they become incidents.
5. Test alert quality under realistic conditions
Alerting is where many monitoring projects lose trust. A tool that notifies on every threshold crossing teaches people to ignore it.
- Require persistence or multiple failed checks before sending routine alerts.
- Group related symptoms so one disk problem does not create ten separate messages.
- Include the host, service, observed value, duration, likely impact, and a useful next step.
- Suppress expected noise during maintenance while preserving an audit trail.
- Send a clear recovery message and avoid repeatedly reopening the same incident.
- Separate urgent interruption-worthy events from items suitable for a daily or weekly report.
A practical trial should include a controlled failure and recovery. Count how many notifications arrive and whether each one helps someone make a decision. Fewer, better alerts are usually more valuable than broad notification coverage.
6. Inspect agent safety and operational overhead
An agent or collector becomes production software the moment you install it on a production host. Treat its behavior as part of the evaluation.
- Measure CPU, memory, disk writes, and network usage during normal collection and reconnect attempts.
- Confirm how it starts, updates, rolls back, and reports its own version and health.
- Check whether collection commands have timeouts and whether failed uploads use sensible backoff.
- Review package sources, release signing, dependency footprint, and supported distributions.
- Verify that uninstalling the agent is clean and does not remove unrelated system configuration.
The ideal collector is boring: predictable resource use, transparent configuration, useful logs, and no surprising privileges. If the monitoring agent becomes a source of instability, its feature list no longer matters.
7. Review authentication, authorization, and data handling
A unified management platform may have broad visibility and powerful control over every enrolled server. That makes security architecture a core requirement rather than an optional enterprise feature.
- Use encrypted transport and verify how agents authenticate the server and rotate credentials.
- Require individual accounts, strong authentication, and role-based access for administrators and viewers.
- Check whether secrets, command output, environment variables, log content, or personally identifiable data can be collected unintentionally.
- Review retention, backup, export, and deletion behavior for both metrics and logs.
- Confirm that audit records show logins, configuration changes, remote actions, and permission changes.
- Understand where data is stored and what still works if the central service becomes unavailable.
Open source makes code review possible, but public source alone does not guarantee a secure deployment. Evaluate defaults, release practices, dependencies, and your own hosting configuration.
8. Put strict guardrails around remote management
Remote shell, package installation, service restart, and file-management features can save time, but they also increase the blast radius of a compromised account or mistaken click.
- Disable powerful actions by default and enable only those the team genuinely needs.
- Separate read-only monitoring permissions from operational control.
- Require confirmation or approval for high-impact commands and multi-host actions.
- Record who requested each action, the exact target, start and finish times, exit status, and output.
- Support host groups and environment boundaries so development actions cannot spill into production.
- Define an independent emergency access path in case the monitoring platform is down.
Many small teams are better served by monitoring plus links to existing SSH, configuration management, or deployment workflows. A single console is convenient, but convenience should not erase separation of duties.
9. Verify deployment, backup, and failure behavior
Self-hosted monitoring has its own operational cost. Before adopting a platform, understand what it takes to keep the monitoring system healthy.
- Document installation, upgrades, schema migrations, backup, restore, and disaster recovery.
- Confirm whether the central service can be upgraded without losing incoming data.
- Test what agents do when the server is unreachable and how long they buffer results.
- Monitor the monitoring platform's database, storage growth, certificate expiry, and scheduled jobs.
- Estimate monthly maintenance time, not only hosting cost.
A simple platform that can be restored confidently is safer than a sophisticated stack nobody knows how to rebuild. Ask one person who did not install it to follow the recovery notes in a test environment.
10. Decide whether reporting fits the way your team works
Real-time dashboards are useful during investigation, but many developers and owners do not need to watch infrastructure all day. The system should deliver a concise view at the right rhythm.
- Lead with changes, risks, and recommended actions rather than a wall of averages.
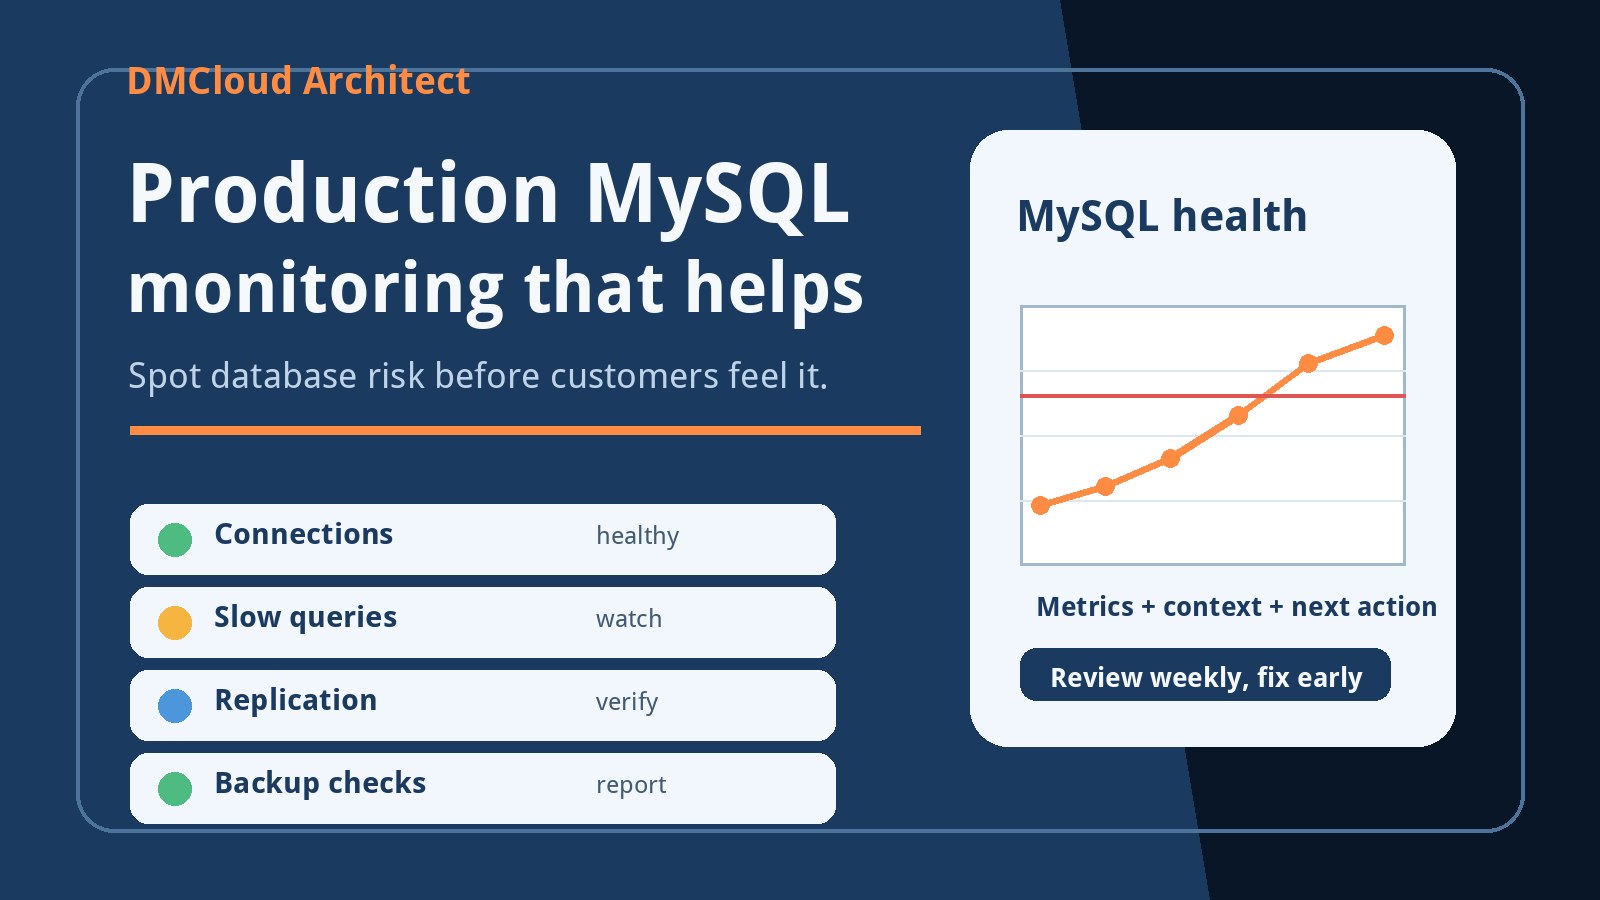
- Show sustained CPU load, memory pressure, disk growth, service failures, backup age, and database concerns.
- Distinguish urgent items from observations and capacity-planning notes.
- Include enough evidence to verify each finding without requiring a dashboard login.
- Make reports readable by both the technical operator and the business owner responsible for priorities.
Weekly reporting is particularly useful for slow drift and preventative work. It complements immediate alerts instead of replacing them: urgent failures still interrupt the right person, while developing risks receive structured attention without alert fatigue.
11. Run a two-week proof of value
A short proof of value reveals more than a feature comparison. Choose a small but representative group: one application host, one database host, and one less-critical server.
- Write down the questions and failure scenarios before installation.
- Measure deployment time, agent overhead, and required privileges.
- Trigger safe test conditions for disk, CPU, service failure, stale reporting, and recovery.
- Review alert volume and usefulness with everyone who receives notifications.
- Check whether the history explains what happened without relying on memory.
- Produce one weekly summary and identify the decisions it caused.
- Estimate ongoing upgrade, backup, and tuning work.
At the end, keep the tool only if it reduces uncertainty or manual work. A promising project can still be the wrong operational fit if it needs more care than the systems it monitors.
12. Use a simple final scorecard
Score each area from zero to two: zero means missing, one means usable with work, and two means reliable for your environment.
- Host-health coverage and data freshness
- Service and application checks
- Trend history and change context
- Alert quality and recovery handling
- Agent safety and resource overhead
- Authentication, authorization, and auditability
- Remote-management guardrails
- Deployment, backup, and restore confidence
- Weekly reporting and decision support
- Total maintenance burden
Do not hide a critical security or recovery gap inside a strong total score. Mark non-negotiable requirements separately. The best choice is the smallest trustworthy system that covers your real risks and fits the time your team can commit.
Want weekly Linux and MySQL health checks without dashboard fatigue?
DMCloud Architect turns infrastructure signals into a practical weekly report, highlighting capacity drift, service risks, database concerns, and recommended next steps without asking you to watch another dashboard.
Get the free starter plan for weekly infrastructure health reports.