A server can appear healthy because a website still loads while trouble builds underneath. Disk usage may be climbing, a backup may have stopped, memory pressure may be increasing, or an important service may be restarting every few hours. Regular linux server health checks turn those quiet signals into a short list of actions before customers notice.
For developers and small business owners, the most useful routine is not a giant dashboard. It is a repeatable review of availability, capacity, services, logs, security, and recovery. Run it on a consistent schedule, keep a small amount of history, and investigate changes rather than treating every isolated number as an emergency.
Begin with context, not commands
Before checking metrics, record what the server does and what changed since the previous review. Note deployments, traffic campaigns, imports, operating system updates, new scheduled jobs, and expected growth. A load increase after a planned data import means something different from the same increase on an otherwise quiet week.
Also define the server's normal operating pattern. A four-core host can tolerate short bursts that would look alarming on a one-core virtual machine. A file server may grow steadily, while an application server should not. Context keeps simple Linux monitoring useful and prevents normal behavior from becoming alert noise.
Confirm uptime and recent restarts
Start by checking whether the server is reachable and whether it restarted unexpectedly. The uptime command shows current uptime and load averages. On systemd systems, last reboot and journalctl --list-boots help confirm when restarts occurred. Compare those times with approved maintenance windows.
An unexpected restart deserves follow-up even if everything is currently online. Review the previous boot with journalctl -b -1, provider events, kernel messages, and application recovery behavior. The goal is to understand whether the restart came from planned patching, a cloud event, resource exhaustion, a kernel problem, or a manual action.
Read CPU load in relation to capacity
Load average is useful only when compared with CPU count and workload. Review uptime, nproc, and a process view such as top or ps. Sustained load around or above available CPU capacity can indicate contention, but high load can also come from tasks waiting on storage rather than consuming CPU.
Look at the processes responsible and compare the current result with prior weeks. A recurring compression job may cause a harmless short spike. A web worker that now uses twice as much CPU after each deployment is a trend worth investigating. Historical comparison is often more actionable than a single threshold.
Check memory pressure, swap, and the OOM history
Use free -h to review available memory and swap usage, but do not treat low "free" memory alone as a fault because Linux uses spare RAM for cache. Focus on available memory, sustained swap activity, application growth, and whether the kernel has killed processes. Commands such as vmstat 1 5 can reveal active swapping during a short sample.
Search the journal for out-of-memory events and confirm that important services have not been killed or repeatedly restarted. If memory use rises week after week, identify which process is growing before simply adding RAM. The cause may be a memory leak, an oversized cache, too many workers, an unbounded queue, or legitimate business growth.
Review disk capacity, inodes, and growth rate
Disk failures are among the most preventable Linux incidents. Check filesystem usage with df -h and inode usage with df -i. A filesystem can have free bytes but still fail to create files when it runs out of inodes, especially when an application produces many small cache, session, or log files.
Record both current usage and change since the previous report. When a filesystem is growing, identify the source with tools such as du while avoiding unnecessary scans across mounted or sensitive paths. Common causes include unrotated logs, stale releases, container layers, database files, backups stored locally, and temporary exports.
Capacity planning should use time remaining, not only percentage used. Eighty percent full may be stable for months, while sixty percent full can be urgent if usage grew ten percent in a week. A weekly trend gives a small team time to clean up safely, change retention, or expand storage before emergency work is required.
Verify filesystem and storage health
Capacity is only one part of storage health. Review kernel logs for I/O errors, filesystem warnings, read-only remounts, and device resets. If the platform exposes disk or volume health information, include it in the review. On virtual cloud storage, check provider events and volume performance limits as well as guest metrics.
For database and application servers, rising I/O wait may explain slowness even when CPU usage looks modest. If iostat is installed, use it to inspect device utilization and latency. Treat one short sample as a clue, then correlate it with application response times, maintenance tasks, and historical behavior.
Check critical services and restart patterns
A basic systemctl --failed check can reveal failed units, but a healthy report should also verify the services that matter to the business. That might include a web server, application process, database, queue worker, scheduler, backup agent, and monitoring collector. Confirm both process state and functional response.
A service marked active is not proof that it works. Test a local health endpoint, make a database connection, or perform a read-only application check where appropriate. Review restart counters and recent logs. A service that automatically restarts every night can remain technically active while hiding a real reliability problem.
Inspect logs for new patterns
Logs are most useful when reviewed for change. Look for repeated authentication failures, application exceptions, timeout messages, database connection errors, certificate warnings, storage errors, and scheduled job failures. Use a defined time window so the same old message does not appear as a new incident every week.
Summarize patterns rather than copying pages of output. For example, "twelve payment worker timeouts appeared after Tuesday's release" is more useful than a large log attachment. Include the first occurrence, recent frequency, likely impact, and one recommended next step.
Validate ports, listeners, and network reachability
Review listening sockets with ss -lntup and compare them with the services the host is supposed to expose. Unexpected listeners deserve investigation; missing listeners can reveal a service that failed to bind. Confirm that administrative ports are restricted through host and cloud firewalls rather than relying only on an application login screen.
Then test the path users depend on: DNS resolution, TLS negotiation, HTTP response, database reachability from the application tier, or queue connectivity. A localhost check may pass while a firewall, load balancer, certificate, or routing problem blocks real traffic. Linux server monitoring should include the service path, not only the machine.
Review security and patch signals
A weekly health check is not a full security audit, but it should catch obvious operational risk. Review available security updates, failed login patterns, unexpected accounts or privilege changes, expiring certificates, firewall changes, and whether endpoint or vulnerability tooling is reporting failures.
Do not apply every update blindly during the review. Record what is pending, assess urgency and compatibility, schedule an appropriate maintenance window, and confirm that a recovery path exists. The useful outcome is a controlled patch decision rather than an untracked package change on a production host.
Prove that scheduled jobs and backups worked
Cron and systemd timers can exist without producing successful results. Check recent execution status for cleanup tasks, certificate renewal, reporting jobs, imports, and backups. Verify timestamps, exit status, and output rather than assuming the scheduler entry means the job completed.
For backups, confirm that a recent artifact exists, its size is plausible, retention is working, and off-host copies reached their destination. A successful backup command is still incomplete evidence if the resulting file is empty, corrupted, inaccessible, or never tested. Keep the date of the most recent restore test in the weekly report.
Use a compact weekly checklist
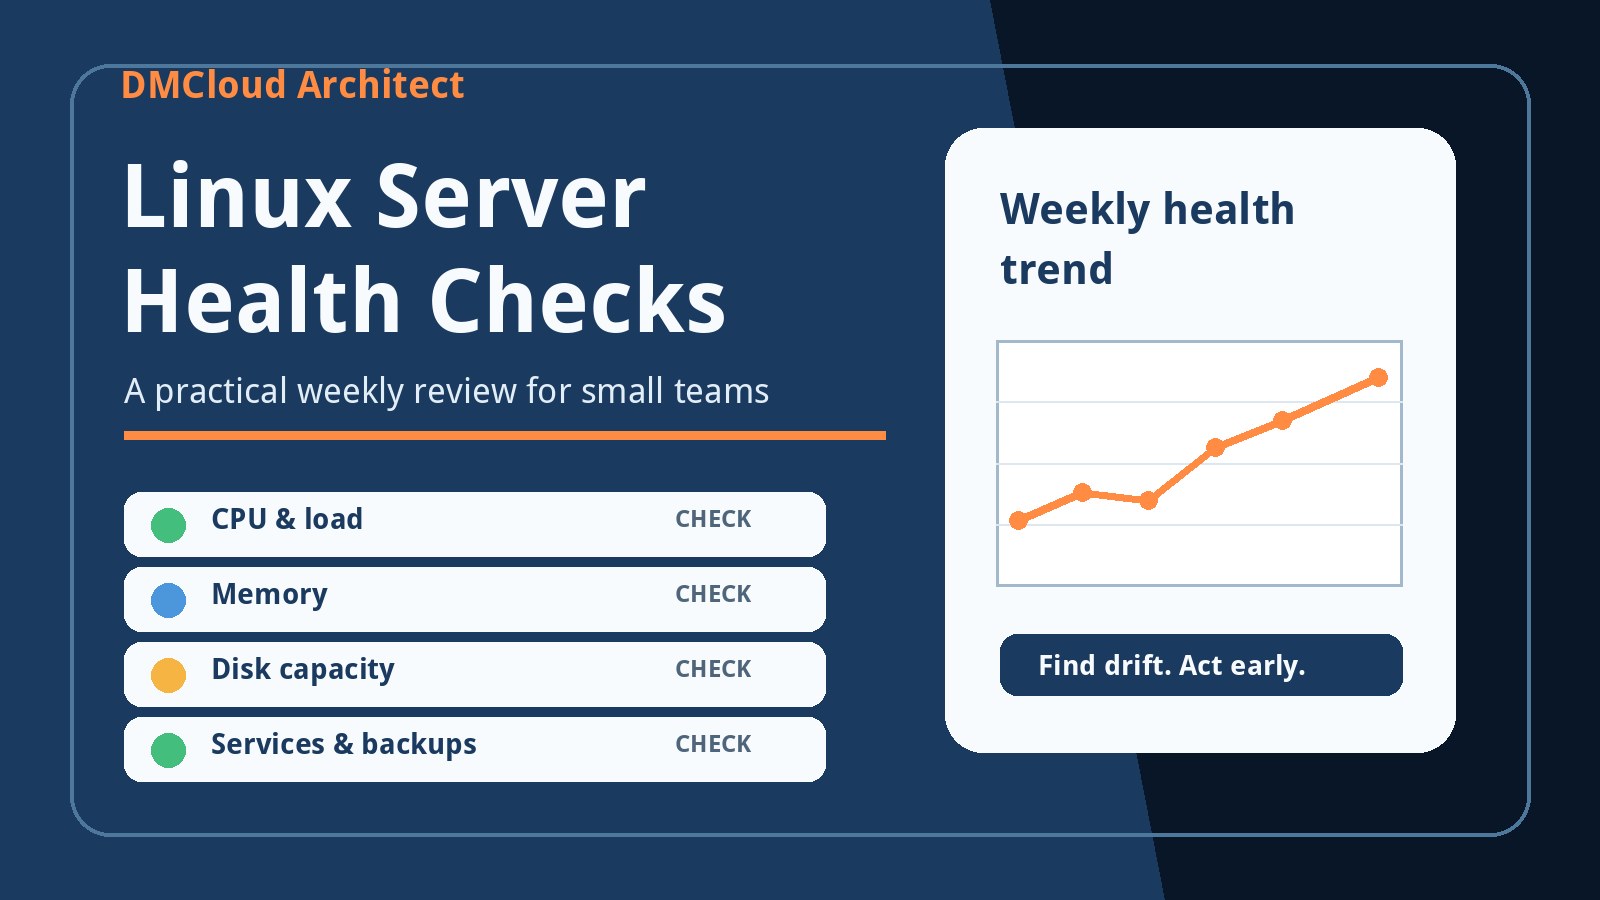
A lightweight Linux monitoring setup can stay focused on these checks:
- Confirm uptime, expected restarts, and reachability.
- Compare CPU load and busy processes with available CPU capacity.
- Review available memory, swap activity, and OOM events.
- Check filesystem capacity, inode use, and week-over-week growth.
- Look for storage, filesystem, or I/O warnings.
- Verify critical services function and are not restarting repeatedly.
- Summarize new error, authentication, and application log patterns.
- Compare listeners and network paths with the intended exposure.
- Review security updates, certificates, access, and firewall changes.
- Validate scheduled jobs, backup artifacts, retention, and restore-test status.
Turn results into clear status and action
End the review with a short status for each area: healthy, watch, or action needed. Every watch or action item should explain the evidence, likely effect, owner, and next step. "Disk watch: root filesystem grew from 58% to 68% because application logs stopped rotating; repair rotation by Wednesday" is specific enough to manage.
Store the summary so next week's values have context. This is where lightweight Linux monitoring becomes valuable: the team can see whether load, memory, disk, errors, and backup duration are stable or drifting. A short history catches slow problems that one-time spot checks miss.
Keep the process useful for a small team
Linux monitoring tools should reduce uncertainty, not create another screen that somebody must watch all day. Automate safe data collection, but keep the report readable. Highlight meaningful changes, suppress unchanged detail, and recommend a small number of actions.
DMCloud Architect provides weekly Linux and MySQL infrastructure health reports for developers and small business owners who want useful trend visibility without dashboard fatigue. See how the Infrastructure Health Reporting service turns recurring server checks into a clear weekly report.