Back to Blog
Monitoring for Lean Teams: A Practical Server Health System Without Dashboard Fatigue

Monitoring for Lean Teams: A Practical Server Health System Without Dashboard Fatigue

   Mariusz Antonik    Automation    6 min read    20 views

Lean teams do not need monitoring that feels like another product to operate. They need a simple way to know whether the servers, databases, backups, and capacity risks behind the business are healthy enough to trust this week. Monitoring for lean teams works when it creates useful decisions, not when it creates more dashboards to ignore.

For a developer, founder, or small business owner, infrastructure monitoring has to fit around real work. The goal is not to copy an enterprise observability stack. The goal is to catch the problems most likely to hurt customers, sales, support, or delivery before they become surprise outages.

Start with the risks that actually matter

A lean monitoring plan should begin with the services the business depends on. That usually means the public website or app, Linux server health, database health, disk usage, backups, SSL certificates, and the background jobs that keep the system current. These checks are not glamorous, but they are the ones that often decide whether Monday starts normally or with an emergency.

List the few failure modes that would create visible pain. A full disk can stop uploads or database writes. A failed backup can turn a minor incident into a business risk. A slow MySQL query pattern can make the site feel unreliable before anyone knows why. Monitoring should make those issues visible in plain language.

Choose a weekly rhythm before adding tools

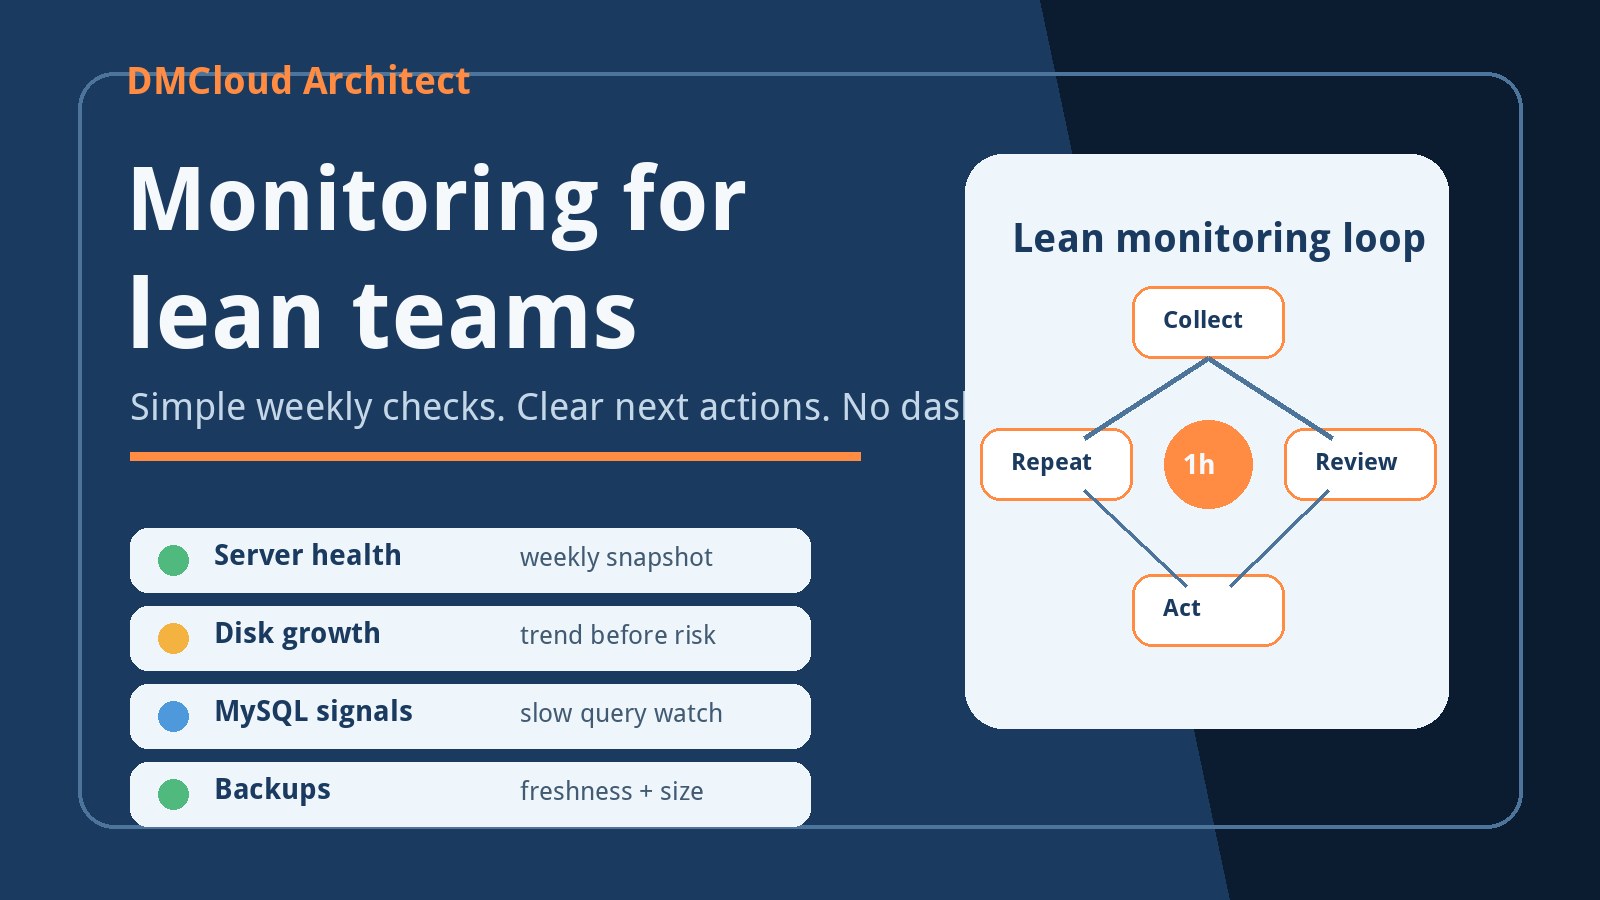
Many teams start with tools and then drown in alerts. A better starting point is a rhythm: what should be checked every week, who reviews it, and what counts as action needed? This keeps the monitoring system practical even if the technical setup changes later.

A weekly infrastructure health review is enough for many small environments. It gives you a repeatable checkpoint for server load, memory pressure, disk growth, backup freshness, database signals, certificate dates, and recent errors. Urgent outages still need immediate alerts, but the weekly review catches slow-moving risk that urgent alerts often miss.

Keep the signal set small

Monitoring without complexity means refusing to track every possible metric at the beginning. Start with a small set of signals that explain business risk clearly:

  • Availability: whether important sites, APIs, and scheduled jobs are reachable.
  • Capacity: CPU load, memory pressure, disk usage, and growth trends.
  • Database health: slow queries, failed connections, table growth, and backup impact.
  • Backups: latest successful run, size changes, retention, and restore readiness.
  • Security basics: certificate expiry, failed login patterns, package updates, and firewall assumptions.

This is enough to find many infrastructure problems early. You can add more detail later, but the first version should be easy to read and easy to act on.

Turn metrics into statuses

A simple monitoring system should not require someone to interpret raw numbers every time. Convert important checks into statuses such as healthy, watch, action needed, or critical. Then attach one short reason and one next action.

For example, “disk is 78% full” is a metric. “Watch: database volume grew 12 GB this week; review table growth and backup retention” is an operational signal. Lean teams need the second version because it points to what should happen next.

Use thresholds and trends together

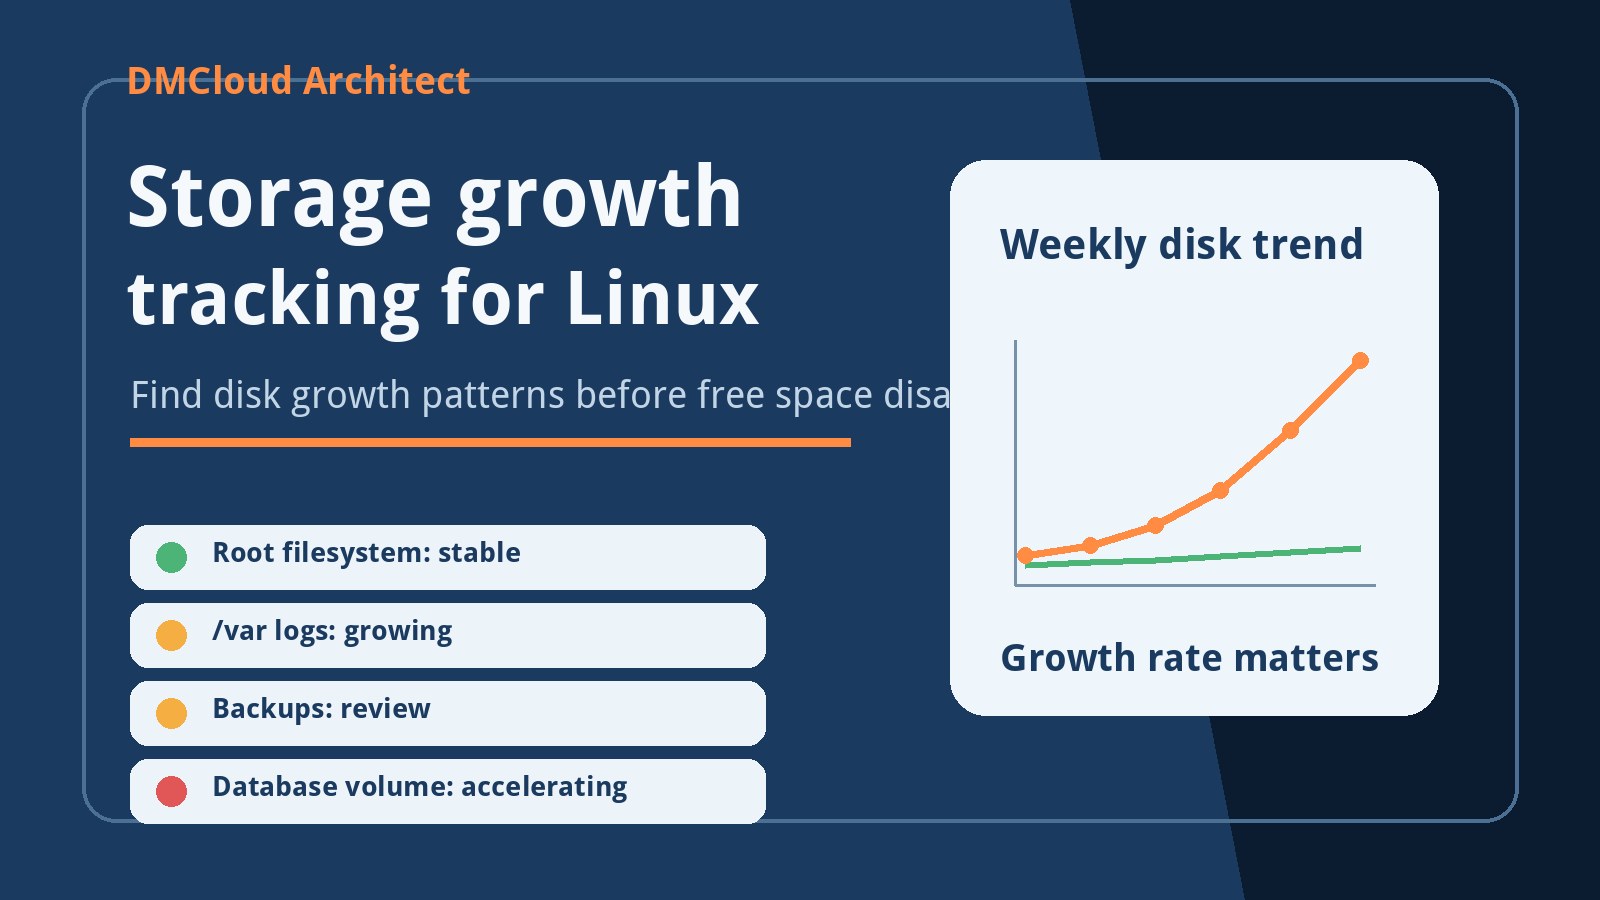
Thresholds are useful, but they do not tell the whole story. A server at 65% disk usage may be fine if it grows slowly. The same server may be risky if it is adding 8% per week. Practical server monitoring should look at both the current value and the direction of travel.

Trend checks are especially helpful for disk usage, database size, backup size, memory pressure, and response time. They make quiet problems easier to discuss before they become incidents. If your simple report shows that a problem is getting worse every week, you can schedule a fix instead of reacting at the worst possible moment.

Separate urgent alerts from weekly reporting

Lean teams still need immediate alerts for true emergencies: site down, certificate expired, backup repeatedly failing, database unavailable, or disk space critically low. But not every monitoring signal should become an interrupt. Too many alerts train people to ignore them.

Use urgent alerts for issues that need same-day action. Use weekly reporting for trends, warnings, cleanup opportunities, and planning. This split reduces noise while keeping infrastructure visible. It also gives owners a calmer way to make decisions about maintenance and capacity.

Make the report readable for non-specialists

Small teams often have mixed responsibilities. The person reviewing server health may also be managing clients, writing code, running ads, or handling support. A low maintenance monitoring process should explain impact in normal language.

Instead of only saying “load average increased,” say whether users are likely to feel it. Instead of only listing backup file sizes, say whether the latest backup is current and whether backup growth is normal. A useful report makes the technical state understandable enough for a practical decision.

A lean weekly monitoring checklist

Use this as a starting checklist for a simple infrastructure health review:

  • Confirm the main website or application is reachable from outside the server.
  • Review CPU load, memory pressure, and restart patterns.
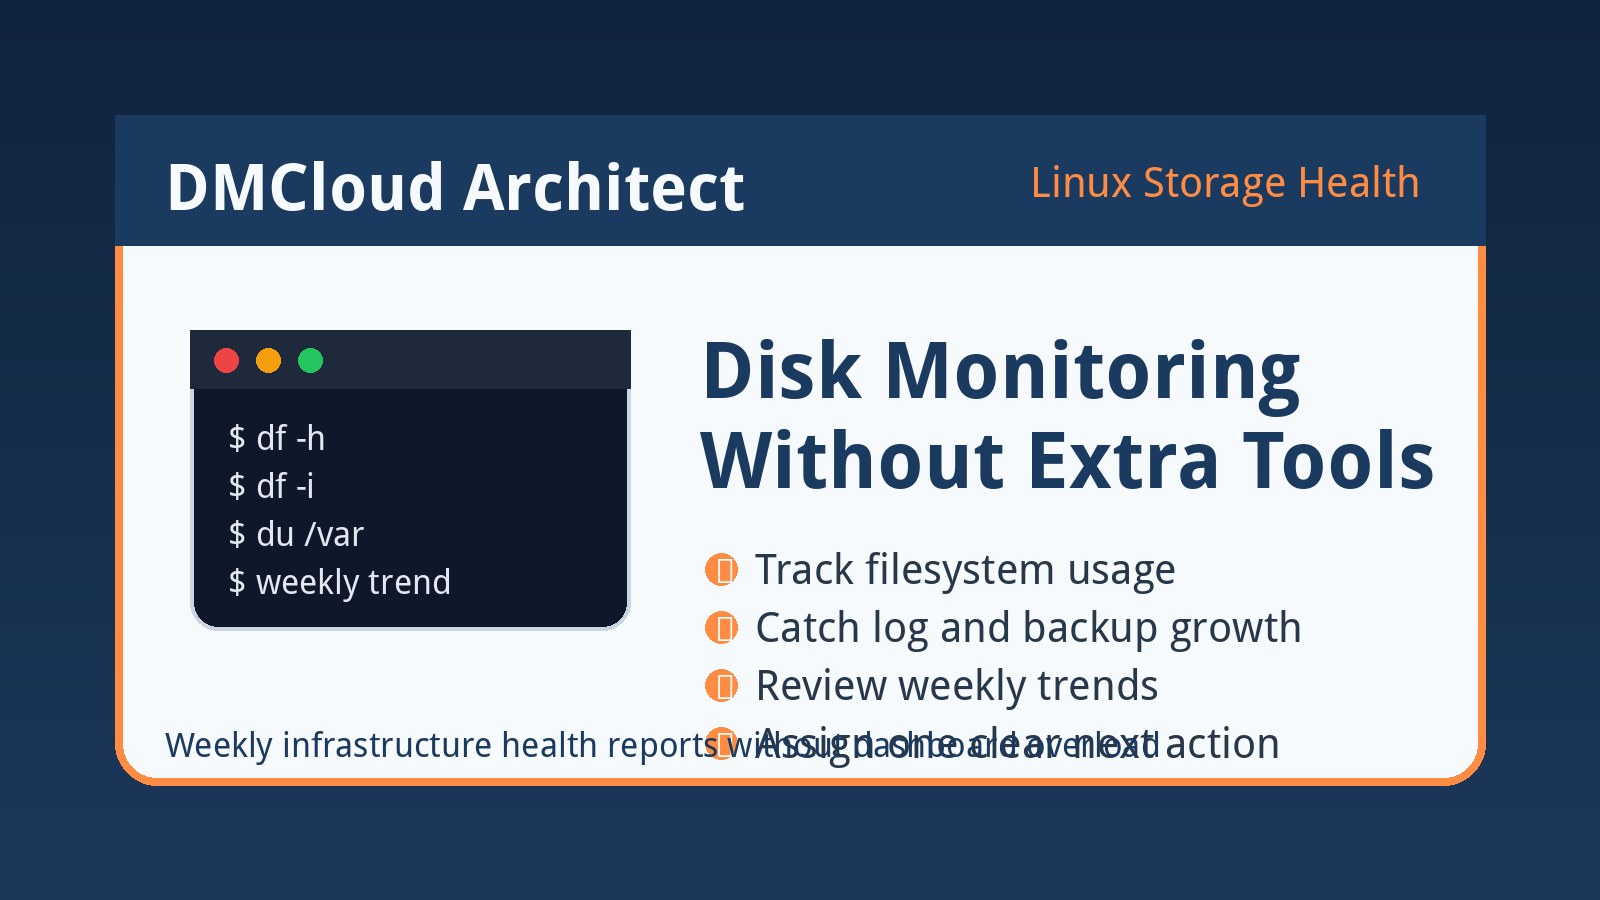
  • Check disk usage and compare disk growth with the previous week.
  • Review MySQL availability, slow queries, largest tables, and backup impact.
  • Confirm the latest backup completed and that backup size looks reasonable.
  • Check certificate expiry dates and obvious security warnings.
  • Review failed scheduled jobs, cron output, and important application errors.
  • Write one next action for every warning.

Review fewer things, but review them consistently

The strength of monitoring for lean teams is consistency. A modest report reviewed every week is usually better than a sophisticated dashboard nobody opens. Consistent review builds a baseline, and the baseline makes unusual changes easier to spot.

Over time, this also improves planning. Disk expansion, database cleanup, query tuning, backup retention, and server upgrades become scheduled tasks instead of emergencies. The team spends less time guessing and more time making small, informed improvements.

Build monitoring that respects your time

Easy infrastructure monitoring should protect the team’s attention. The system should collect the technical details, summarize the risk, and show the next action. If it only adds another screen to check, it is not lean enough.

DMCloud Architect provides weekly Linux and MySQL infrastructure health reports for teams that want useful monitoring without another dashboard to stare at. If you want a practical way to review server health, backups, disk growth, and database risks each week, start with the Infrastructure Health Reporting page.
About the Author
Mariusz Antonik

Oracle Cloud Infrastructure expert and consultant specializing in database management and automation.

All Tags
#Advanced #agent-visibility #alerts #amazon-linux-2023 #argo-cd #auditd #automation #backend-infrastructure #backup-setup #backup-verification #backups #bandwidth-monitoring #bare-metal-server #Bash #bash cpu monitoring script #bash monitoring #bash scripting #bash-automation #bash-scripts #Beginner #Best Practices #bind-dns #block volume backup #brute-force-protection #Capacity Planning #centos-7 #centos-ftp-migration #centralized-logging #chromebook-linux #cifs-mounts #cloud backup strategy #cloud-costs #cloud-database-setup #cloud-networking #cloudflare-workers #compute #container-monitoring #control-panel-security #cpu bottleneck #CPU Monitoring #cpu monitoring linux #cpu monitoring script linux #cpu trends #cpu usage trends #cpu usage trends linux #cpu-monitoring-script #cpu-monitoring-without-tools #cpu-performance-decline-server #cpu-performance-degradation-linux #cpu-usage-history-linux #create oracle db system in oci #cron #cron cpu monitoring #cron cpu monitoring linux #cron jobs #cron-monitoring #custom-linux-distribution #cve-advisory #database #database monitoring #database performance #database-health #database-migration #database-setup #debian #detect slow queries mysql #devops #devops-checklist #devops-help #devops-learning #disk capacity planning server #disk forecasting linux #disk growth trend linux #Disk Monitoring #disk usage #disk usage script linux #disk usage trends #disk-capacity #disk-growth #disk-saturation-detection-linux #disk-usage-history-linux #dns-migration #dnssec #Early Detection #easy infrastructure monitoring #egress-monitoring #elasticsearch #exposed-port-monitoring #fail2ban #field-server-checklist #firewall-rules #fleet-ops #free-tier #freelance-sysadmin #gitops-security #growth-trends #Guide #health dashboards #Health Reporting #historical server monitoring #historical-monitoring #home-lab #how to monitor cpu usage linux #https-certificates #infrastructure #infrastructure health #infrastructure health dashboard #infrastructure health reporting #infrastructure monitoring #infrastructure monitoring report #infrastructure trends #infrastructure trends monitoring #Infrastructure Visibility #infrastructure-automation #infrastructure-checklist #infrastructure-reporting #interview-prep #ip-allowlist #iproute2 #journald #kubernetes-security #latency-checks #lightweight linux monitoring #lightweight monitoring #lightweight-monitoring-solution #linux #linux administration #linux cpu monitoring #linux cpu usage #linux disk capacity planning #linux disk usage #Linux monitoring #linux monitoring setup #linux monitoring tools #linux performance #linux performance monitoring #linux server #linux server monitoring #linux servers #linux storage #linux tools #linux-admin #linux-disk-monitoring #linux-file-sharing #linux-hardening #linux-hotspot #linux-monitoring-for-small-business #linux-networking #linux-performance-tuning #linux-remote-desktop #linux-security #linux-server-health #local-dns #local-network #log-management #log-retention #logrotate #loki #low maintenance monitoring #mkcert #monitor cpu usage over time linux #monitor linux server health #monitor server trends #monitor small production server #monitor-server-trends-over-time #monitoring #monitoring without complexity #monitoring-agent #monitoring-for-lean-teams #monitoring-without-devops-team #MySQL #mysql health reporting #MySQL monitoring #mysql optimization #MySQL Performance #mysql performance degradation #mysql performance monitoring #mysql performance trends #mysql query performance issues #mysql server monitoring #mysql slow queries #mysql slow query analysis #mysql slow query monitoring #mysql trends #mysql-health #mysql-heatwave #mysql-indexing #mysql-monitoring-lightweight #mysql-slow-query #mysql-workload-trends #network-automation #network-monitoring #networking #networkpolicy #node-express #nsg #OCI #oci backup #oci bastion tutorial #oci block volume #oci infrastructure as code #OCI monitoring #oci networking #oci oracle database private subnet setup #oci oracle database tutorial #oci security #oci setup guide #oci terraform tutorial #oci tutorial for beginners #oci vcn terraform #oci virtual machine db system guide #oci-database #oci-mysql-heatwave #oci-mysql-heatwave-tutorial #oci-subnets #offline-pwa #operations-checklist #oracle base database service tutorial #oracle cloud bastion #oracle cloud free tier tutorial #oracle cloud infrastructure step by step #oracle cloud infrastructure tutorial #oracle cloud storage #oracle database on oci setup #oracle-cloud #oracle-cloud-mysql-database-service #oracle-cloud-mysql-setup #oracle-cloud-vcn-setup #oracle-linux-9 #outbound-connections #patch-management #path-mtu-discovery #Performance #Performance Degradation #performance monitoring #performance trend monitoring #performance trends #ping-monitoring #plan disk growth server #plesk #practical server monitoring #predict disk usage growth #private instance access #process-monitoring #production-database #production-troubleshooting #proxmox #query optimization #query-trends #remote-workstation-security #rhel-tuned #rollback #route-tables #rsyslog #rtnetlink #samba-server #Security #security lists #security-hardening #security-monitoring #selinux #server #server health #server health reporting #server health weekly report #server monitoring #Server Performance #server trend analysis #server-audit #server-checklist #server-hardening #server-health-checklist #server-health-insights #server-security #server-security-audit #server-security-checklist #server-throughput #server-trends #server-troubleshooting #servers #service-worker #siem #simple cpu monitoring linux #simple linux monitoring #simple monitoring small business #simple monitoring system #simple ops monitoring #slow queries #slow query reporting mysql #slow-query-log #small business infrastructure #small business IT #small business servers #small infrastructure monitoring #small server monitoring #small-business-monitoring #small-business-security #small-business-tech #source-built-linux #ssh #ssh bastion #ssh-security #storage capacity planning linux #storage monitoring #subnets #sysadmin-checklist #sysadmin-lab #syscall-monitoring #System Health #system health reporting #systemd #tcp-mtu-probing #tcp-tuning #terraform oci compute #terraform oracle cloud infrastructure #track-disk-growth-linux #Trend Monitoring #trend-analysis #trends #tuned-adm #Tutorial #ufw #uptime-checks #uptime-monitoring #vcn #vcn-design #vector #vps-management #vps-setup #vsftpd #vulnerability-response #wazuh #weekly-reports #weekly-server-report #windows-agent #xrdp